
Key Insights
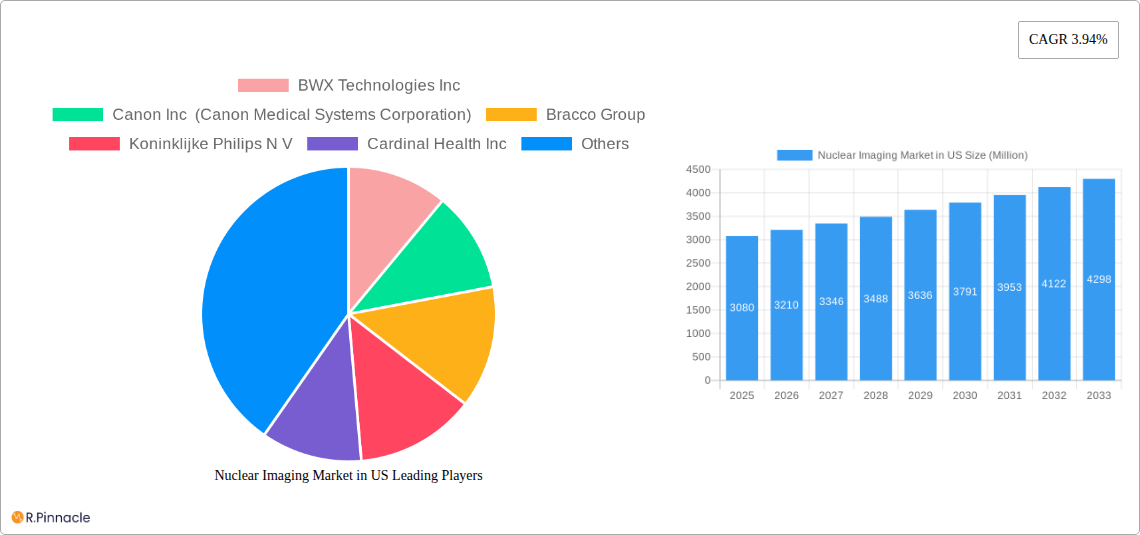
The US nuclear imaging market, valued at approximately $3.08 billion in 2025, is projected to experience robust growth, driven by several key factors. An aging population leading to increased prevalence of chronic diseases like cancer and cardiovascular conditions fuels demand for accurate and timely diagnostic tools. Technological advancements in PET/SPECT imaging systems, including improved resolution, faster scan times, and reduced radiation exposure, are significantly impacting market expansion. Furthermore, the rising adoption of hybrid imaging techniques, combining PET and CT or SPECT and CT, provides enhanced diagnostic capabilities, attracting more investment and driving market growth. Increased government funding for research and development in nuclear medicine and the rising awareness among healthcare professionals about the advantages of nuclear imaging techniques further contribute to market expansion.
However, market growth faces certain challenges. High costs associated with equipment acquisition, maintenance, and radioisotope production can limit accessibility, especially in smaller healthcare facilities. Stringent regulatory approvals and safety concerns surrounding the handling of radioactive materials impose additional barriers. The development and integration of alternative imaging technologies, like MRI and ultrasound, could potentially exert competitive pressure on the market. Despite these challenges, the market's inherent advantages in providing detailed functional and anatomical information for various diseases will support sustained growth throughout the forecast period (2025-2033), especially within the growing segments of PET and SPECT applications, and the corresponding increase in demand for specialized equipment and diagnostic radioisotopes.
Nuclear Imaging Market in US: A Comprehensive Report (2019-2033)
This in-depth report provides a comprehensive analysis of the Nuclear Imaging Market in the US, covering market structure, dynamics, leading players, and future outlook. The study period spans from 2019 to 2033, with 2025 as the base and estimated year. This report is invaluable for industry professionals, investors, and researchers seeking actionable insights into this dynamic sector.
Nuclear Imaging Market in US Market Structure & Innovation Trends
The US nuclear imaging market is characterized by a moderately concentrated structure with several key players dominating the landscape. Market share data reveals that the top five companies control approximately xx% of the market, while smaller players compete intensely in niche segments. Innovation is driven by advancements in imaging technology, radioisotope development, and data analytics. The regulatory framework, primarily overseen by the FDA, significantly influences market access and product approvals. Product substitutes, such as MRI and CT scans, exert competitive pressure, particularly in specific applications. The end-user demographic comprises hospitals, clinics, and diagnostic imaging centers, with a growing emphasis on outpatient facilities. M&A activity has been moderate in recent years, with deal values averaging around xx Million USD. Key metrics include:
- Market Concentration: Top 5 companies hold xx% market share (2025).
- Average M&A Deal Value: xx Million USD (2019-2024).
- Regulatory Framework: Primarily FDA-regulated, impacting product approvals and market entry.
Nuclear Imaging Market in US Market Dynamics & Trends
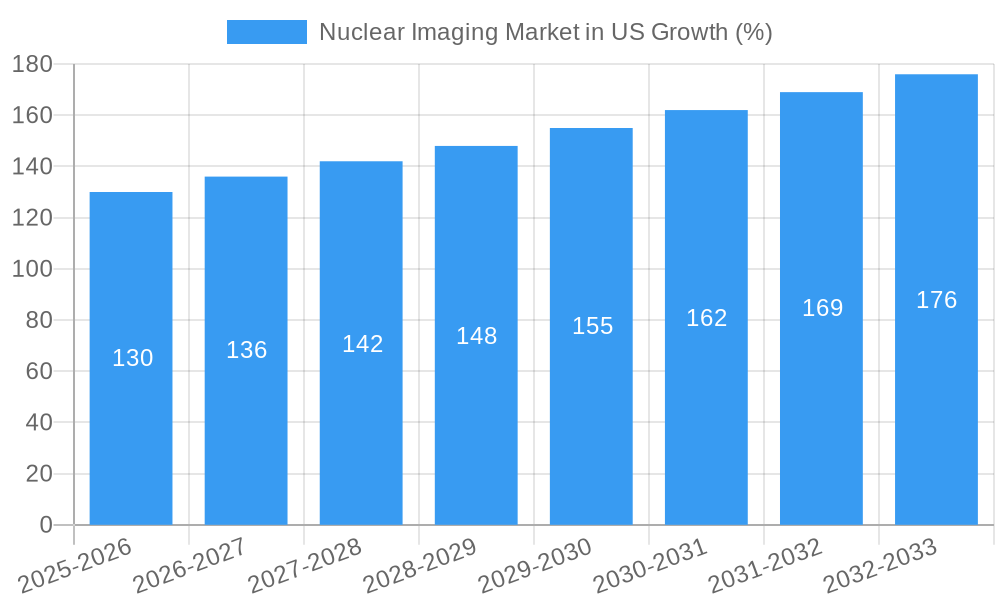
The US nuclear imaging market exhibits robust growth, driven by factors such as increasing prevalence of chronic diseases requiring advanced diagnostic tools, technological advancements leading to improved image quality and reduced radiation exposure, rising healthcare expenditure, and expanding applications in oncology, cardiology, and neurology. The market is experiencing technological disruptions from AI-powered image analysis and personalized medicine approaches. Consumer preference is shifting toward minimally invasive procedures and faster turnaround times for diagnostics. Competitive dynamics are intense, with companies focusing on innovation, strategic partnerships, and global expansion. The market is projected to experience a CAGR of xx% during the forecast period (2025-2033), with market penetration expected to reach xx% by 2033.
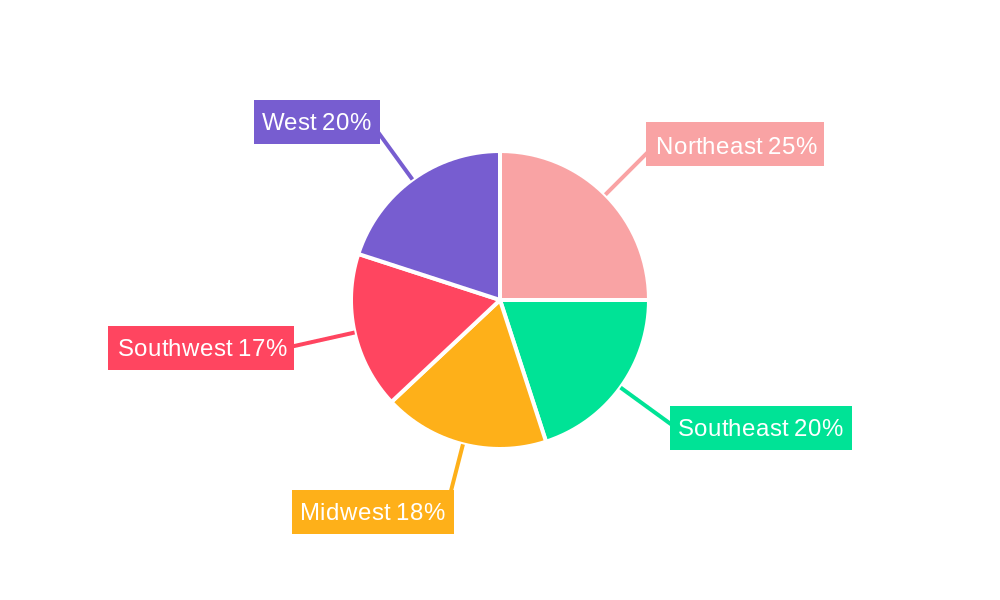
Dominant Regions & Segments in Nuclear Imaging Market in US
The Northeast region of the US dominates the nuclear imaging market due to factors such as a high concentration of hospitals and research institutions, advanced healthcare infrastructure, and robust government funding for research and development. Key drivers include:
- High concentration of healthcare facilities: Numerous hospitals and specialized clinics.
- Strong research infrastructure: Prominent medical schools and research institutions.
- Government funding: Significant federal and state investment in healthcare.
Segment Dominance:
- Product: The Equipment segment holds the largest market share (xx%) due to high initial investment and ongoing maintenance requirements. Diagnostic Radioisotope segment is expected to see significant growth due to expanding applications and increased demand.
- Application: PET Application holds a larger market share compared to SPECT due to its superior image resolution and more extensive applications in oncology.
Detailed analysis demonstrates that these segments are influenced by technological advancements, pricing dynamics and regulatory considerations.
Nuclear Imaging Market in US Product Innovations
Recent product innovations focus on improved image resolution, reduced radiation exposure, and enhanced diagnostic capabilities. This includes the integration of AI algorithms for automated image analysis and the development of novel radiotracers for specific diseases. These innovations are tailored to meet the growing demand for precise and efficient diagnostics, aligning with market trends toward personalized medicine and improved patient outcomes.
Report Scope & Segmentation Analysis
This report segments the US nuclear imaging market based on Product (Equipment and Diagnostic Radioisotope) and Application (SPECT and PET). The Equipment segment is further divided by modality (e.g., SPECT cameras, PET scanners). The Diagnostic Radioisotope segment includes various radiopharmaceuticals used in nuclear imaging. The Application segment classifies procedures based on the type of imaging technique. Each segment showcases specific growth projections, market sizes, and competitive dynamics. For example, the PET application segment is anticipated to witness the highest growth rate due to its superior imaging capabilities, leading to increased adoption across varied medical fields.
Key Drivers of Nuclear Imaging Market in US Growth
Several factors fuel the growth of the US nuclear imaging market. Technological advancements, such as the development of higher-resolution scanners and more sensitive radiotracers, are key drivers. Economic factors, like increased healthcare spending and insurance coverage, also contribute significantly. Further, supportive regulatory policies that encourage innovation and adoption of advanced imaging technologies play an important role in market expansion.
Challenges in the Nuclear Imaging Market in US Sector
Despite significant growth potential, the US nuclear imaging market faces challenges. Regulatory hurdles related to product approvals and reimbursement policies create uncertainties. Supply chain disruptions can impact the availability of radioisotopes and imaging equipment. Moreover, competition from alternative imaging modalities, such as MRI and CT scans, poses a significant challenge for market penetration. The cost associated with equipment and procedures present a barrier to affordability for certain patient populations.
Emerging Opportunities in Nuclear Imaging Market in US
Emerging opportunities lie in the development of novel radiotracers for targeted therapy, the integration of AI and machine learning for improved image analysis and disease detection, and the expansion of nuclear imaging applications into new therapeutic areas. The increasing focus on personalized medicine presents significant opportunities for customized diagnostic solutions. Furthermore, expansion into underserved markets and the adoption of telemedicine platforms offer exciting avenues for growth.
Leading Players in the Nuclear Imaging Market in US Market
- BWX Technologies Inc
- Canon Inc (Canon Medical Systems Corporation)
- Bracco Group
- Koninklijke Philips N V
- Cardinal Health Inc
- Siemens Healthineers AG
- Novartis AG (Advanced Accelerator Applications)
- GE Healthcare
- Curium
- Fujifilm Holdings Corporation
Key Developments in Nuclear Imaging Market in US Industry
- June 2022: The Mars Shot Fund, initiated by SNMMI, aims to raise USD 100 Million for nuclear medicine research; USD 600,000 pledged to date.
- March 2022: Canon Medical Systems USA, Inc. launches the "Canon Across America" mobile tour, showcasing AI-powered medical technology.
Future Outlook for Nuclear Imaging Market in US Market
The future of the US nuclear imaging market is promising, driven by continued technological innovation, increasing demand for advanced diagnostic tools, and expanding applications across various medical specialties. Strategic partnerships, investments in R&D, and focused marketing efforts will be key to capturing market share and achieving sustainable growth. The market is expected to witness strong growth momentum driven by these factors, presenting numerous strategic opportunities for market participants.
Nuclear Imaging Market in US Segmentation
-
1. Product
- 1.1. Equipment
-
1.2. Diagnostic Radioisotope
- 1.2.1. SPECT Radioisotopes
- 1.2.2. PET Radioisotopes
-
2. Application
-
2.1. SPECT Application
- 2.1.1. Cardiology
- 2.1.2. Neurology
- 2.1.3. Thyroid
- 2.1.4. Other SPECT Applications
-
2.2. PET Application
- 2.2.1. Oncology
- 2.2.2. Other PET Applications
-
2.1. SPECT Application
Nuclear Imaging Market in US Segmentation By Geography
-
1. North America
- 1.1. United States
- 1.2. Canada
- 1.3. Mexico
-
2. South America
- 2.1. Brazil
- 2.2. Argentina
- 2.3. Rest of South America
-
3. Europe
- 3.1. United Kingdom
- 3.2. Germany
- 3.3. France
- 3.4. Italy
- 3.5. Spain
- 3.6. Russia
- 3.7. Benelux
- 3.8. Nordics
- 3.9. Rest of Europe
-
4. Middle East & Africa
- 4.1. Turkey
- 4.2. Israel
- 4.3. GCC
- 4.4. North Africa
- 4.5. South Africa
- 4.6. Rest of Middle East & Africa
-
5. Asia Pacific
- 5.1. China
- 5.2. India
- 5.3. Japan
- 5.4. South Korea
- 5.5. ASEAN
- 5.6. Oceania
- 5.7. Rest of Asia Pacific
Nuclear Imaging Market in US REPORT HIGHLIGHTS
| Aspects | Details |
|---|---|
| Study Period | 2019-2033 |
| Base Year | 2024 |
| Estimated Year | 2025 |
| Forecast Period | 2025-2033 |
| Historical Period | 2019-2024 |
| Growth Rate | CAGR of 3.94% from 2019-2033 |
| Segmentation |
|
Table of Contents
- 1. Introduction
- 1.1. Research Scope
- 1.2. Market Segmentation
- 1.3. Research Methodology
- 1.4. Definitions and Assumptions
- 2. Executive Summary
- 2.1. Introduction
- 3. Market Dynamics
- 3.1. Introduction
- 3.2. Market Drivers
- 3.2.1. Increasing Prevalence of Chronic Diseases; Rising Geriatric Population; Increasing Technological Advancements
- 3.3. Market Restrains
- 3.3.1. Lack Of Proper Reimbursement And Stringent Regulatory Approval Procedures; High Cost of Equipment
- 3.4. Market Trends
- 3.4.1. Equipment Segment is Expected to Hold a Significant Market Share Over the Forecast Period
- 4. Market Factor Analysis
- 4.1. Porters Five Forces
- 4.2. Supply/Value Chain
- 4.3. PESTEL analysis
- 4.4. Market Entropy
- 4.5. Patent/Trademark Analysis
- 5. Global Nuclear Imaging Market in US Analysis, Insights and Forecast, 2019-2031
- 5.1. Market Analysis, Insights and Forecast - by Product
- 5.1.1. Equipment
- 5.1.2. Diagnostic Radioisotope
- 5.1.2.1. SPECT Radioisotopes
- 5.1.2.2. PET Radioisotopes
- 5.2. Market Analysis, Insights and Forecast - by Application
- 5.2.1. SPECT Application
- 5.2.1.1. Cardiology
- 5.2.1.2. Neurology
- 5.2.1.3. Thyroid
- 5.2.1.4. Other SPECT Applications
- 5.2.2. PET Application
- 5.2.2.1. Oncology
- 5.2.2.2. Other PET Applications
- 5.2.1. SPECT Application
- 5.3. Market Analysis, Insights and Forecast - by Region
- 5.3.1. North America
- 5.3.2. South America
- 5.3.3. Europe
- 5.3.4. Middle East & Africa
- 5.3.5. Asia Pacific
- 5.1. Market Analysis, Insights and Forecast - by Product
- 6. North America Nuclear Imaging Market in US Analysis, Insights and Forecast, 2019-2031
- 6.1. Market Analysis, Insights and Forecast - by Product
- 6.1.1. Equipment
- 6.1.2. Diagnostic Radioisotope
- 6.1.2.1. SPECT Radioisotopes
- 6.1.2.2. PET Radioisotopes
- 6.2. Market Analysis, Insights and Forecast - by Application
- 6.2.1. SPECT Application
- 6.2.1.1. Cardiology
- 6.2.1.2. Neurology
- 6.2.1.3. Thyroid
- 6.2.1.4. Other SPECT Applications
- 6.2.2. PET Application
- 6.2.2.1. Oncology
- 6.2.2.2. Other PET Applications
- 6.2.1. SPECT Application
- 6.1. Market Analysis, Insights and Forecast - by Product
- 7. South America Nuclear Imaging Market in US Analysis, Insights and Forecast, 2019-2031
- 7.1. Market Analysis, Insights and Forecast - by Product
- 7.1.1. Equipment
- 7.1.2. Diagnostic Radioisotope
- 7.1.2.1. SPECT Radioisotopes
- 7.1.2.2. PET Radioisotopes
- 7.2. Market Analysis, Insights and Forecast - by Application
- 7.2.1. SPECT Application
- 7.2.1.1. Cardiology
- 7.2.1.2. Neurology
- 7.2.1.3. Thyroid
- 7.2.1.4. Other SPECT Applications
- 7.2.2. PET Application
- 7.2.2.1. Oncology
- 7.2.2.2. Other PET Applications
- 7.2.1. SPECT Application
- 7.1. Market Analysis, Insights and Forecast - by Product
- 8. Europe Nuclear Imaging Market in US Analysis, Insights and Forecast, 2019-2031
- 8.1. Market Analysis, Insights and Forecast - by Product
- 8.1.1. Equipment
- 8.1.2. Diagnostic Radioisotope
- 8.1.2.1. SPECT Radioisotopes
- 8.1.2.2. PET Radioisotopes
- 8.2. Market Analysis, Insights and Forecast - by Application
- 8.2.1. SPECT Application
- 8.2.1.1. Cardiology
- 8.2.1.2. Neurology
- 8.2.1.3. Thyroid
- 8.2.1.4. Other SPECT Applications
- 8.2.2. PET Application
- 8.2.2.1. Oncology
- 8.2.2.2. Other PET Applications
- 8.2.1. SPECT Application
- 8.1. Market Analysis, Insights and Forecast - by Product
- 9. Middle East & Africa Nuclear Imaging Market in US Analysis, Insights and Forecast, 2019-2031
- 9.1. Market Analysis, Insights and Forecast - by Product
- 9.1.1. Equipment
- 9.1.2. Diagnostic Radioisotope
- 9.1.2.1. SPECT Radioisotopes
- 9.1.2.2. PET Radioisotopes
- 9.2. Market Analysis, Insights and Forecast - by Application
- 9.2.1. SPECT Application
- 9.2.1.1. Cardiology
- 9.2.1.2. Neurology
- 9.2.1.3. Thyroid
- 9.2.1.4. Other SPECT Applications
- 9.2.2. PET Application
- 9.2.2.1. Oncology
- 9.2.2.2. Other PET Applications
- 9.2.1. SPECT Application
- 9.1. Market Analysis, Insights and Forecast - by Product
- 10. Asia Pacific Nuclear Imaging Market in US Analysis, Insights and Forecast, 2019-2031
- 10.1. Market Analysis, Insights and Forecast - by Product
- 10.1.1. Equipment
- 10.1.2. Diagnostic Radioisotope
- 10.1.2.1. SPECT Radioisotopes
- 10.1.2.2. PET Radioisotopes
- 10.2. Market Analysis, Insights and Forecast - by Application
- 10.2.1. SPECT Application
- 10.2.1.1. Cardiology
- 10.2.1.2. Neurology
- 10.2.1.3. Thyroid
- 10.2.1.4. Other SPECT Applications
- 10.2.2. PET Application
- 10.2.2.1. Oncology
- 10.2.2.2. Other PET Applications
- 10.2.1. SPECT Application
- 10.1. Market Analysis, Insights and Forecast - by Product
- 11. Northeast Nuclear Imaging Market in US Analysis, Insights and Forecast, 2019-2031
- 12. Southeast Nuclear Imaging Market in US Analysis, Insights and Forecast, 2019-2031
- 13. Midwest Nuclear Imaging Market in US Analysis, Insights and Forecast, 2019-2031
- 14. Southwest Nuclear Imaging Market in US Analysis, Insights and Forecast, 2019-2031
- 15. West Nuclear Imaging Market in US Analysis, Insights and Forecast, 2019-2031
- 16. Competitive Analysis
- 16.1. Global Market Share Analysis 2024
- 16.2. Company Profiles
- 16.2.1 BWX Technologies Inc
- 16.2.1.1. Overview
- 16.2.1.2. Products
- 16.2.1.3. SWOT Analysis
- 16.2.1.4. Recent Developments
- 16.2.1.5. Financials (Based on Availability)
- 16.2.2 Canon Inc (Canon Medical Systems Corporation)
- 16.2.2.1. Overview
- 16.2.2.2. Products
- 16.2.2.3. SWOT Analysis
- 16.2.2.4. Recent Developments
- 16.2.2.5. Financials (Based on Availability)
- 16.2.3 Bracco Group
- 16.2.3.1. Overview
- 16.2.3.2. Products
- 16.2.3.3. SWOT Analysis
- 16.2.3.4. Recent Developments
- 16.2.3.5. Financials (Based on Availability)
- 16.2.4 Koninklijke Philips N V
- 16.2.4.1. Overview
- 16.2.4.2. Products
- 16.2.4.3. SWOT Analysis
- 16.2.4.4. Recent Developments
- 16.2.4.5. Financials (Based on Availability)
- 16.2.5 Cardinal Health Inc
- 16.2.5.1. Overview
- 16.2.5.2. Products
- 16.2.5.3. SWOT Analysis
- 16.2.5.4. Recent Developments
- 16.2.5.5. Financials (Based on Availability)
- 16.2.6 Siemens Healthineers AG
- 16.2.6.1. Overview
- 16.2.6.2. Products
- 16.2.6.3. SWOT Analysis
- 16.2.6.4. Recent Developments
- 16.2.6.5. Financials (Based on Availability)
- 16.2.7 Novartis AG (Advanced Accelerator Applications)
- 16.2.7.1. Overview
- 16.2.7.2. Products
- 16.2.7.3. SWOT Analysis
- 16.2.7.4. Recent Developments
- 16.2.7.5. Financials (Based on Availability)
- 16.2.8 GE Healthcare
- 16.2.8.1. Overview
- 16.2.8.2. Products
- 16.2.8.3. SWOT Analysis
- 16.2.8.4. Recent Developments
- 16.2.8.5. Financials (Based on Availability)
- 16.2.9 Curium
- 16.2.9.1. Overview
- 16.2.9.2. Products
- 16.2.9.3. SWOT Analysis
- 16.2.9.4. Recent Developments
- 16.2.9.5. Financials (Based on Availability)
- 16.2.10 Fujifilm Holdings Corporation
- 16.2.10.1. Overview
- 16.2.10.2. Products
- 16.2.10.3. SWOT Analysis
- 16.2.10.4. Recent Developments
- 16.2.10.5. Financials (Based on Availability)
- 16.2.1 BWX Technologies Inc
List of Figures
- Figure 1: Global Nuclear Imaging Market in US Revenue Breakdown (Million, %) by Region 2024 & 2032
- Figure 2: United states Nuclear Imaging Market in US Revenue (Million), by Country 2024 & 2032
- Figure 3: United states Nuclear Imaging Market in US Revenue Share (%), by Country 2024 & 2032
- Figure 4: North America Nuclear Imaging Market in US Revenue (Million), by Product 2024 & 2032
- Figure 5: North America Nuclear Imaging Market in US Revenue Share (%), by Product 2024 & 2032
- Figure 6: North America Nuclear Imaging Market in US Revenue (Million), by Application 2024 & 2032
- Figure 7: North America Nuclear Imaging Market in US Revenue Share (%), by Application 2024 & 2032
- Figure 8: North America Nuclear Imaging Market in US Revenue (Million), by Country 2024 & 2032
- Figure 9: North America Nuclear Imaging Market in US Revenue Share (%), by Country 2024 & 2032
- Figure 10: South America Nuclear Imaging Market in US Revenue (Million), by Product 2024 & 2032
- Figure 11: South America Nuclear Imaging Market in US Revenue Share (%), by Product 2024 & 2032
- Figure 12: South America Nuclear Imaging Market in US Revenue (Million), by Application 2024 & 2032
- Figure 13: South America Nuclear Imaging Market in US Revenue Share (%), by Application 2024 & 2032
- Figure 14: South America Nuclear Imaging Market in US Revenue (Million), by Country 2024 & 2032
- Figure 15: South America Nuclear Imaging Market in US Revenue Share (%), by Country 2024 & 2032
- Figure 16: Europe Nuclear Imaging Market in US Revenue (Million), by Product 2024 & 2032
- Figure 17: Europe Nuclear Imaging Market in US Revenue Share (%), by Product 2024 & 2032
- Figure 18: Europe Nuclear Imaging Market in US Revenue (Million), by Application 2024 & 2032
- Figure 19: Europe Nuclear Imaging Market in US Revenue Share (%), by Application 2024 & 2032
- Figure 20: Europe Nuclear Imaging Market in US Revenue (Million), by Country 2024 & 2032
- Figure 21: Europe Nuclear Imaging Market in US Revenue Share (%), by Country 2024 & 2032
- Figure 22: Middle East & Africa Nuclear Imaging Market in US Revenue (Million), by Product 2024 & 2032
- Figure 23: Middle East & Africa Nuclear Imaging Market in US Revenue Share (%), by Product 2024 & 2032
- Figure 24: Middle East & Africa Nuclear Imaging Market in US Revenue (Million), by Application 2024 & 2032
- Figure 25: Middle East & Africa Nuclear Imaging Market in US Revenue Share (%), by Application 2024 & 2032
- Figure 26: Middle East & Africa Nuclear Imaging Market in US Revenue (Million), by Country 2024 & 2032
- Figure 27: Middle East & Africa Nuclear Imaging Market in US Revenue Share (%), by Country 2024 & 2032
- Figure 28: Asia Pacific Nuclear Imaging Market in US Revenue (Million), by Product 2024 & 2032
- Figure 29: Asia Pacific Nuclear Imaging Market in US Revenue Share (%), by Product 2024 & 2032
- Figure 30: Asia Pacific Nuclear Imaging Market in US Revenue (Million), by Application 2024 & 2032
- Figure 31: Asia Pacific Nuclear Imaging Market in US Revenue Share (%), by Application 2024 & 2032
- Figure 32: Asia Pacific Nuclear Imaging Market in US Revenue (Million), by Country 2024 & 2032
- Figure 33: Asia Pacific Nuclear Imaging Market in US Revenue Share (%), by Country 2024 & 2032
List of Tables
- Table 1: Global Nuclear Imaging Market in US Revenue Million Forecast, by Region 2019 & 2032
- Table 2: Global Nuclear Imaging Market in US Revenue Million Forecast, by Product 2019 & 2032
- Table 3: Global Nuclear Imaging Market in US Revenue Million Forecast, by Application 2019 & 2032
- Table 4: Global Nuclear Imaging Market in US Revenue Million Forecast, by Region 2019 & 2032
- Table 5: Global Nuclear Imaging Market in US Revenue Million Forecast, by Country 2019 & 2032
- Table 6: Northeast Nuclear Imaging Market in US Revenue (Million) Forecast, by Application 2019 & 2032
- Table 7: Southeast Nuclear Imaging Market in US Revenue (Million) Forecast, by Application 2019 & 2032
- Table 8: Midwest Nuclear Imaging Market in US Revenue (Million) Forecast, by Application 2019 & 2032
- Table 9: Southwest Nuclear Imaging Market in US Revenue (Million) Forecast, by Application 2019 & 2032
- Table 10: West Nuclear Imaging Market in US Revenue (Million) Forecast, by Application 2019 & 2032
- Table 11: Global Nuclear Imaging Market in US Revenue Million Forecast, by Product 2019 & 2032
- Table 12: Global Nuclear Imaging Market in US Revenue Million Forecast, by Application 2019 & 2032
- Table 13: Global Nuclear Imaging Market in US Revenue Million Forecast, by Country 2019 & 2032
- Table 14: United States Nuclear Imaging Market in US Revenue (Million) Forecast, by Application 2019 & 2032
- Table 15: Canada Nuclear Imaging Market in US Revenue (Million) Forecast, by Application 2019 & 2032
- Table 16: Mexico Nuclear Imaging Market in US Revenue (Million) Forecast, by Application 2019 & 2032
- Table 17: Global Nuclear Imaging Market in US Revenue Million Forecast, by Product 2019 & 2032
- Table 18: Global Nuclear Imaging Market in US Revenue Million Forecast, by Application 2019 & 2032
- Table 19: Global Nuclear Imaging Market in US Revenue Million Forecast, by Country 2019 & 2032
- Table 20: Brazil Nuclear Imaging Market in US Revenue (Million) Forecast, by Application 2019 & 2032
- Table 21: Argentina Nuclear Imaging Market in US Revenue (Million) Forecast, by Application 2019 & 2032
- Table 22: Rest of South America Nuclear Imaging Market in US Revenue (Million) Forecast, by Application 2019 & 2032
- Table 23: Global Nuclear Imaging Market in US Revenue Million Forecast, by Product 2019 & 2032
- Table 24: Global Nuclear Imaging Market in US Revenue Million Forecast, by Application 2019 & 2032
- Table 25: Global Nuclear Imaging Market in US Revenue Million Forecast, by Country 2019 & 2032
- Table 26: United Kingdom Nuclear Imaging Market in US Revenue (Million) Forecast, by Application 2019 & 2032
- Table 27: Germany Nuclear Imaging Market in US Revenue (Million) Forecast, by Application 2019 & 2032
- Table 28: France Nuclear Imaging Market in US Revenue (Million) Forecast, by Application 2019 & 2032
- Table 29: Italy Nuclear Imaging Market in US Revenue (Million) Forecast, by Application 2019 & 2032
- Table 30: Spain Nuclear Imaging Market in US Revenue (Million) Forecast, by Application 2019 & 2032
- Table 31: Russia Nuclear Imaging Market in US Revenue (Million) Forecast, by Application 2019 & 2032
- Table 32: Benelux Nuclear Imaging Market in US Revenue (Million) Forecast, by Application 2019 & 2032
- Table 33: Nordics Nuclear Imaging Market in US Revenue (Million) Forecast, by Application 2019 & 2032
- Table 34: Rest of Europe Nuclear Imaging Market in US Revenue (Million) Forecast, by Application 2019 & 2032
- Table 35: Global Nuclear Imaging Market in US Revenue Million Forecast, by Product 2019 & 2032
- Table 36: Global Nuclear Imaging Market in US Revenue Million Forecast, by Application 2019 & 2032
- Table 37: Global Nuclear Imaging Market in US Revenue Million Forecast, by Country 2019 & 2032
- Table 38: Turkey Nuclear Imaging Market in US Revenue (Million) Forecast, by Application 2019 & 2032
- Table 39: Israel Nuclear Imaging Market in US Revenue (Million) Forecast, by Application 2019 & 2032
- Table 40: GCC Nuclear Imaging Market in US Revenue (Million) Forecast, by Application 2019 & 2032
- Table 41: North Africa Nuclear Imaging Market in US Revenue (Million) Forecast, by Application 2019 & 2032
- Table 42: South Africa Nuclear Imaging Market in US Revenue (Million) Forecast, by Application 2019 & 2032
- Table 43: Rest of Middle East & Africa Nuclear Imaging Market in US Revenue (Million) Forecast, by Application 2019 & 2032
- Table 44: Global Nuclear Imaging Market in US Revenue Million Forecast, by Product 2019 & 2032
- Table 45: Global Nuclear Imaging Market in US Revenue Million Forecast, by Application 2019 & 2032
- Table 46: Global Nuclear Imaging Market in US Revenue Million Forecast, by Country 2019 & 2032
- Table 47: China Nuclear Imaging Market in US Revenue (Million) Forecast, by Application 2019 & 2032
- Table 48: India Nuclear Imaging Market in US Revenue (Million) Forecast, by Application 2019 & 2032
- Table 49: Japan Nuclear Imaging Market in US Revenue (Million) Forecast, by Application 2019 & 2032
- Table 50: South Korea Nuclear Imaging Market in US Revenue (Million) Forecast, by Application 2019 & 2032
- Table 51: ASEAN Nuclear Imaging Market in US Revenue (Million) Forecast, by Application 2019 & 2032
- Table 52: Oceania Nuclear Imaging Market in US Revenue (Million) Forecast, by Application 2019 & 2032
- Table 53: Rest of Asia Pacific Nuclear Imaging Market in US Revenue (Million) Forecast, by Application 2019 & 2032
Frequently Asked Questions
1. What is the projected Compound Annual Growth Rate (CAGR) of the Nuclear Imaging Market in US?
The projected CAGR is approximately 3.94%.
2. Which companies are prominent players in the Nuclear Imaging Market in US?
Key companies in the market include BWX Technologies Inc, Canon Inc (Canon Medical Systems Corporation), Bracco Group, Koninklijke Philips N V, Cardinal Health Inc, Siemens Healthineers AG, Novartis AG (Advanced Accelerator Applications), GE Healthcare, Curium, Fujifilm Holdings Corporation.
3. What are the main segments of the Nuclear Imaging Market in US?
The market segments include Product, Application.
4. Can you provide details about the market size?
The market size is estimated to be USD 3.08 Million as of 2022.
5. What are some drivers contributing to market growth?
Increasing Prevalence of Chronic Diseases; Rising Geriatric Population; Increasing Technological Advancements.
6. What are the notable trends driving market growth?
Equipment Segment is Expected to Hold a Significant Market Share Over the Forecast Period.
7. Are there any restraints impacting market growth?
Lack Of Proper Reimbursement And Stringent Regulatory Approval Procedures; High Cost of Equipment.
8. Can you provide examples of recent developments in the market?
In June 2022, The Mars Shot Fund was established by the Society of Nuclear Medicine and Molecular Imaging (SNMMI) as a campaign to generate USD 100 million to support nuclear medicine, molecular imaging, and therapeutic research. Grants and pledges of USD 600,000 have been made to the fund so far, and efforts are being made to boost federal spending on this problem.
9. What pricing options are available for accessing the report?
Pricing options include single-user, multi-user, and enterprise licenses priced at USD 3800, USD 4500, and USD 5800 respectively.
10. Is the market size provided in terms of value or volume?
The market size is provided in terms of value, measured in Million.
11. Are there any specific market keywords associated with the report?
Yes, the market keyword associated with the report is "Nuclear Imaging Market in US," which aids in identifying and referencing the specific market segment covered.
12. How do I determine which pricing option suits my needs best?
The pricing options vary based on user requirements and access needs. Individual users may opt for single-user licenses, while businesses requiring broader access may choose multi-user or enterprise licenses for cost-effective access to the report.
13. Are there any additional resources or data provided in the Nuclear Imaging Market in US report?
While the report offers comprehensive insights, it's advisable to review the specific contents or supplementary materials provided to ascertain if additional resources or data are available.
14. How can I stay updated on further developments or reports in the Nuclear Imaging Market in US?
To stay informed about further developments, trends, and reports in the Nuclear Imaging Market in US, consider subscribing to industry newsletters, following relevant companies and organizations, or regularly checking reputable industry news sources and publications.
Methodology
Step 1 - Identification of Relevant Samples Size from Population Database


Step 2 - Approaches for Defining Global Market Size (Value, Volume* & Price*)

Note*: In applicable scenarios
Step 3 - Data Sources
Primary Research
- Web Analytics
- Survey Reports
- Research Institute
- Latest Research Reports
- Opinion Leaders
Secondary Research
- Annual Reports
- White Paper
- Latest Press Release
- Industry Association
- Paid Database
- Investor Presentations

Step 4 - Data Triangulation
Involves using different sources of information in order to increase the validity of a study
These sources are likely to be stakeholders in a program - participants, other researchers, program staff, other community members, and so on.
Then we put all data in single framework & apply various statistical tools to find out the dynamic on the market.
During the analysis stage, feedback from the stakeholder groups would be compared to determine areas of agreement as well as areas of divergence


