
Key Insights
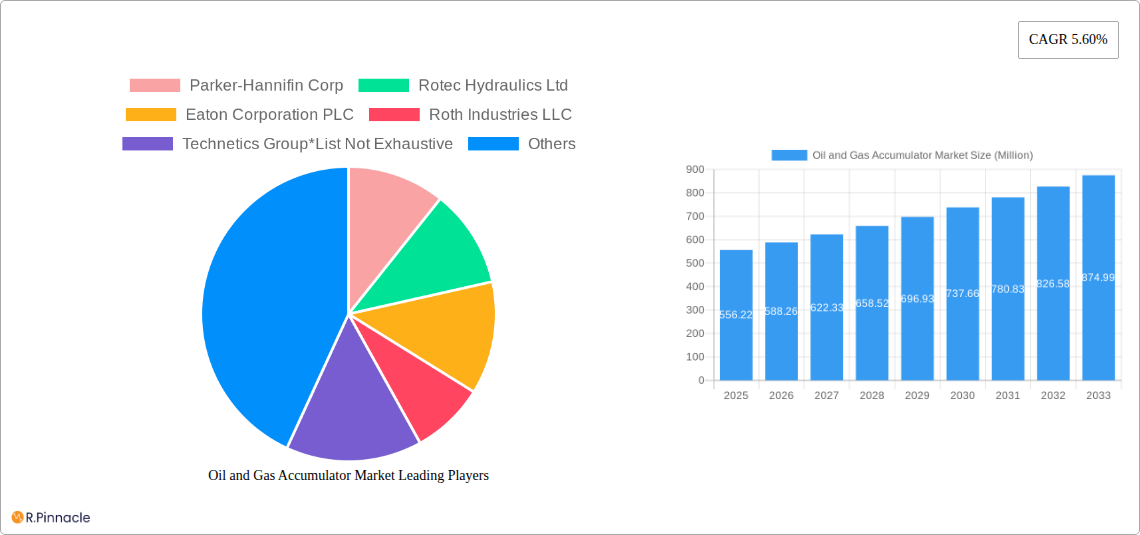
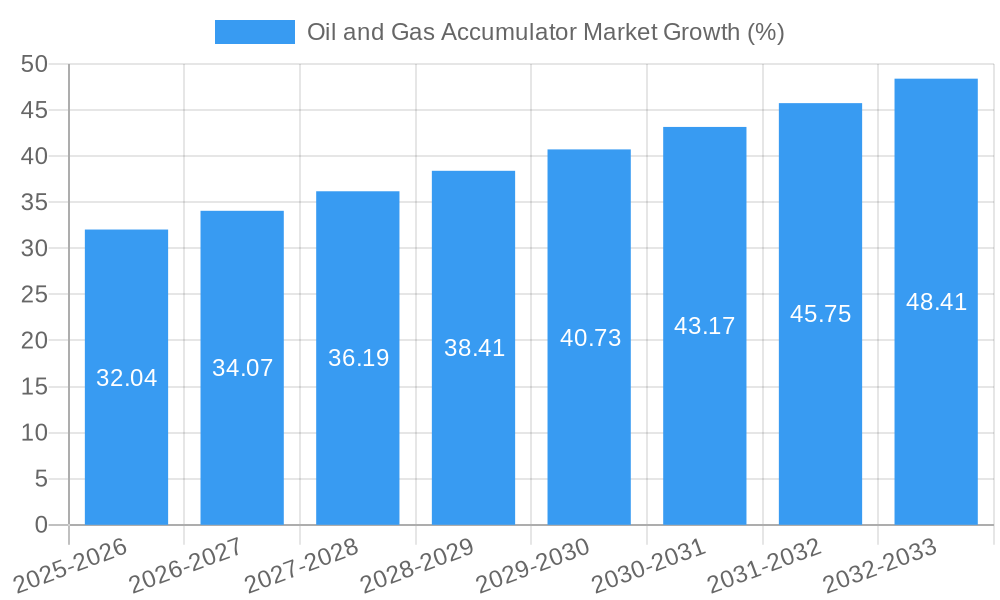
The oil and gas accumulator market, valued at $556.22 million in 2025, is projected to experience robust growth, driven by increasing demand for enhanced safety and efficiency in oil and gas operations. The market's Compound Annual Growth Rate (CAGR) of 5.60% from 2025 to 2033 indicates a significant expansion opportunity. Key drivers include the rising adoption of hydraulic fracturing techniques in unconventional oil and gas extraction, coupled with a growing focus on improving pressure regulation and surge protection within drilling, well workover, and intervention processes. The onshore segment currently holds a larger market share compared to offshore, attributed to higher operational activity and a larger number of drilling sites on land. However, offshore deployment is expected to witness notable growth, driven by increasing exploration and production in deepwater environments. Technological advancements in accumulator design, leading to improved durability, reliability, and reduced maintenance requirements, are further fueling market expansion. Furthermore, stringent safety regulations within the oil and gas industry necessitate the use of accumulators, providing a stable and predictable market foundation. Competition is relatively concentrated, with key players focusing on innovation and expansion into emerging markets.
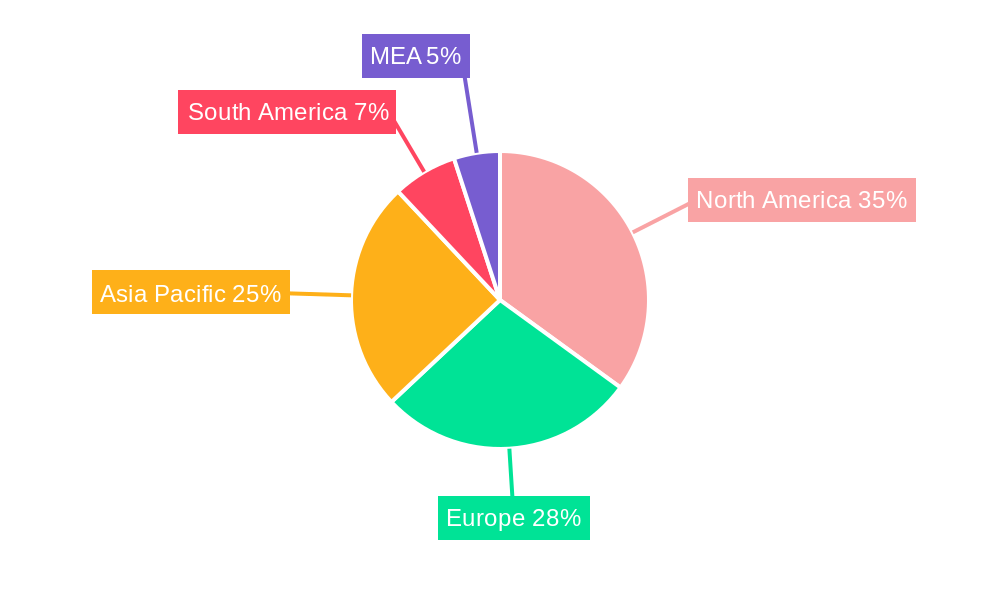
The geographical distribution of the market shows North America and Europe as significant revenue generators currently. However, rapid industrialization and increasing oil and gas activities in Asia-Pacific, particularly in China and India, are predicted to substantially enhance market growth in this region over the forecast period. South America and the Middle East and Africa regions also present considerable growth potential due to burgeoning exploration and production activities. The market segmentation by application highlights the dominance of the drilling sector, with the well workover and intervention segment experiencing steady growth due to aging infrastructure and the need for regular maintenance. The "others" category likely encompasses a variety of niche applications within the oil and gas sector that are continuously expanding, albeit more slowly. Strategic partnerships, acquisitions, and technological innovations will play crucial roles in shaping the competitive landscape and future market dynamics.
Oil and Gas Accumulator Market Report: 2019-2033
This comprehensive report provides a detailed analysis of the Oil and Gas Accumulator market, offering invaluable insights for industry professionals, investors, and strategic decision-makers. Covering the period 2019-2033, with a focus on 2025, this report meticulously examines market dynamics, technological advancements, and competitive landscapes to provide a clear understanding of the industry's trajectory.
Oil and Gas Accumulator Market Structure & Innovation Trends
The Oil and Gas Accumulator market exhibits a moderately concentrated structure, with key players such as Parker-Hannifin Corp, Eaton Corporation PLC, and Hydac holding significant market share. However, the presence of several smaller, specialized players fosters healthy competition. The market share distribution in 2025 is estimated as follows: Parker-Hannifin Corp (xx%), Eaton Corporation PLC (xx%), Hydac (xx%), Others (xx%). Innovation in the sector is driven by the increasing demand for enhanced efficiency, safety, and durability in oil and gas operations. This has led to the development of hybrid accumulators and advanced control systems. Regulatory frameworks, particularly those concerning safety and environmental impact, play a crucial role in shaping market dynamics. The market has witnessed several M&A activities in recent years, with deal values exceeding $xx Million in the last five years. These activities are primarily driven by a desire to expand product portfolios, enhance technological capabilities, and gain access to new markets. The ongoing trend of substituting traditional accumulators with more efficient and environmentally friendly alternatives is also a significant factor influencing market structure. End-user demographics are predominantly focused on established oil and gas companies, with a growing participation from smaller, independent operators.
Oil and Gas Accumulator Market Market Dynamics & Trends
The Oil and Gas Accumulator market is projected to witness robust growth during the forecast period (2025-2033), with a Compound Annual Growth Rate (CAGR) of xx%. This growth is primarily fueled by the expanding global demand for oil and gas, coupled with ongoing investments in exploration and production activities, particularly in offshore locations. Technological advancements, such as the introduction of hybrid accumulators and improved control systems, significantly enhance efficiency and reduce operational costs, further driving market expansion. Market penetration of advanced accumulator technologies is steadily increasing, with a projected xx% market share by 2033. The competitive landscape is characterized by intense competition amongst established players and the emergence of innovative startups offering niche solutions. Consumer preferences are shifting towards energy-efficient and environmentally sustainable solutions, creating opportunities for manufacturers focusing on eco-friendly accumulator technologies.
Dominant Regions & Segments in Oil and Gas Accumulator Market
Leading Region: North America is currently the dominant region in the Oil and Gas Accumulator market, fueled by robust oil and gas production activities and significant investments in infrastructure development.
Leading Application Segment: The Drilling segment holds the largest market share within the application category, driven by its crucial role in oil and gas extraction processes. Well Workover and Intervention are also significant segments, with increasing demand driven by the need for enhanced operational efficiency and safety.
Leading Deployment Location: Offshore deployment accounts for a significant portion of the market, driven by the expansion of offshore exploration and production activities.
Key Drivers for Regional Dominance:
- North America: Strong domestic oil and gas production, significant investments in infrastructure modernization, and supportive government policies.
- Offshore Deployment: Growing demand for oil and gas from offshore sources, technological advancements in deepwater drilling, and increased investment in offshore infrastructure.
The dominance analysis indicates a strong correlation between the regions' and segments' robust oil and gas activity and their substantial market share in the Oil and Gas Accumulator sector.
Oil and Gas Accumulator Market Product Innovations
Recent advancements in accumulator technology include the introduction of hybrid accumulators, offering improved energy efficiency and reduced environmental impact. These innovations cater to the growing demand for environmentally conscious solutions within the oil and gas industry. Furthermore, the development of advanced control systems enhances the precision and reliability of accumulator operation, improving overall performance and safety. The market is witnessing a clear trend toward sophisticated, high-performance accumulators designed to withstand harsh operational conditions and deliver improved longevity, significantly impacting operational costs and enhancing efficiency.
Report Scope & Segmentation Analysis
The report segments the Oil and Gas Accumulator market based on application (Drilling, Well Workover and Intervention, Others) and location of deployment (Onshore, Offshore). Each segment exhibits unique growth projections, market sizes, and competitive dynamics. The Drilling segment is expected to experience significant growth due to increasing drilling activities globally. The Well Workover and Intervention segment is also expected to grow steadily, driven by a need for improved well maintenance and intervention techniques. The Others segment, encompassing smaller applications, will show moderate growth. Onshore deployment currently holds a larger market share, but Offshore is anticipated to demonstrate higher growth rates due to increasing offshore exploration and production activities.
Key Drivers of Oil and Gas Accumulator Market Growth
The Oil and Gas Accumulator market is primarily driven by the continuous growth in global oil and gas demand, coupled with rising investments in exploration and production activities. Technological advancements, particularly in the development of hybrid accumulators and advanced control systems, significantly enhance efficiency and reduce operational costs. Stringent regulatory frameworks emphasizing safety and environmental protection drive the adoption of advanced and sustainable accumulator technologies. The expanding use of hydraulic systems in drilling and production activities, combined with the rising demand for high-pressure applications, further fuels market growth.
Challenges in the Oil and Gas Accumulator Market Sector
The Oil and Gas Accumulator market faces challenges such as volatile oil and gas prices, which can impact investment decisions and project timelines. Supply chain disruptions and material cost fluctuations present ongoing uncertainties. Intense competition among established players and the emergence of new entrants create pressure on margins and market share. Stringent regulatory compliance requirements and the need for specialized technical expertise add to the overall complexity of the market.
Emerging Opportunities in Oil and Gas Accumulator Market
Emerging opportunities lie in the development and adoption of eco-friendly accumulator technologies, driven by the growing emphasis on sustainability within the oil and gas industry. Expanding offshore exploration and production activities create significant demand for robust and reliable accumulator solutions. Advancements in control systems and automation offer opportunities for enhancing operational efficiency and reducing downtime. Furthermore, the exploration of new oil and gas reserves in untapped regions presents a growth opportunity for companies providing specialized accumulator solutions.
Leading Players in the Oil and Gas Accumulator Market Market
- Parker-Hannifin Corp
- Rotec Hydraulics Ltd
- Eaton Corporation PLC
- Roth Industries LLC
- Technetics Group
- Hydac
- Freudenberg Group
- Etola Group (Hydroll)
- Nippon Accumulator Co Ltd
- Paccar
Key Developments in Oil and Gas Accumulator Market Industry
- 2022: Introduction of a new hybrid accumulator model by Parker-Hannifin Corp, focusing on improved energy efficiency.
- 2023: Eaton Corporation PLC launched an advanced control system for accumulators, enhancing precision and reliability.
- Ongoing: Expansion of offshore oil and gas exploration and production activities globally is consistently driving demand for specialized accumulator solutions.
Future Outlook for Oil and Gas Accumulator Market Market
The Oil and Gas Accumulator market is poised for continued growth, driven by the ongoing expansion of oil and gas exploration and production activities, particularly in offshore locations. Technological advancements, including the development of more efficient and sustainable accumulator solutions, will play a critical role in shaping market dynamics. Strategic partnerships and mergers and acquisitions will likely continue to consolidate the market, enhancing the competitiveness and innovation capabilities of key players. The focus on enhancing operational efficiency, safety, and environmental sustainability will shape the future demand for advanced accumulator technologies.
Oil and Gas Accumulator Market Segmentation
-
1. Application
- 1.1. Drilling
- 1.2. Well Workover and Intrervention
- 1.3. Others
-
2. Location of Deployment
- 2.1. Onshore
- 2.2. Offshore
Oil and Gas Accumulator Market Segmentation By Geography
- 1. North America
- 2. Europe
- 3. Asia Pacific
- 4. South America
- 5. Middle East and Africa
Oil and Gas Accumulator Market REPORT HIGHLIGHTS
| Aspects | Details |
|---|---|
| Study Period | 2019-2033 |
| Base Year | 2024 |
| Estimated Year | 2025 |
| Forecast Period | 2025-2033 |
| Historical Period | 2019-2024 |
| Growth Rate | CAGR of 5.60% from 2019-2033 |
| Segmentation |
|
Table of Contents
- 1. Introduction
- 1.1. Research Scope
- 1.2. Market Segmentation
- 1.3. Research Methodology
- 1.4. Definitions and Assumptions
- 2. Executive Summary
- 2.1. Introduction
- 3. Market Dynamics
- 3.1. Introduction
- 3.2. Market Drivers
- 3.2.1. 4.; Growing Energy Demand4.; Renewable Energy Transition
- 3.3. Market Restrains
- 3.3.1. 4.; Phasing out of Conventional Sources of Electricity
- 3.4. Market Trends
- 3.4.1. Onshore Segment Expected to Dominate the Market
- 4. Market Factor Analysis
- 4.1. Porters Five Forces
- 4.2. Supply/Value Chain
- 4.3. PESTEL analysis
- 4.4. Market Entropy
- 4.5. Patent/Trademark Analysis
- 5. Global Oil and Gas Accumulator Market Analysis, Insights and Forecast, 2019-2031
- 5.1. Market Analysis, Insights and Forecast - by Application
- 5.1.1. Drilling
- 5.1.2. Well Workover and Intrervention
- 5.1.3. Others
- 5.2. Market Analysis, Insights and Forecast - by Location of Deployment
- 5.2.1. Onshore
- 5.2.2. Offshore
- 5.3. Market Analysis, Insights and Forecast - by Region
- 5.3.1. North America
- 5.3.2. Europe
- 5.3.3. Asia Pacific
- 5.3.4. South America
- 5.3.5. Middle East and Africa
- 5.1. Market Analysis, Insights and Forecast - by Application
- 6. North America Oil and Gas Accumulator Market Analysis, Insights and Forecast, 2019-2031
- 6.1. Market Analysis, Insights and Forecast - by Application
- 6.1.1. Drilling
- 6.1.2. Well Workover and Intrervention
- 6.1.3. Others
- 6.2. Market Analysis, Insights and Forecast - by Location of Deployment
- 6.2.1. Onshore
- 6.2.2. Offshore
- 6.1. Market Analysis, Insights and Forecast - by Application
- 7. Europe Oil and Gas Accumulator Market Analysis, Insights and Forecast, 2019-2031
- 7.1. Market Analysis, Insights and Forecast - by Application
- 7.1.1. Drilling
- 7.1.2. Well Workover and Intrervention
- 7.1.3. Others
- 7.2. Market Analysis, Insights and Forecast - by Location of Deployment
- 7.2.1. Onshore
- 7.2.2. Offshore
- 7.1. Market Analysis, Insights and Forecast - by Application
- 8. Asia Pacific Oil and Gas Accumulator Market Analysis, Insights and Forecast, 2019-2031
- 8.1. Market Analysis, Insights and Forecast - by Application
- 8.1.1. Drilling
- 8.1.2. Well Workover and Intrervention
- 8.1.3. Others
- 8.2. Market Analysis, Insights and Forecast - by Location of Deployment
- 8.2.1. Onshore
- 8.2.2. Offshore
- 8.1. Market Analysis, Insights and Forecast - by Application
- 9. South America Oil and Gas Accumulator Market Analysis, Insights and Forecast, 2019-2031
- 9.1. Market Analysis, Insights and Forecast - by Application
- 9.1.1. Drilling
- 9.1.2. Well Workover and Intrervention
- 9.1.3. Others
- 9.2. Market Analysis, Insights and Forecast - by Location of Deployment
- 9.2.1. Onshore
- 9.2.2. Offshore
- 9.1. Market Analysis, Insights and Forecast - by Application
- 10. Middle East and Africa Oil and Gas Accumulator Market Analysis, Insights and Forecast, 2019-2031
- 10.1. Market Analysis, Insights and Forecast - by Application
- 10.1.1. Drilling
- 10.1.2. Well Workover and Intrervention
- 10.1.3. Others
- 10.2. Market Analysis, Insights and Forecast - by Location of Deployment
- 10.2.1. Onshore
- 10.2.2. Offshore
- 10.1. Market Analysis, Insights and Forecast - by Application
- 11. North America Oil and Gas Accumulator Market Analysis, Insights and Forecast, 2019-2031
- 11.1. Market Analysis, Insights and Forecast - By Country/Sub-region
- 11.1.1 United States
- 11.1.2 Canada
- 11.1.3 Mexico
- 12. Europe Oil and Gas Accumulator Market Analysis, Insights and Forecast, 2019-2031
- 12.1. Market Analysis, Insights and Forecast - By Country/Sub-region
- 12.1.1 Germany
- 12.1.2 United Kingdom
- 12.1.3 France
- 12.1.4 Spain
- 12.1.5 Italy
- 12.1.6 Spain
- 12.1.7 Belgium
- 12.1.8 Netherland
- 12.1.9 Nordics
- 12.1.10 Rest of Europe
- 13. Asia Pacific Oil and Gas Accumulator Market Analysis, Insights and Forecast, 2019-2031
- 13.1. Market Analysis, Insights and Forecast - By Country/Sub-region
- 13.1.1 China
- 13.1.2 Japan
- 13.1.3 India
- 13.1.4 South Korea
- 13.1.5 Southeast Asia
- 13.1.6 Australia
- 13.1.7 Indonesia
- 13.1.8 Phillipes
- 13.1.9 Singapore
- 13.1.10 Thailandc
- 13.1.11 Rest of Asia Pacific
- 14. South America Oil and Gas Accumulator Market Analysis, Insights and Forecast, 2019-2031
- 14.1. Market Analysis, Insights and Forecast - By Country/Sub-region
- 14.1.1 Brazil
- 14.1.2 Argentina
- 14.1.3 Peru
- 14.1.4 Chile
- 14.1.5 Colombia
- 14.1.6 Ecuador
- 14.1.7 Venezuela
- 14.1.8 Rest of South America
- 15. North America Oil and Gas Accumulator Market Analysis, Insights and Forecast, 2019-2031
- 15.1. Market Analysis, Insights and Forecast - By Country/Sub-region
- 15.1.1 United States
- 15.1.2 Canada
- 15.1.3 Mexico
- 16. MEA Oil and Gas Accumulator Market Analysis, Insights and Forecast, 2019-2031
- 16.1. Market Analysis, Insights and Forecast - By Country/Sub-region
- 16.1.1 United Arab Emirates
- 16.1.2 Saudi Arabia
- 16.1.3 South Africa
- 16.1.4 Rest of Middle East and Africa
- 17. Competitive Analysis
- 17.1. Global Market Share Analysis 2024
- 17.2. Company Profiles
- 17.2.1 Parker-Hannifin Corp
- 17.2.1.1. Overview
- 17.2.1.2. Products
- 17.2.1.3. SWOT Analysis
- 17.2.1.4. Recent Developments
- 17.2.1.5. Financials (Based on Availability)
- 17.2.2 Rotec Hydraulics Ltd
- 17.2.2.1. Overview
- 17.2.2.2. Products
- 17.2.2.3. SWOT Analysis
- 17.2.2.4. Recent Developments
- 17.2.2.5. Financials (Based on Availability)
- 17.2.3 Eaton Corporation PLC
- 17.2.3.1. Overview
- 17.2.3.2. Products
- 17.2.3.3. SWOT Analysis
- 17.2.3.4. Recent Developments
- 17.2.3.5. Financials (Based on Availability)
- 17.2.4 Roth Industries LLC
- 17.2.4.1. Overview
- 17.2.4.2. Products
- 17.2.4.3. SWOT Analysis
- 17.2.4.4. Recent Developments
- 17.2.4.5. Financials (Based on Availability)
- 17.2.5 Technetics Group*List Not Exhaustive
- 17.2.5.1. Overview
- 17.2.5.2. Products
- 17.2.5.3. SWOT Analysis
- 17.2.5.4. Recent Developments
- 17.2.5.5. Financials (Based on Availability)
- 17.2.6 Hydac
- 17.2.6.1. Overview
- 17.2.6.2. Products
- 17.2.6.3. SWOT Analysis
- 17.2.6.4. Recent Developments
- 17.2.6.5. Financials (Based on Availability)
- 17.2.7 Freudenberg Group
- 17.2.7.1. Overview
- 17.2.7.2. Products
- 17.2.7.3. SWOT Analysis
- 17.2.7.4. Recent Developments
- 17.2.7.5. Financials (Based on Availability)
- 17.2.8 Etola Group (Hydroll)
- 17.2.8.1. Overview
- 17.2.8.2. Products
- 17.2.8.3. SWOT Analysis
- 17.2.8.4. Recent Developments
- 17.2.8.5. Financials (Based on Availability)
- 17.2.9 Nippon Accumulator Co Ltd
- 17.2.9.1. Overview
- 17.2.9.2. Products
- 17.2.9.3. SWOT Analysis
- 17.2.9.4. Recent Developments
- 17.2.9.5. Financials (Based on Availability)
- 17.2.10 Paccar
- 17.2.10.1. Overview
- 17.2.10.2. Products
- 17.2.10.3. SWOT Analysis
- 17.2.10.4. Recent Developments
- 17.2.10.5. Financials (Based on Availability)
- 17.2.1 Parker-Hannifin Corp
List of Figures
- Figure 1: Global Oil and Gas Accumulator Market Revenue Breakdown (Million, %) by Region 2024 & 2032
- Figure 2: Global Oil and Gas Accumulator Market Volume Breakdown (K Units, %) by Region 2024 & 2032
- Figure 3: North America Oil and Gas Accumulator Market Revenue (Million), by Country 2024 & 2032
- Figure 4: North America Oil and Gas Accumulator Market Volume (K Units), by Country 2024 & 2032
- Figure 5: North America Oil and Gas Accumulator Market Revenue Share (%), by Country 2024 & 2032
- Figure 6: North America Oil and Gas Accumulator Market Volume Share (%), by Country 2024 & 2032
- Figure 7: Europe Oil and Gas Accumulator Market Revenue (Million), by Country 2024 & 2032
- Figure 8: Europe Oil and Gas Accumulator Market Volume (K Units), by Country 2024 & 2032
- Figure 9: Europe Oil and Gas Accumulator Market Revenue Share (%), by Country 2024 & 2032
- Figure 10: Europe Oil and Gas Accumulator Market Volume Share (%), by Country 2024 & 2032
- Figure 11: Asia Pacific Oil and Gas Accumulator Market Revenue (Million), by Country 2024 & 2032
- Figure 12: Asia Pacific Oil and Gas Accumulator Market Volume (K Units), by Country 2024 & 2032
- Figure 13: Asia Pacific Oil and Gas Accumulator Market Revenue Share (%), by Country 2024 & 2032
- Figure 14: Asia Pacific Oil and Gas Accumulator Market Volume Share (%), by Country 2024 & 2032
- Figure 15: South America Oil and Gas Accumulator Market Revenue (Million), by Country 2024 & 2032
- Figure 16: South America Oil and Gas Accumulator Market Volume (K Units), by Country 2024 & 2032
- Figure 17: South America Oil and Gas Accumulator Market Revenue Share (%), by Country 2024 & 2032
- Figure 18: South America Oil and Gas Accumulator Market Volume Share (%), by Country 2024 & 2032
- Figure 19: North America Oil and Gas Accumulator Market Revenue (Million), by Country 2024 & 2032
- Figure 20: North America Oil and Gas Accumulator Market Volume (K Units), by Country 2024 & 2032
- Figure 21: North America Oil and Gas Accumulator Market Revenue Share (%), by Country 2024 & 2032
- Figure 22: North America Oil and Gas Accumulator Market Volume Share (%), by Country 2024 & 2032
- Figure 23: MEA Oil and Gas Accumulator Market Revenue (Million), by Country 2024 & 2032
- Figure 24: MEA Oil and Gas Accumulator Market Volume (K Units), by Country 2024 & 2032
- Figure 25: MEA Oil and Gas Accumulator Market Revenue Share (%), by Country 2024 & 2032
- Figure 26: MEA Oil and Gas Accumulator Market Volume Share (%), by Country 2024 & 2032
- Figure 27: North America Oil and Gas Accumulator Market Revenue (Million), by Application 2024 & 2032
- Figure 28: North America Oil and Gas Accumulator Market Volume (K Units), by Application 2024 & 2032
- Figure 29: North America Oil and Gas Accumulator Market Revenue Share (%), by Application 2024 & 2032
- Figure 30: North America Oil and Gas Accumulator Market Volume Share (%), by Application 2024 & 2032
- Figure 31: North America Oil and Gas Accumulator Market Revenue (Million), by Location of Deployment 2024 & 2032
- Figure 32: North America Oil and Gas Accumulator Market Volume (K Units), by Location of Deployment 2024 & 2032
- Figure 33: North America Oil and Gas Accumulator Market Revenue Share (%), by Location of Deployment 2024 & 2032
- Figure 34: North America Oil and Gas Accumulator Market Volume Share (%), by Location of Deployment 2024 & 2032
- Figure 35: North America Oil and Gas Accumulator Market Revenue (Million), by Country 2024 & 2032
- Figure 36: North America Oil and Gas Accumulator Market Volume (K Units), by Country 2024 & 2032
- Figure 37: North America Oil and Gas Accumulator Market Revenue Share (%), by Country 2024 & 2032
- Figure 38: North America Oil and Gas Accumulator Market Volume Share (%), by Country 2024 & 2032
- Figure 39: Europe Oil and Gas Accumulator Market Revenue (Million), by Application 2024 & 2032
- Figure 40: Europe Oil and Gas Accumulator Market Volume (K Units), by Application 2024 & 2032
- Figure 41: Europe Oil and Gas Accumulator Market Revenue Share (%), by Application 2024 & 2032
- Figure 42: Europe Oil and Gas Accumulator Market Volume Share (%), by Application 2024 & 2032
- Figure 43: Europe Oil and Gas Accumulator Market Revenue (Million), by Location of Deployment 2024 & 2032
- Figure 44: Europe Oil and Gas Accumulator Market Volume (K Units), by Location of Deployment 2024 & 2032
- Figure 45: Europe Oil and Gas Accumulator Market Revenue Share (%), by Location of Deployment 2024 & 2032
- Figure 46: Europe Oil and Gas Accumulator Market Volume Share (%), by Location of Deployment 2024 & 2032
- Figure 47: Europe Oil and Gas Accumulator Market Revenue (Million), by Country 2024 & 2032
- Figure 48: Europe Oil and Gas Accumulator Market Volume (K Units), by Country 2024 & 2032
- Figure 49: Europe Oil and Gas Accumulator Market Revenue Share (%), by Country 2024 & 2032
- Figure 50: Europe Oil and Gas Accumulator Market Volume Share (%), by Country 2024 & 2032
- Figure 51: Asia Pacific Oil and Gas Accumulator Market Revenue (Million), by Application 2024 & 2032
- Figure 52: Asia Pacific Oil and Gas Accumulator Market Volume (K Units), by Application 2024 & 2032
- Figure 53: Asia Pacific Oil and Gas Accumulator Market Revenue Share (%), by Application 2024 & 2032
- Figure 54: Asia Pacific Oil and Gas Accumulator Market Volume Share (%), by Application 2024 & 2032
- Figure 55: Asia Pacific Oil and Gas Accumulator Market Revenue (Million), by Location of Deployment 2024 & 2032
- Figure 56: Asia Pacific Oil and Gas Accumulator Market Volume (K Units), by Location of Deployment 2024 & 2032
- Figure 57: Asia Pacific Oil and Gas Accumulator Market Revenue Share (%), by Location of Deployment 2024 & 2032
- Figure 58: Asia Pacific Oil and Gas Accumulator Market Volume Share (%), by Location of Deployment 2024 & 2032
- Figure 59: Asia Pacific Oil and Gas Accumulator Market Revenue (Million), by Country 2024 & 2032
- Figure 60: Asia Pacific Oil and Gas Accumulator Market Volume (K Units), by Country 2024 & 2032
- Figure 61: Asia Pacific Oil and Gas Accumulator Market Revenue Share (%), by Country 2024 & 2032
- Figure 62: Asia Pacific Oil and Gas Accumulator Market Volume Share (%), by Country 2024 & 2032
- Figure 63: South America Oil and Gas Accumulator Market Revenue (Million), by Application 2024 & 2032
- Figure 64: South America Oil and Gas Accumulator Market Volume (K Units), by Application 2024 & 2032
- Figure 65: South America Oil and Gas Accumulator Market Revenue Share (%), by Application 2024 & 2032
- Figure 66: South America Oil and Gas Accumulator Market Volume Share (%), by Application 2024 & 2032
- Figure 67: South America Oil and Gas Accumulator Market Revenue (Million), by Location of Deployment 2024 & 2032
- Figure 68: South America Oil and Gas Accumulator Market Volume (K Units), by Location of Deployment 2024 & 2032
- Figure 69: South America Oil and Gas Accumulator Market Revenue Share (%), by Location of Deployment 2024 & 2032
- Figure 70: South America Oil and Gas Accumulator Market Volume Share (%), by Location of Deployment 2024 & 2032
- Figure 71: South America Oil and Gas Accumulator Market Revenue (Million), by Country 2024 & 2032
- Figure 72: South America Oil and Gas Accumulator Market Volume (K Units), by Country 2024 & 2032
- Figure 73: South America Oil and Gas Accumulator Market Revenue Share (%), by Country 2024 & 2032
- Figure 74: South America Oil and Gas Accumulator Market Volume Share (%), by Country 2024 & 2032
- Figure 75: Middle East and Africa Oil and Gas Accumulator Market Revenue (Million), by Application 2024 & 2032
- Figure 76: Middle East and Africa Oil and Gas Accumulator Market Volume (K Units), by Application 2024 & 2032
- Figure 77: Middle East and Africa Oil and Gas Accumulator Market Revenue Share (%), by Application 2024 & 2032
- Figure 78: Middle East and Africa Oil and Gas Accumulator Market Volume Share (%), by Application 2024 & 2032
- Figure 79: Middle East and Africa Oil and Gas Accumulator Market Revenue (Million), by Location of Deployment 2024 & 2032
- Figure 80: Middle East and Africa Oil and Gas Accumulator Market Volume (K Units), by Location of Deployment 2024 & 2032
- Figure 81: Middle East and Africa Oil and Gas Accumulator Market Revenue Share (%), by Location of Deployment 2024 & 2032
- Figure 82: Middle East and Africa Oil and Gas Accumulator Market Volume Share (%), by Location of Deployment 2024 & 2032
- Figure 83: Middle East and Africa Oil and Gas Accumulator Market Revenue (Million), by Country 2024 & 2032
- Figure 84: Middle East and Africa Oil and Gas Accumulator Market Volume (K Units), by Country 2024 & 2032
- Figure 85: Middle East and Africa Oil and Gas Accumulator Market Revenue Share (%), by Country 2024 & 2032
- Figure 86: Middle East and Africa Oil and Gas Accumulator Market Volume Share (%), by Country 2024 & 2032
List of Tables
- Table 1: Global Oil and Gas Accumulator Market Revenue Million Forecast, by Region 2019 & 2032
- Table 2: Global Oil and Gas Accumulator Market Volume K Units Forecast, by Region 2019 & 2032
- Table 3: Global Oil and Gas Accumulator Market Revenue Million Forecast, by Application 2019 & 2032
- Table 4: Global Oil and Gas Accumulator Market Volume K Units Forecast, by Application 2019 & 2032
- Table 5: Global Oil and Gas Accumulator Market Revenue Million Forecast, by Location of Deployment 2019 & 2032
- Table 6: Global Oil and Gas Accumulator Market Volume K Units Forecast, by Location of Deployment 2019 & 2032
- Table 7: Global Oil and Gas Accumulator Market Revenue Million Forecast, by Region 2019 & 2032
- Table 8: Global Oil and Gas Accumulator Market Volume K Units Forecast, by Region 2019 & 2032
- Table 9: Global Oil and Gas Accumulator Market Revenue Million Forecast, by Country 2019 & 2032
- Table 10: Global Oil and Gas Accumulator Market Volume K Units Forecast, by Country 2019 & 2032
- Table 11: United States Oil and Gas Accumulator Market Revenue (Million) Forecast, by Application 2019 & 2032
- Table 12: United States Oil and Gas Accumulator Market Volume (K Units) Forecast, by Application 2019 & 2032
- Table 13: Canada Oil and Gas Accumulator Market Revenue (Million) Forecast, by Application 2019 & 2032
- Table 14: Canada Oil and Gas Accumulator Market Volume (K Units) Forecast, by Application 2019 & 2032
- Table 15: Mexico Oil and Gas Accumulator Market Revenue (Million) Forecast, by Application 2019 & 2032
- Table 16: Mexico Oil and Gas Accumulator Market Volume (K Units) Forecast, by Application 2019 & 2032
- Table 17: Global Oil and Gas Accumulator Market Revenue Million Forecast, by Country 2019 & 2032
- Table 18: Global Oil and Gas Accumulator Market Volume K Units Forecast, by Country 2019 & 2032
- Table 19: Germany Oil and Gas Accumulator Market Revenue (Million) Forecast, by Application 2019 & 2032
- Table 20: Germany Oil and Gas Accumulator Market Volume (K Units) Forecast, by Application 2019 & 2032
- Table 21: United Kingdom Oil and Gas Accumulator Market Revenue (Million) Forecast, by Application 2019 & 2032
- Table 22: United Kingdom Oil and Gas Accumulator Market Volume (K Units) Forecast, by Application 2019 & 2032
- Table 23: France Oil and Gas Accumulator Market Revenue (Million) Forecast, by Application 2019 & 2032
- Table 24: France Oil and Gas Accumulator Market Volume (K Units) Forecast, by Application 2019 & 2032
- Table 25: Spain Oil and Gas Accumulator Market Revenue (Million) Forecast, by Application 2019 & 2032
- Table 26: Spain Oil and Gas Accumulator Market Volume (K Units) Forecast, by Application 2019 & 2032
- Table 27: Italy Oil and Gas Accumulator Market Revenue (Million) Forecast, by Application 2019 & 2032
- Table 28: Italy Oil and Gas Accumulator Market Volume (K Units) Forecast, by Application 2019 & 2032
- Table 29: Spain Oil and Gas Accumulator Market Revenue (Million) Forecast, by Application 2019 & 2032
- Table 30: Spain Oil and Gas Accumulator Market Volume (K Units) Forecast, by Application 2019 & 2032
- Table 31: Belgium Oil and Gas Accumulator Market Revenue (Million) Forecast, by Application 2019 & 2032
- Table 32: Belgium Oil and Gas Accumulator Market Volume (K Units) Forecast, by Application 2019 & 2032
- Table 33: Netherland Oil and Gas Accumulator Market Revenue (Million) Forecast, by Application 2019 & 2032
- Table 34: Netherland Oil and Gas Accumulator Market Volume (K Units) Forecast, by Application 2019 & 2032
- Table 35: Nordics Oil and Gas Accumulator Market Revenue (Million) Forecast, by Application 2019 & 2032
- Table 36: Nordics Oil and Gas Accumulator Market Volume (K Units) Forecast, by Application 2019 & 2032
- Table 37: Rest of Europe Oil and Gas Accumulator Market Revenue (Million) Forecast, by Application 2019 & 2032
- Table 38: Rest of Europe Oil and Gas Accumulator Market Volume (K Units) Forecast, by Application 2019 & 2032
- Table 39: Global Oil and Gas Accumulator Market Revenue Million Forecast, by Country 2019 & 2032
- Table 40: Global Oil and Gas Accumulator Market Volume K Units Forecast, by Country 2019 & 2032
- Table 41: China Oil and Gas Accumulator Market Revenue (Million) Forecast, by Application 2019 & 2032
- Table 42: China Oil and Gas Accumulator Market Volume (K Units) Forecast, by Application 2019 & 2032
- Table 43: Japan Oil and Gas Accumulator Market Revenue (Million) Forecast, by Application 2019 & 2032
- Table 44: Japan Oil and Gas Accumulator Market Volume (K Units) Forecast, by Application 2019 & 2032
- Table 45: India Oil and Gas Accumulator Market Revenue (Million) Forecast, by Application 2019 & 2032
- Table 46: India Oil and Gas Accumulator Market Volume (K Units) Forecast, by Application 2019 & 2032
- Table 47: South Korea Oil and Gas Accumulator Market Revenue (Million) Forecast, by Application 2019 & 2032
- Table 48: South Korea Oil and Gas Accumulator Market Volume (K Units) Forecast, by Application 2019 & 2032
- Table 49: Southeast Asia Oil and Gas Accumulator Market Revenue (Million) Forecast, by Application 2019 & 2032
- Table 50: Southeast Asia Oil and Gas Accumulator Market Volume (K Units) Forecast, by Application 2019 & 2032
- Table 51: Australia Oil and Gas Accumulator Market Revenue (Million) Forecast, by Application 2019 & 2032
- Table 52: Australia Oil and Gas Accumulator Market Volume (K Units) Forecast, by Application 2019 & 2032
- Table 53: Indonesia Oil and Gas Accumulator Market Revenue (Million) Forecast, by Application 2019 & 2032
- Table 54: Indonesia Oil and Gas Accumulator Market Volume (K Units) Forecast, by Application 2019 & 2032
- Table 55: Phillipes Oil and Gas Accumulator Market Revenue (Million) Forecast, by Application 2019 & 2032
- Table 56: Phillipes Oil and Gas Accumulator Market Volume (K Units) Forecast, by Application 2019 & 2032
- Table 57: Singapore Oil and Gas Accumulator Market Revenue (Million) Forecast, by Application 2019 & 2032
- Table 58: Singapore Oil and Gas Accumulator Market Volume (K Units) Forecast, by Application 2019 & 2032
- Table 59: Thailandc Oil and Gas Accumulator Market Revenue (Million) Forecast, by Application 2019 & 2032
- Table 60: Thailandc Oil and Gas Accumulator Market Volume (K Units) Forecast, by Application 2019 & 2032
- Table 61: Rest of Asia Pacific Oil and Gas Accumulator Market Revenue (Million) Forecast, by Application 2019 & 2032
- Table 62: Rest of Asia Pacific Oil and Gas Accumulator Market Volume (K Units) Forecast, by Application 2019 & 2032
- Table 63: Global Oil and Gas Accumulator Market Revenue Million Forecast, by Country 2019 & 2032
- Table 64: Global Oil and Gas Accumulator Market Volume K Units Forecast, by Country 2019 & 2032
- Table 65: Brazil Oil and Gas Accumulator Market Revenue (Million) Forecast, by Application 2019 & 2032
- Table 66: Brazil Oil and Gas Accumulator Market Volume (K Units) Forecast, by Application 2019 & 2032
- Table 67: Argentina Oil and Gas Accumulator Market Revenue (Million) Forecast, by Application 2019 & 2032
- Table 68: Argentina Oil and Gas Accumulator Market Volume (K Units) Forecast, by Application 2019 & 2032
- Table 69: Peru Oil and Gas Accumulator Market Revenue (Million) Forecast, by Application 2019 & 2032
- Table 70: Peru Oil and Gas Accumulator Market Volume (K Units) Forecast, by Application 2019 & 2032
- Table 71: Chile Oil and Gas Accumulator Market Revenue (Million) Forecast, by Application 2019 & 2032
- Table 72: Chile Oil and Gas Accumulator Market Volume (K Units) Forecast, by Application 2019 & 2032
- Table 73: Colombia Oil and Gas Accumulator Market Revenue (Million) Forecast, by Application 2019 & 2032
- Table 74: Colombia Oil and Gas Accumulator Market Volume (K Units) Forecast, by Application 2019 & 2032
- Table 75: Ecuador Oil and Gas Accumulator Market Revenue (Million) Forecast, by Application 2019 & 2032
- Table 76: Ecuador Oil and Gas Accumulator Market Volume (K Units) Forecast, by Application 2019 & 2032
- Table 77: Venezuela Oil and Gas Accumulator Market Revenue (Million) Forecast, by Application 2019 & 2032
- Table 78: Venezuela Oil and Gas Accumulator Market Volume (K Units) Forecast, by Application 2019 & 2032
- Table 79: Rest of South America Oil and Gas Accumulator Market Revenue (Million) Forecast, by Application 2019 & 2032
- Table 80: Rest of South America Oil and Gas Accumulator Market Volume (K Units) Forecast, by Application 2019 & 2032
- Table 81: Global Oil and Gas Accumulator Market Revenue Million Forecast, by Country 2019 & 2032
- Table 82: Global Oil and Gas Accumulator Market Volume K Units Forecast, by Country 2019 & 2032
- Table 83: United States Oil and Gas Accumulator Market Revenue (Million) Forecast, by Application 2019 & 2032
- Table 84: United States Oil and Gas Accumulator Market Volume (K Units) Forecast, by Application 2019 & 2032
- Table 85: Canada Oil and Gas Accumulator Market Revenue (Million) Forecast, by Application 2019 & 2032
- Table 86: Canada Oil and Gas Accumulator Market Volume (K Units) Forecast, by Application 2019 & 2032
- Table 87: Mexico Oil and Gas Accumulator Market Revenue (Million) Forecast, by Application 2019 & 2032
- Table 88: Mexico Oil and Gas Accumulator Market Volume (K Units) Forecast, by Application 2019 & 2032
- Table 89: Global Oil and Gas Accumulator Market Revenue Million Forecast, by Country 2019 & 2032
- Table 90: Global Oil and Gas Accumulator Market Volume K Units Forecast, by Country 2019 & 2032
- Table 91: United Arab Emirates Oil and Gas Accumulator Market Revenue (Million) Forecast, by Application 2019 & 2032
- Table 92: United Arab Emirates Oil and Gas Accumulator Market Volume (K Units) Forecast, by Application 2019 & 2032
- Table 93: Saudi Arabia Oil and Gas Accumulator Market Revenue (Million) Forecast, by Application 2019 & 2032
- Table 94: Saudi Arabia Oil and Gas Accumulator Market Volume (K Units) Forecast, by Application 2019 & 2032
- Table 95: South Africa Oil and Gas Accumulator Market Revenue (Million) Forecast, by Application 2019 & 2032
- Table 96: South Africa Oil and Gas Accumulator Market Volume (K Units) Forecast, by Application 2019 & 2032
- Table 97: Rest of Middle East and Africa Oil and Gas Accumulator Market Revenue (Million) Forecast, by Application 2019 & 2032
- Table 98: Rest of Middle East and Africa Oil and Gas Accumulator Market Volume (K Units) Forecast, by Application 2019 & 2032
- Table 99: Global Oil and Gas Accumulator Market Revenue Million Forecast, by Application 2019 & 2032
- Table 100: Global Oil and Gas Accumulator Market Volume K Units Forecast, by Application 2019 & 2032
- Table 101: Global Oil and Gas Accumulator Market Revenue Million Forecast, by Location of Deployment 2019 & 2032
- Table 102: Global Oil and Gas Accumulator Market Volume K Units Forecast, by Location of Deployment 2019 & 2032
- Table 103: Global Oil and Gas Accumulator Market Revenue Million Forecast, by Country 2019 & 2032
- Table 104: Global Oil and Gas Accumulator Market Volume K Units Forecast, by Country 2019 & 2032
- Table 105: Global Oil and Gas Accumulator Market Revenue Million Forecast, by Application 2019 & 2032
- Table 106: Global Oil and Gas Accumulator Market Volume K Units Forecast, by Application 2019 & 2032
- Table 107: Global Oil and Gas Accumulator Market Revenue Million Forecast, by Location of Deployment 2019 & 2032
- Table 108: Global Oil and Gas Accumulator Market Volume K Units Forecast, by Location of Deployment 2019 & 2032
- Table 109: Global Oil and Gas Accumulator Market Revenue Million Forecast, by Country 2019 & 2032
- Table 110: Global Oil and Gas Accumulator Market Volume K Units Forecast, by Country 2019 & 2032
- Table 111: Global Oil and Gas Accumulator Market Revenue Million Forecast, by Application 2019 & 2032
- Table 112: Global Oil and Gas Accumulator Market Volume K Units Forecast, by Application 2019 & 2032
- Table 113: Global Oil and Gas Accumulator Market Revenue Million Forecast, by Location of Deployment 2019 & 2032
- Table 114: Global Oil and Gas Accumulator Market Volume K Units Forecast, by Location of Deployment 2019 & 2032
- Table 115: Global Oil and Gas Accumulator Market Revenue Million Forecast, by Country 2019 & 2032
- Table 116: Global Oil and Gas Accumulator Market Volume K Units Forecast, by Country 2019 & 2032
- Table 117: Global Oil and Gas Accumulator Market Revenue Million Forecast, by Application 2019 & 2032
- Table 118: Global Oil and Gas Accumulator Market Volume K Units Forecast, by Application 2019 & 2032
- Table 119: Global Oil and Gas Accumulator Market Revenue Million Forecast, by Location of Deployment 2019 & 2032
- Table 120: Global Oil and Gas Accumulator Market Volume K Units Forecast, by Location of Deployment 2019 & 2032
- Table 121: Global Oil and Gas Accumulator Market Revenue Million Forecast, by Country 2019 & 2032
- Table 122: Global Oil and Gas Accumulator Market Volume K Units Forecast, by Country 2019 & 2032
- Table 123: Global Oil and Gas Accumulator Market Revenue Million Forecast, by Application 2019 & 2032
- Table 124: Global Oil and Gas Accumulator Market Volume K Units Forecast, by Application 2019 & 2032
- Table 125: Global Oil and Gas Accumulator Market Revenue Million Forecast, by Location of Deployment 2019 & 2032
- Table 126: Global Oil and Gas Accumulator Market Volume K Units Forecast, by Location of Deployment 2019 & 2032
- Table 127: Global Oil and Gas Accumulator Market Revenue Million Forecast, by Country 2019 & 2032
- Table 128: Global Oil and Gas Accumulator Market Volume K Units Forecast, by Country 2019 & 2032
Frequently Asked Questions
1. What is the projected Compound Annual Growth Rate (CAGR) of the Oil and Gas Accumulator Market?
The projected CAGR is approximately 5.60%.
2. Which companies are prominent players in the Oil and Gas Accumulator Market?
Key companies in the market include Parker-Hannifin Corp, Rotec Hydraulics Ltd, Eaton Corporation PLC, Roth Industries LLC, Technetics Group*List Not Exhaustive, Hydac, Freudenberg Group, Etola Group (Hydroll), Nippon Accumulator Co Ltd, Paccar.
3. What are the main segments of the Oil and Gas Accumulator Market?
The market segments include Application, Location of Deployment.
4. Can you provide details about the market size?
The market size is estimated to be USD 556.22 Million as of 2022.
5. What are some drivers contributing to market growth?
4.; Growing Energy Demand4.; Renewable Energy Transition.
6. What are the notable trends driving market growth?
Onshore Segment Expected to Dominate the Market.
7. Are there any restraints impacting market growth?
4.; Phasing out of Conventional Sources of Electricity.
8. Can you provide examples of recent developments in the market?
Introduction of hybrid accumulators
9. What pricing options are available for accessing the report?
Pricing options include single-user, multi-user, and enterprise licenses priced at USD 4750, USD 5250, and USD 8750 respectively.
10. Is the market size provided in terms of value or volume?
The market size is provided in terms of value, measured in Million and volume, measured in K Units.
11. Are there any specific market keywords associated with the report?
Yes, the market keyword associated with the report is "Oil and Gas Accumulator Market," which aids in identifying and referencing the specific market segment covered.
12. How do I determine which pricing option suits my needs best?
The pricing options vary based on user requirements and access needs. Individual users may opt for single-user licenses, while businesses requiring broader access may choose multi-user or enterprise licenses for cost-effective access to the report.
13. Are there any additional resources or data provided in the Oil and Gas Accumulator Market report?
While the report offers comprehensive insights, it's advisable to review the specific contents or supplementary materials provided to ascertain if additional resources or data are available.
14. How can I stay updated on further developments or reports in the Oil and Gas Accumulator Market?
To stay informed about further developments, trends, and reports in the Oil and Gas Accumulator Market, consider subscribing to industry newsletters, following relevant companies and organizations, or regularly checking reputable industry news sources and publications.
Methodology
Step 1 - Identification of Relevant Samples Size from Population Database


Step 2 - Approaches for Defining Global Market Size (Value, Volume* & Price*)

Note*: In applicable scenarios
Step 3 - Data Sources
Primary Research
- Web Analytics
- Survey Reports
- Research Institute
- Latest Research Reports
- Opinion Leaders
Secondary Research
- Annual Reports
- White Paper
- Latest Press Release
- Industry Association
- Paid Database
- Investor Presentations

Step 4 - Data Triangulation
Involves using different sources of information in order to increase the validity of a study
These sources are likely to be stakeholders in a program - participants, other researchers, program staff, other community members, and so on.
Then we put all data in single framework & apply various statistical tools to find out the dynamic on the market.
During the analysis stage, feedback from the stakeholder groups would be compared to determine areas of agreement as well as areas of divergence


