
Key Insights
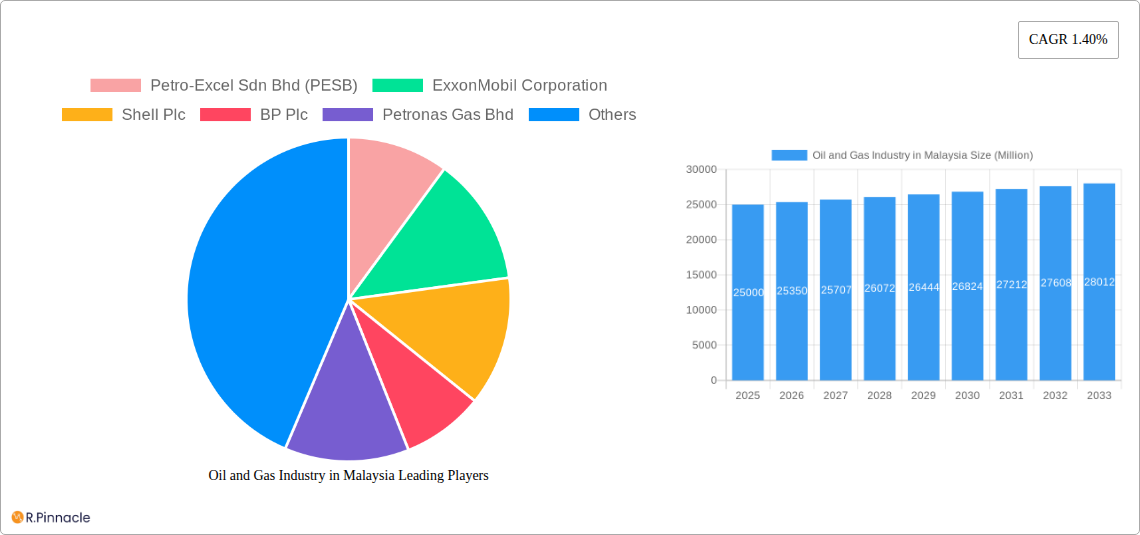
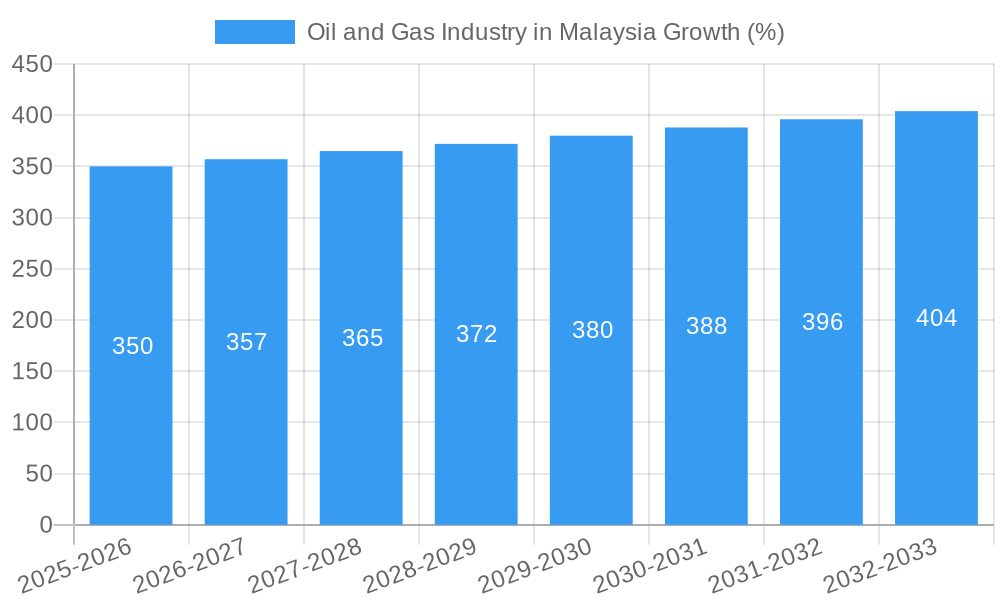
The Malaysian oil and gas industry, while facing headwinds, presents a complex and dynamic market landscape. With a CAGR of 1.40% from 2019-2033, the industry's growth is projected to be moderate, driven primarily by increasing energy demands from the burgeoning industrial and power generation sectors within the country and the Asia-Pacific region. Upstream activities, encompassing exploration and production, remain crucial, however, the industry is actively focusing on midstream and downstream operations to enhance value addition and reduce reliance on solely resource extraction. The substantial investments in infrastructure improvements for transportation and storage are further supported by government initiatives aiming to optimize energy efficiency and transition towards cleaner energy sources. This creates both opportunities and challenges for players; while demand remains strong, the pressure to adopt sustainable practices and diversify energy sources is undeniable. Companies like Petronas, ExxonMobil, and Shell play major roles, influencing market trends through their operations and investments, though smaller domestic players also contribute significantly to regional supply chains. Competition is fierce and characterized by both large multinational corporations and smaller, more agile companies vying for market share. The geographic concentration of activities, primarily around key regions of Malaysia, presents a concentrated but potentially vulnerable market.
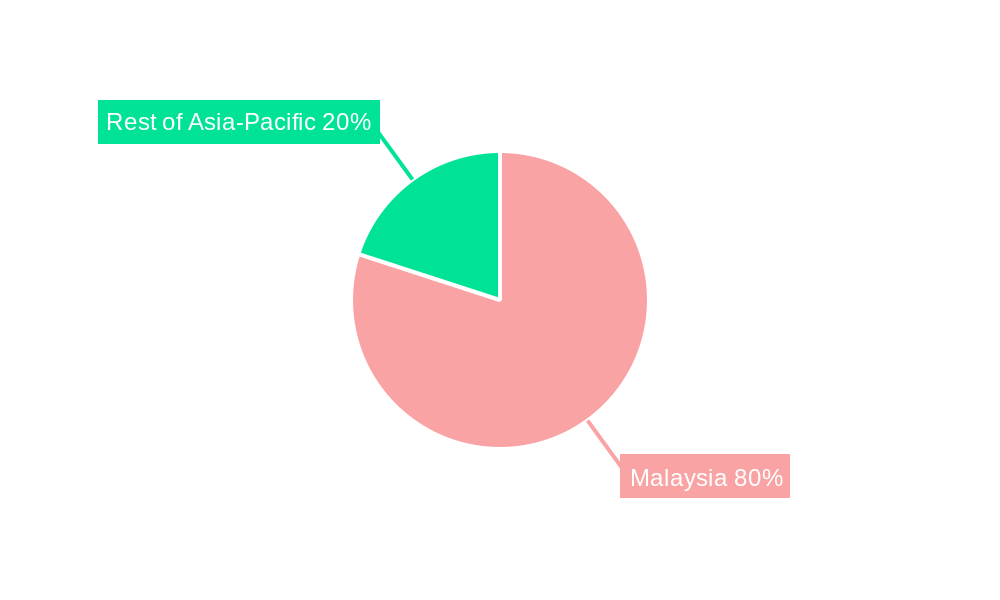
The segmentation by product (upstream, midstream, downstream) and application (power generation, transportation, industrial, residential) reveals strategic opportunities for growth. While upstream activities might show slightly slower growth due to mature fields and exploration challenges, the midstream and downstream sectors offer more diverse growth avenues, spurred by expanding industrialization and the need for efficient energy distribution networks. The Asia-Pacific region, particularly China and India, presents significant export opportunities for Malaysian oil and gas producers, although global market fluctuations and geopolitical events represent ongoing risks. Government regulations and policies focusing on environmental sustainability and energy security will significantly shape the future of the industry, incentivizing investment in renewable energy sources and creating a more complex regulatory landscape for traditional fossil fuel extraction and refining.
Oil and Gas Industry in Malaysia: A Comprehensive Market Report (2019-2033)
This in-depth report provides a comprehensive analysis of the Malaysian oil and gas industry, offering valuable insights for industry professionals, investors, and policymakers. With a study period spanning 2019-2033, a base year of 2025, and a forecast period of 2025-2033, this report leverages historical data (2019-2024) to predict future trends and opportunities within this dynamic sector. The report covers key segments, dominant players, and emerging trends, providing actionable intelligence for strategic decision-making.
Oil and Gas Industry in Malaysia Market Structure & Innovation Trends
This section analyzes the Malaysian oil and gas market's structure, focusing on market concentration, innovation drivers, regulatory frameworks, and competitive dynamics. We examine the influence of product substitutes, end-user demographics, and mergers and acquisitions (M&A) activities.
The Malaysian oil and gas industry exhibits a mixed structure, with both large multinational corporations and smaller local players. Petronas, a state-owned company, holds a significant market share, particularly in upstream activities. However, other international giants like ExxonMobil Corporation, Shell Plc, and BP Plc maintain a substantial presence. Smaller players like Petro-Excel Sdn Bhd (PESB), Altus Oil & Gas Malaysia Sdn Bhd, and Petro Teguh (M) Sdn Bhd contribute to the overall market dynamism.
- Market Concentration: Petronas dominates the upstream sector, holding approximately xx% market share. The downstream sector is more fragmented.
- Innovation Drivers: Government policies promoting renewable energy and carbon reduction are driving innovation towards cleaner energy sources and technologies.
- Regulatory Framework: The Malaysian government's regulatory framework influences exploration, production, and environmental protection. Recent amendments impact investment and operational strategies.
- M&A Activity: The value of M&A deals in the Malaysian oil and gas sector reached approximately RM xx Million in 2024, with a projected increase to RM xx Million by 2033. This reflects consolidation and strategic restructuring within the industry.
Oil and Gas Industry in Malaysia Market Dynamics & Trends
This section delves into the market's dynamic forces, including growth drivers, technological disruptions, consumer preferences, and competitive dynamics. We analyze the impact of these forces on market growth and penetration.
The Malaysian oil and gas market is influenced by fluctuating global oil prices, economic growth, and evolving energy demand. Growth in key sectors like transportation and power generation fuels demand, while increasing environmental awareness drives the adoption of cleaner technologies. The industry is witnessing a significant shift towards renewable energy sources, posing both challenges and opportunities. Technological advancements, such as enhanced oil recovery techniques and automation, are improving efficiency and productivity. Competitive dynamics are shaped by the interplay between national and international players, each vying for market share through strategic partnerships and investments. The CAGR for the Malaysian oil and gas market is projected at xx% from 2025 to 2033, driven by increasing domestic demand and regional exports. Market penetration of LNG in power generation is expected to reach xx% by 2033.
Dominant Regions & Segments in Oil and Gas Industry in Malaysia
This section identifies the leading regions and segments within the Malaysian oil and gas industry, analyzing their dominance based on various factors.
- Dominant Region: Sarawak and Sabah states, rich in oil and gas resources, lead the upstream sector. This dominance stems from extensive reserves and established infrastructure.
- Dominant Segments: The upstream sector (exploration and production) currently holds the largest market share, due to Malaysia's substantial hydrocarbon reserves. However, the downstream sector (refining and marketing) is projected to experience higher growth due to increasing domestic consumption.
- Key Drivers:
- Upstream: Government incentives, favorable exploration policies, and abundant reserves.
- Midstream: Expansion of pipeline infrastructure and strategic investment in transportation and storage facilities.
- Downstream: Growing domestic demand, particularly in the transportation and industrial sectors, coupled with regional export opportunities.
Oil and Gas Industry in Malaysia Product Innovations
This section provides a concise overview of product innovations, applications, and their competitive advantages.
The Malaysian oil and gas sector is witnessing significant innovation in areas such as enhanced oil recovery, LNG processing and transportation, and the development of cleaner energy technologies. These innovations aim to improve efficiency, reduce environmental impact, and enhance the competitiveness of Malaysian oil and gas companies in a global market. The focus is increasingly on incorporating advanced analytics and digital technologies to optimize operations and enhance decision-making.
Report Scope & Segmentation Analysis
This section details the market segmentation, providing insights into each segment's growth projections, market sizes, and competitive dynamics.
Product: Upstream (exploration and production), Midstream (transportation and storage), Downstream (refining and marketing) Application: Power generation, Transportation, Industrial, Residential
Each segment experiences unique growth rates. Upstream is largely influenced by reserve discoveries and global oil prices, midstream by infrastructure development, and downstream by domestic demand. Competitive dynamics vary by segment; upstream is more consolidated, while downstream is more fragmented.
Key Drivers of Oil and Gas Industry in Malaysia Growth
This section outlines the key factors driving the growth of the Malaysian oil and gas industry.
Technological advancements in exploration and production, growing domestic energy demand, particularly in the transportation and power generation sectors, and government support for infrastructure development are major drivers. The expansion of LNG infrastructure and increasing regional demand for Malaysian LNG also contribute to industry growth.
Challenges in the Oil and Gas Industry in Malaysia Sector
This section highlights the challenges faced by the Malaysian oil and gas sector.
The industry faces challenges from fluctuating global oil prices, environmental concerns, increasing competition, and the need for continuous technological innovation to maintain competitiveness. Regulatory changes and the transition towards renewable energy sources present additional hurdles. The sector also faces pressure to improve safety standards and address environmental impact. These factors can lead to significant financial losses if not managed effectively.
Emerging Opportunities in Oil and Gas Industry in Malaysia
This section identifies potential opportunities for the future.
Emerging opportunities include the expansion of LNG exports, investment in renewable energy sources, and the development of new technologies to enhance efficiency and sustainability. The increasing use of digital technologies to optimize operations presents another opportunity for growth and profitability. Exploration for new oil and gas reserves, particularly in under-explored areas, offers significant potential.
Leading Players in the Oil and Gas Industry in Malaysia Market
- Petro-Excel Sdn Bhd (PESB)
- ExxonMobil Corporation
- Shell Plc
- BP Plc
- Petronas Gas Bhd
- Chevron Corporation
- Altus Oil & Gas Malaysia Sdn Bhd
- Malaysiaian General Petroleum Corporation
- Malaysiaian Natural Gas Holding Company
- Petro Teguh (M) Sdn Bhd
Key Developments in Oil and Gas Industry in Malaysia Industry
- December 2022: Petronas announced the oil and gas discovery at the Nahara well in Block SK 306, boosting domestic reserves and production potential.
- January 2023: A consortium secured an EPCC contract with Petronas for Malaysia's first nearshore floating LNG facility, signifying significant investment in LNG infrastructure and showcasing the nation's commitment to technological advancement in the energy sector. This project is expected to significantly boost LNG production and export capabilities by 2027.
Future Outlook for Oil and Gas Industry in Malaysia Market
The Malaysian oil and gas industry's future hinges on strategic investments in technology, infrastructure development, and adaptation to evolving energy demands. While facing challenges from global market volatility and the energy transition, the sector holds significant potential for growth through strategic partnerships, exploration of new reserves, and diversification into cleaner energy sources. The focus on LNG and the increasing demand for energy domestically and regionally suggest a positive outlook, albeit one requiring careful navigation of industry changes.
Oil and Gas Industry in Malaysia Segmentation
- 1. Upstream
- 2. Midstream
- 3. Downstream
Oil and Gas Industry in Malaysia Segmentation By Geography
-
1. North America
- 1.1. United States
- 1.2. Canada
- 1.3. Mexico
-
2. South America
- 2.1. Brazil
- 2.2. Argentina
- 2.3. Rest of South America
-
3. Europe
- 3.1. United Kingdom
- 3.2. Germany
- 3.3. France
- 3.4. Italy
- 3.5. Spain
- 3.6. Russia
- 3.7. Benelux
- 3.8. Nordics
- 3.9. Rest of Europe
-
4. Middle East & Africa
- 4.1. Turkey
- 4.2. Israel
- 4.3. GCC
- 4.4. North Africa
- 4.5. South Africa
- 4.6. Rest of Middle East & Africa
-
5. Asia Pacific
- 5.1. China
- 5.2. India
- 5.3. Japan
- 5.4. South Korea
- 5.5. ASEAN
- 5.6. Oceania
- 5.7. Rest of Asia Pacific
Oil and Gas Industry in Malaysia REPORT HIGHLIGHTS
| Aspects | Details |
|---|---|
| Study Period | 2019-2033 |
| Base Year | 2024 |
| Estimated Year | 2025 |
| Forecast Period | 2025-2033 |
| Historical Period | 2019-2024 |
| Growth Rate | CAGR of 1.40% from 2019-2033 |
| Segmentation |
|
Table of Contents
- 1. Introduction
- 1.1. Research Scope
- 1.2. Market Segmentation
- 1.3. Research Methodology
- 1.4. Definitions and Assumptions
- 2. Executive Summary
- 2.1. Introduction
- 3. Market Dynamics
- 3.1. Introduction
- 3.2. Market Drivers
- 3.2.1. 4.; Surging Demand For Refined Petroleum Products4.; Significant Untapped Petroleum Reserves in the Sedimentary Basins
- 3.3. Market Restrains
- 3.3.1. 4.; High Volatility of Crude Oil Prices
- 3.4. Market Trends
- 3.4.1. Midstream Sector is Expected to Have Significant Market Share
- 4. Market Factor Analysis
- 4.1. Porters Five Forces
- 4.2. Supply/Value Chain
- 4.3. PESTEL analysis
- 4.4. Market Entropy
- 4.5. Patent/Trademark Analysis
- 5. Global Oil and Gas Industry in Malaysia Analysis, Insights and Forecast, 2019-2031
- 5.1. Market Analysis, Insights and Forecast - by Upstream
- 5.2. Market Analysis, Insights and Forecast - by Midstream
- 5.3. Market Analysis, Insights and Forecast - by Downstream
- 5.4. Market Analysis, Insights and Forecast - by Region
- 5.4.1. North America
- 5.4.2. South America
- 5.4.3. Europe
- 5.4.4. Middle East & Africa
- 5.4.5. Asia Pacific
- 5.1. Market Analysis, Insights and Forecast - by Upstream
- 6. North America Oil and Gas Industry in Malaysia Analysis, Insights and Forecast, 2019-2031
- 6.1. Market Analysis, Insights and Forecast - by Upstream
- 6.2. Market Analysis, Insights and Forecast - by Midstream
- 6.3. Market Analysis, Insights and Forecast - by Downstream
- 6.1. Market Analysis, Insights and Forecast - by Upstream
- 7. South America Oil and Gas Industry in Malaysia Analysis, Insights and Forecast, 2019-2031
- 7.1. Market Analysis, Insights and Forecast - by Upstream
- 7.2. Market Analysis, Insights and Forecast - by Midstream
- 7.3. Market Analysis, Insights and Forecast - by Downstream
- 7.1. Market Analysis, Insights and Forecast - by Upstream
- 8. Europe Oil and Gas Industry in Malaysia Analysis, Insights and Forecast, 2019-2031
- 8.1. Market Analysis, Insights and Forecast - by Upstream
- 8.2. Market Analysis, Insights and Forecast - by Midstream
- 8.3. Market Analysis, Insights and Forecast - by Downstream
- 8.1. Market Analysis, Insights and Forecast - by Upstream
- 9. Middle East & Africa Oil and Gas Industry in Malaysia Analysis, Insights and Forecast, 2019-2031
- 9.1. Market Analysis, Insights and Forecast - by Upstream
- 9.2. Market Analysis, Insights and Forecast - by Midstream
- 9.3. Market Analysis, Insights and Forecast - by Downstream
- 9.1. Market Analysis, Insights and Forecast - by Upstream
- 10. Asia Pacific Oil and Gas Industry in Malaysia Analysis, Insights and Forecast, 2019-2031
- 10.1. Market Analysis, Insights and Forecast - by Upstream
- 10.2. Market Analysis, Insights and Forecast - by Midstream
- 10.3. Market Analysis, Insights and Forecast - by Downstream
- 10.1. Market Analysis, Insights and Forecast - by Upstream
- 11. China Oil and Gas Industry in Malaysia Analysis, Insights and Forecast, 2019-2031
- 12. Japan Oil and Gas Industry in Malaysia Analysis, Insights and Forecast, 2019-2031
- 13. India Oil and Gas Industry in Malaysia Analysis, Insights and Forecast, 2019-2031
- 14. South Korea Oil and Gas Industry in Malaysia Analysis, Insights and Forecast, 2019-2031
- 15. Taiwan Oil and Gas Industry in Malaysia Analysis, Insights and Forecast, 2019-2031
- 16. Australia Oil and Gas Industry in Malaysia Analysis, Insights and Forecast, 2019-2031
- 17. Rest of Asia-Pacific Oil and Gas Industry in Malaysia Analysis, Insights and Forecast, 2019-2031
- 18. Competitive Analysis
- 18.1. Global Market Share Analysis 2024
- 18.2. Company Profiles
- 18.2.1 Petro-Excel Sdn Bhd (PESB)
- 18.2.1.1. Overview
- 18.2.1.2. Products
- 18.2.1.3. SWOT Analysis
- 18.2.1.4. Recent Developments
- 18.2.1.5. Financials (Based on Availability)
- 18.2.2 ExxonMobil Corporation
- 18.2.2.1. Overview
- 18.2.2.2. Products
- 18.2.2.3. SWOT Analysis
- 18.2.2.4. Recent Developments
- 18.2.2.5. Financials (Based on Availability)
- 18.2.3 Shell Plc
- 18.2.3.1. Overview
- 18.2.3.2. Products
- 18.2.3.3. SWOT Analysis
- 18.2.3.4. Recent Developments
- 18.2.3.5. Financials (Based on Availability)
- 18.2.4 BP Plc
- 18.2.4.1. Overview
- 18.2.4.2. Products
- 18.2.4.3. SWOT Analysis
- 18.2.4.4. Recent Developments
- 18.2.4.5. Financials (Based on Availability)
- 18.2.5 Petronas Gas Bhd
- 18.2.5.1. Overview
- 18.2.5.2. Products
- 18.2.5.3. SWOT Analysis
- 18.2.5.4. Recent Developments
- 18.2.5.5. Financials (Based on Availability)
- 18.2.6 Chevron Corporation
- 18.2.6.1. Overview
- 18.2.6.2. Products
- 18.2.6.3. SWOT Analysis
- 18.2.6.4. Recent Developments
- 18.2.6.5. Financials (Based on Availability)
- 18.2.7 Altus Oil & Gas Malaysia Sdn Bhd
- 18.2.7.1. Overview
- 18.2.7.2. Products
- 18.2.7.3. SWOT Analysis
- 18.2.7.4. Recent Developments
- 18.2.7.5. Financials (Based on Availability)
- 18.2.8 Malaysiaian General Petroleum Corporation
- 18.2.8.1. Overview
- 18.2.8.2. Products
- 18.2.8.3. SWOT Analysis
- 18.2.8.4. Recent Developments
- 18.2.8.5. Financials (Based on Availability)
- 18.2.9 Malaysiaian Natural Gas Holding Company*List Not Exhaustive
- 18.2.9.1. Overview
- 18.2.9.2. Products
- 18.2.9.3. SWOT Analysis
- 18.2.9.4. Recent Developments
- 18.2.9.5. Financials (Based on Availability)
- 18.2.10 Petro Teguh (M) Sdn Bhd
- 18.2.10.1. Overview
- 18.2.10.2. Products
- 18.2.10.3. SWOT Analysis
- 18.2.10.4. Recent Developments
- 18.2.10.5. Financials (Based on Availability)
- 18.2.1 Petro-Excel Sdn Bhd (PESB)
List of Figures
- Figure 1: Global Oil and Gas Industry in Malaysia Revenue Breakdown (Million, %) by Region 2024 & 2032
- Figure 2: Global Oil and Gas Industry in Malaysia Volume Breakdown (Thousand, %) by Region 2024 & 2032
- Figure 3: Asia Pacific Oil and Gas Industry in Malaysia Revenue (Million), by Country 2024 & 2032
- Figure 4: Asia Pacific Oil and Gas Industry in Malaysia Volume (Thousand), by Country 2024 & 2032
- Figure 5: Asia Pacific Oil and Gas Industry in Malaysia Revenue Share (%), by Country 2024 & 2032
- Figure 6: Asia Pacific Oil and Gas Industry in Malaysia Volume Share (%), by Country 2024 & 2032
- Figure 7: North America Oil and Gas Industry in Malaysia Revenue (Million), by Upstream 2024 & 2032
- Figure 8: North America Oil and Gas Industry in Malaysia Volume (Thousand), by Upstream 2024 & 2032
- Figure 9: North America Oil and Gas Industry in Malaysia Revenue Share (%), by Upstream 2024 & 2032
- Figure 10: North America Oil and Gas Industry in Malaysia Volume Share (%), by Upstream 2024 & 2032
- Figure 11: North America Oil and Gas Industry in Malaysia Revenue (Million), by Midstream 2024 & 2032
- Figure 12: North America Oil and Gas Industry in Malaysia Volume (Thousand), by Midstream 2024 & 2032
- Figure 13: North America Oil and Gas Industry in Malaysia Revenue Share (%), by Midstream 2024 & 2032
- Figure 14: North America Oil and Gas Industry in Malaysia Volume Share (%), by Midstream 2024 & 2032
- Figure 15: North America Oil and Gas Industry in Malaysia Revenue (Million), by Downstream 2024 & 2032
- Figure 16: North America Oil and Gas Industry in Malaysia Volume (Thousand), by Downstream 2024 & 2032
- Figure 17: North America Oil and Gas Industry in Malaysia Revenue Share (%), by Downstream 2024 & 2032
- Figure 18: North America Oil and Gas Industry in Malaysia Volume Share (%), by Downstream 2024 & 2032
- Figure 19: North America Oil and Gas Industry in Malaysia Revenue (Million), by Country 2024 & 2032
- Figure 20: North America Oil and Gas Industry in Malaysia Volume (Thousand), by Country 2024 & 2032
- Figure 21: North America Oil and Gas Industry in Malaysia Revenue Share (%), by Country 2024 & 2032
- Figure 22: North America Oil and Gas Industry in Malaysia Volume Share (%), by Country 2024 & 2032
- Figure 23: South America Oil and Gas Industry in Malaysia Revenue (Million), by Upstream 2024 & 2032
- Figure 24: South America Oil and Gas Industry in Malaysia Volume (Thousand), by Upstream 2024 & 2032
- Figure 25: South America Oil and Gas Industry in Malaysia Revenue Share (%), by Upstream 2024 & 2032
- Figure 26: South America Oil and Gas Industry in Malaysia Volume Share (%), by Upstream 2024 & 2032
- Figure 27: South America Oil and Gas Industry in Malaysia Revenue (Million), by Midstream 2024 & 2032
- Figure 28: South America Oil and Gas Industry in Malaysia Volume (Thousand), by Midstream 2024 & 2032
- Figure 29: South America Oil and Gas Industry in Malaysia Revenue Share (%), by Midstream 2024 & 2032
- Figure 30: South America Oil and Gas Industry in Malaysia Volume Share (%), by Midstream 2024 & 2032
- Figure 31: South America Oil and Gas Industry in Malaysia Revenue (Million), by Downstream 2024 & 2032
- Figure 32: South America Oil and Gas Industry in Malaysia Volume (Thousand), by Downstream 2024 & 2032
- Figure 33: South America Oil and Gas Industry in Malaysia Revenue Share (%), by Downstream 2024 & 2032
- Figure 34: South America Oil and Gas Industry in Malaysia Volume Share (%), by Downstream 2024 & 2032
- Figure 35: South America Oil and Gas Industry in Malaysia Revenue (Million), by Country 2024 & 2032
- Figure 36: South America Oil and Gas Industry in Malaysia Volume (Thousand), by Country 2024 & 2032
- Figure 37: South America Oil and Gas Industry in Malaysia Revenue Share (%), by Country 2024 & 2032
- Figure 38: South America Oil and Gas Industry in Malaysia Volume Share (%), by Country 2024 & 2032
- Figure 39: Europe Oil and Gas Industry in Malaysia Revenue (Million), by Upstream 2024 & 2032
- Figure 40: Europe Oil and Gas Industry in Malaysia Volume (Thousand), by Upstream 2024 & 2032
- Figure 41: Europe Oil and Gas Industry in Malaysia Revenue Share (%), by Upstream 2024 & 2032
- Figure 42: Europe Oil and Gas Industry in Malaysia Volume Share (%), by Upstream 2024 & 2032
- Figure 43: Europe Oil and Gas Industry in Malaysia Revenue (Million), by Midstream 2024 & 2032
- Figure 44: Europe Oil and Gas Industry in Malaysia Volume (Thousand), by Midstream 2024 & 2032
- Figure 45: Europe Oil and Gas Industry in Malaysia Revenue Share (%), by Midstream 2024 & 2032
- Figure 46: Europe Oil and Gas Industry in Malaysia Volume Share (%), by Midstream 2024 & 2032
- Figure 47: Europe Oil and Gas Industry in Malaysia Revenue (Million), by Downstream 2024 & 2032
- Figure 48: Europe Oil and Gas Industry in Malaysia Volume (Thousand), by Downstream 2024 & 2032
- Figure 49: Europe Oil and Gas Industry in Malaysia Revenue Share (%), by Downstream 2024 & 2032
- Figure 50: Europe Oil and Gas Industry in Malaysia Volume Share (%), by Downstream 2024 & 2032
- Figure 51: Europe Oil and Gas Industry in Malaysia Revenue (Million), by Country 2024 & 2032
- Figure 52: Europe Oil and Gas Industry in Malaysia Volume (Thousand), by Country 2024 & 2032
- Figure 53: Europe Oil and Gas Industry in Malaysia Revenue Share (%), by Country 2024 & 2032
- Figure 54: Europe Oil and Gas Industry in Malaysia Volume Share (%), by Country 2024 & 2032
- Figure 55: Middle East & Africa Oil and Gas Industry in Malaysia Revenue (Million), by Upstream 2024 & 2032
- Figure 56: Middle East & Africa Oil and Gas Industry in Malaysia Volume (Thousand), by Upstream 2024 & 2032
- Figure 57: Middle East & Africa Oil and Gas Industry in Malaysia Revenue Share (%), by Upstream 2024 & 2032
- Figure 58: Middle East & Africa Oil and Gas Industry in Malaysia Volume Share (%), by Upstream 2024 & 2032
- Figure 59: Middle East & Africa Oil and Gas Industry in Malaysia Revenue (Million), by Midstream 2024 & 2032
- Figure 60: Middle East & Africa Oil and Gas Industry in Malaysia Volume (Thousand), by Midstream 2024 & 2032
- Figure 61: Middle East & Africa Oil and Gas Industry in Malaysia Revenue Share (%), by Midstream 2024 & 2032
- Figure 62: Middle East & Africa Oil and Gas Industry in Malaysia Volume Share (%), by Midstream 2024 & 2032
- Figure 63: Middle East & Africa Oil and Gas Industry in Malaysia Revenue (Million), by Downstream 2024 & 2032
- Figure 64: Middle East & Africa Oil and Gas Industry in Malaysia Volume (Thousand), by Downstream 2024 & 2032
- Figure 65: Middle East & Africa Oil and Gas Industry in Malaysia Revenue Share (%), by Downstream 2024 & 2032
- Figure 66: Middle East & Africa Oil and Gas Industry in Malaysia Volume Share (%), by Downstream 2024 & 2032
- Figure 67: Middle East & Africa Oil and Gas Industry in Malaysia Revenue (Million), by Country 2024 & 2032
- Figure 68: Middle East & Africa Oil and Gas Industry in Malaysia Volume (Thousand), by Country 2024 & 2032
- Figure 69: Middle East & Africa Oil and Gas Industry in Malaysia Revenue Share (%), by Country 2024 & 2032
- Figure 70: Middle East & Africa Oil and Gas Industry in Malaysia Volume Share (%), by Country 2024 & 2032
- Figure 71: Asia Pacific Oil and Gas Industry in Malaysia Revenue (Million), by Upstream 2024 & 2032
- Figure 72: Asia Pacific Oil and Gas Industry in Malaysia Volume (Thousand), by Upstream 2024 & 2032
- Figure 73: Asia Pacific Oil and Gas Industry in Malaysia Revenue Share (%), by Upstream 2024 & 2032
- Figure 74: Asia Pacific Oil and Gas Industry in Malaysia Volume Share (%), by Upstream 2024 & 2032
- Figure 75: Asia Pacific Oil and Gas Industry in Malaysia Revenue (Million), by Midstream 2024 & 2032
- Figure 76: Asia Pacific Oil and Gas Industry in Malaysia Volume (Thousand), by Midstream 2024 & 2032
- Figure 77: Asia Pacific Oil and Gas Industry in Malaysia Revenue Share (%), by Midstream 2024 & 2032
- Figure 78: Asia Pacific Oil and Gas Industry in Malaysia Volume Share (%), by Midstream 2024 & 2032
- Figure 79: Asia Pacific Oil and Gas Industry in Malaysia Revenue (Million), by Downstream 2024 & 2032
- Figure 80: Asia Pacific Oil and Gas Industry in Malaysia Volume (Thousand), by Downstream 2024 & 2032
- Figure 81: Asia Pacific Oil and Gas Industry in Malaysia Revenue Share (%), by Downstream 2024 & 2032
- Figure 82: Asia Pacific Oil and Gas Industry in Malaysia Volume Share (%), by Downstream 2024 & 2032
- Figure 83: Asia Pacific Oil and Gas Industry in Malaysia Revenue (Million), by Country 2024 & 2032
- Figure 84: Asia Pacific Oil and Gas Industry in Malaysia Volume (Thousand), by Country 2024 & 2032
- Figure 85: Asia Pacific Oil and Gas Industry in Malaysia Revenue Share (%), by Country 2024 & 2032
- Figure 86: Asia Pacific Oil and Gas Industry in Malaysia Volume Share (%), by Country 2024 & 2032
List of Tables
- Table 1: Global Oil and Gas Industry in Malaysia Revenue Million Forecast, by Region 2019 & 2032
- Table 2: Global Oil and Gas Industry in Malaysia Volume Thousand Forecast, by Region 2019 & 2032
- Table 3: Global Oil and Gas Industry in Malaysia Revenue Million Forecast, by Upstream 2019 & 2032
- Table 4: Global Oil and Gas Industry in Malaysia Volume Thousand Forecast, by Upstream 2019 & 2032
- Table 5: Global Oil and Gas Industry in Malaysia Revenue Million Forecast, by Midstream 2019 & 2032
- Table 6: Global Oil and Gas Industry in Malaysia Volume Thousand Forecast, by Midstream 2019 & 2032
- Table 7: Global Oil and Gas Industry in Malaysia Revenue Million Forecast, by Downstream 2019 & 2032
- Table 8: Global Oil and Gas Industry in Malaysia Volume Thousand Forecast, by Downstream 2019 & 2032
- Table 9: Global Oil and Gas Industry in Malaysia Revenue Million Forecast, by Region 2019 & 2032
- Table 10: Global Oil and Gas Industry in Malaysia Volume Thousand Forecast, by Region 2019 & 2032
- Table 11: Global Oil and Gas Industry in Malaysia Revenue Million Forecast, by Country 2019 & 2032
- Table 12: Global Oil and Gas Industry in Malaysia Volume Thousand Forecast, by Country 2019 & 2032
- Table 13: China Oil and Gas Industry in Malaysia Revenue (Million) Forecast, by Application 2019 & 2032
- Table 14: China Oil and Gas Industry in Malaysia Volume (Thousand) Forecast, by Application 2019 & 2032
- Table 15: Japan Oil and Gas Industry in Malaysia Revenue (Million) Forecast, by Application 2019 & 2032
- Table 16: Japan Oil and Gas Industry in Malaysia Volume (Thousand) Forecast, by Application 2019 & 2032
- Table 17: India Oil and Gas Industry in Malaysia Revenue (Million) Forecast, by Application 2019 & 2032
- Table 18: India Oil and Gas Industry in Malaysia Volume (Thousand) Forecast, by Application 2019 & 2032
- Table 19: South Korea Oil and Gas Industry in Malaysia Revenue (Million) Forecast, by Application 2019 & 2032
- Table 20: South Korea Oil and Gas Industry in Malaysia Volume (Thousand) Forecast, by Application 2019 & 2032
- Table 21: Taiwan Oil and Gas Industry in Malaysia Revenue (Million) Forecast, by Application 2019 & 2032
- Table 22: Taiwan Oil and Gas Industry in Malaysia Volume (Thousand) Forecast, by Application 2019 & 2032
- Table 23: Australia Oil and Gas Industry in Malaysia Revenue (Million) Forecast, by Application 2019 & 2032
- Table 24: Australia Oil and Gas Industry in Malaysia Volume (Thousand) Forecast, by Application 2019 & 2032
- Table 25: Rest of Asia-Pacific Oil and Gas Industry in Malaysia Revenue (Million) Forecast, by Application 2019 & 2032
- Table 26: Rest of Asia-Pacific Oil and Gas Industry in Malaysia Volume (Thousand) Forecast, by Application 2019 & 2032
- Table 27: Global Oil and Gas Industry in Malaysia Revenue Million Forecast, by Upstream 2019 & 2032
- Table 28: Global Oil and Gas Industry in Malaysia Volume Thousand Forecast, by Upstream 2019 & 2032
- Table 29: Global Oil and Gas Industry in Malaysia Revenue Million Forecast, by Midstream 2019 & 2032
- Table 30: Global Oil and Gas Industry in Malaysia Volume Thousand Forecast, by Midstream 2019 & 2032
- Table 31: Global Oil and Gas Industry in Malaysia Revenue Million Forecast, by Downstream 2019 & 2032
- Table 32: Global Oil and Gas Industry in Malaysia Volume Thousand Forecast, by Downstream 2019 & 2032
- Table 33: Global Oil and Gas Industry in Malaysia Revenue Million Forecast, by Country 2019 & 2032
- Table 34: Global Oil and Gas Industry in Malaysia Volume Thousand Forecast, by Country 2019 & 2032
- Table 35: United States Oil and Gas Industry in Malaysia Revenue (Million) Forecast, by Application 2019 & 2032
- Table 36: United States Oil and Gas Industry in Malaysia Volume (Thousand) Forecast, by Application 2019 & 2032
- Table 37: Canada Oil and Gas Industry in Malaysia Revenue (Million) Forecast, by Application 2019 & 2032
- Table 38: Canada Oil and Gas Industry in Malaysia Volume (Thousand) Forecast, by Application 2019 & 2032
- Table 39: Mexico Oil and Gas Industry in Malaysia Revenue (Million) Forecast, by Application 2019 & 2032
- Table 40: Mexico Oil and Gas Industry in Malaysia Volume (Thousand) Forecast, by Application 2019 & 2032
- Table 41: Global Oil and Gas Industry in Malaysia Revenue Million Forecast, by Upstream 2019 & 2032
- Table 42: Global Oil and Gas Industry in Malaysia Volume Thousand Forecast, by Upstream 2019 & 2032
- Table 43: Global Oil and Gas Industry in Malaysia Revenue Million Forecast, by Midstream 2019 & 2032
- Table 44: Global Oil and Gas Industry in Malaysia Volume Thousand Forecast, by Midstream 2019 & 2032
- Table 45: Global Oil and Gas Industry in Malaysia Revenue Million Forecast, by Downstream 2019 & 2032
- Table 46: Global Oil and Gas Industry in Malaysia Volume Thousand Forecast, by Downstream 2019 & 2032
- Table 47: Global Oil and Gas Industry in Malaysia Revenue Million Forecast, by Country 2019 & 2032
- Table 48: Global Oil and Gas Industry in Malaysia Volume Thousand Forecast, by Country 2019 & 2032
- Table 49: Brazil Oil and Gas Industry in Malaysia Revenue (Million) Forecast, by Application 2019 & 2032
- Table 50: Brazil Oil and Gas Industry in Malaysia Volume (Thousand) Forecast, by Application 2019 & 2032
- Table 51: Argentina Oil and Gas Industry in Malaysia Revenue (Million) Forecast, by Application 2019 & 2032
- Table 52: Argentina Oil and Gas Industry in Malaysia Volume (Thousand) Forecast, by Application 2019 & 2032
- Table 53: Rest of South America Oil and Gas Industry in Malaysia Revenue (Million) Forecast, by Application 2019 & 2032
- Table 54: Rest of South America Oil and Gas Industry in Malaysia Volume (Thousand) Forecast, by Application 2019 & 2032
- Table 55: Global Oil and Gas Industry in Malaysia Revenue Million Forecast, by Upstream 2019 & 2032
- Table 56: Global Oil and Gas Industry in Malaysia Volume Thousand Forecast, by Upstream 2019 & 2032
- Table 57: Global Oil and Gas Industry in Malaysia Revenue Million Forecast, by Midstream 2019 & 2032
- Table 58: Global Oil and Gas Industry in Malaysia Volume Thousand Forecast, by Midstream 2019 & 2032
- Table 59: Global Oil and Gas Industry in Malaysia Revenue Million Forecast, by Downstream 2019 & 2032
- Table 60: Global Oil and Gas Industry in Malaysia Volume Thousand Forecast, by Downstream 2019 & 2032
- Table 61: Global Oil and Gas Industry in Malaysia Revenue Million Forecast, by Country 2019 & 2032
- Table 62: Global Oil and Gas Industry in Malaysia Volume Thousand Forecast, by Country 2019 & 2032
- Table 63: United Kingdom Oil and Gas Industry in Malaysia Revenue (Million) Forecast, by Application 2019 & 2032
- Table 64: United Kingdom Oil and Gas Industry in Malaysia Volume (Thousand) Forecast, by Application 2019 & 2032
- Table 65: Germany Oil and Gas Industry in Malaysia Revenue (Million) Forecast, by Application 2019 & 2032
- Table 66: Germany Oil and Gas Industry in Malaysia Volume (Thousand) Forecast, by Application 2019 & 2032
- Table 67: France Oil and Gas Industry in Malaysia Revenue (Million) Forecast, by Application 2019 & 2032
- Table 68: France Oil and Gas Industry in Malaysia Volume (Thousand) Forecast, by Application 2019 & 2032
- Table 69: Italy Oil and Gas Industry in Malaysia Revenue (Million) Forecast, by Application 2019 & 2032
- Table 70: Italy Oil and Gas Industry in Malaysia Volume (Thousand) Forecast, by Application 2019 & 2032
- Table 71: Spain Oil and Gas Industry in Malaysia Revenue (Million) Forecast, by Application 2019 & 2032
- Table 72: Spain Oil and Gas Industry in Malaysia Volume (Thousand) Forecast, by Application 2019 & 2032
- Table 73: Russia Oil and Gas Industry in Malaysia Revenue (Million) Forecast, by Application 2019 & 2032
- Table 74: Russia Oil and Gas Industry in Malaysia Volume (Thousand) Forecast, by Application 2019 & 2032
- Table 75: Benelux Oil and Gas Industry in Malaysia Revenue (Million) Forecast, by Application 2019 & 2032
- Table 76: Benelux Oil and Gas Industry in Malaysia Volume (Thousand) Forecast, by Application 2019 & 2032
- Table 77: Nordics Oil and Gas Industry in Malaysia Revenue (Million) Forecast, by Application 2019 & 2032
- Table 78: Nordics Oil and Gas Industry in Malaysia Volume (Thousand) Forecast, by Application 2019 & 2032
- Table 79: Rest of Europe Oil and Gas Industry in Malaysia Revenue (Million) Forecast, by Application 2019 & 2032
- Table 80: Rest of Europe Oil and Gas Industry in Malaysia Volume (Thousand) Forecast, by Application 2019 & 2032
- Table 81: Global Oil and Gas Industry in Malaysia Revenue Million Forecast, by Upstream 2019 & 2032
- Table 82: Global Oil and Gas Industry in Malaysia Volume Thousand Forecast, by Upstream 2019 & 2032
- Table 83: Global Oil and Gas Industry in Malaysia Revenue Million Forecast, by Midstream 2019 & 2032
- Table 84: Global Oil and Gas Industry in Malaysia Volume Thousand Forecast, by Midstream 2019 & 2032
- Table 85: Global Oil and Gas Industry in Malaysia Revenue Million Forecast, by Downstream 2019 & 2032
- Table 86: Global Oil and Gas Industry in Malaysia Volume Thousand Forecast, by Downstream 2019 & 2032
- Table 87: Global Oil and Gas Industry in Malaysia Revenue Million Forecast, by Country 2019 & 2032
- Table 88: Global Oil and Gas Industry in Malaysia Volume Thousand Forecast, by Country 2019 & 2032
- Table 89: Turkey Oil and Gas Industry in Malaysia Revenue (Million) Forecast, by Application 2019 & 2032
- Table 90: Turkey Oil and Gas Industry in Malaysia Volume (Thousand) Forecast, by Application 2019 & 2032
- Table 91: Israel Oil and Gas Industry in Malaysia Revenue (Million) Forecast, by Application 2019 & 2032
- Table 92: Israel Oil and Gas Industry in Malaysia Volume (Thousand) Forecast, by Application 2019 & 2032
- Table 93: GCC Oil and Gas Industry in Malaysia Revenue (Million) Forecast, by Application 2019 & 2032
- Table 94: GCC Oil and Gas Industry in Malaysia Volume (Thousand) Forecast, by Application 2019 & 2032
- Table 95: North Africa Oil and Gas Industry in Malaysia Revenue (Million) Forecast, by Application 2019 & 2032
- Table 96: North Africa Oil and Gas Industry in Malaysia Volume (Thousand) Forecast, by Application 2019 & 2032
- Table 97: South Africa Oil and Gas Industry in Malaysia Revenue (Million) Forecast, by Application 2019 & 2032
- Table 98: South Africa Oil and Gas Industry in Malaysia Volume (Thousand) Forecast, by Application 2019 & 2032
- Table 99: Rest of Middle East & Africa Oil and Gas Industry in Malaysia Revenue (Million) Forecast, by Application 2019 & 2032
- Table 100: Rest of Middle East & Africa Oil and Gas Industry in Malaysia Volume (Thousand) Forecast, by Application 2019 & 2032
- Table 101: Global Oil and Gas Industry in Malaysia Revenue Million Forecast, by Upstream 2019 & 2032
- Table 102: Global Oil and Gas Industry in Malaysia Volume Thousand Forecast, by Upstream 2019 & 2032
- Table 103: Global Oil and Gas Industry in Malaysia Revenue Million Forecast, by Midstream 2019 & 2032
- Table 104: Global Oil and Gas Industry in Malaysia Volume Thousand Forecast, by Midstream 2019 & 2032
- Table 105: Global Oil and Gas Industry in Malaysia Revenue Million Forecast, by Downstream 2019 & 2032
- Table 106: Global Oil and Gas Industry in Malaysia Volume Thousand Forecast, by Downstream 2019 & 2032
- Table 107: Global Oil and Gas Industry in Malaysia Revenue Million Forecast, by Country 2019 & 2032
- Table 108: Global Oil and Gas Industry in Malaysia Volume Thousand Forecast, by Country 2019 & 2032
- Table 109: China Oil and Gas Industry in Malaysia Revenue (Million) Forecast, by Application 2019 & 2032
- Table 110: China Oil and Gas Industry in Malaysia Volume (Thousand) Forecast, by Application 2019 & 2032
- Table 111: India Oil and Gas Industry in Malaysia Revenue (Million) Forecast, by Application 2019 & 2032
- Table 112: India Oil and Gas Industry in Malaysia Volume (Thousand) Forecast, by Application 2019 & 2032
- Table 113: Japan Oil and Gas Industry in Malaysia Revenue (Million) Forecast, by Application 2019 & 2032
- Table 114: Japan Oil and Gas Industry in Malaysia Volume (Thousand) Forecast, by Application 2019 & 2032
- Table 115: South Korea Oil and Gas Industry in Malaysia Revenue (Million) Forecast, by Application 2019 & 2032
- Table 116: South Korea Oil and Gas Industry in Malaysia Volume (Thousand) Forecast, by Application 2019 & 2032
- Table 117: ASEAN Oil and Gas Industry in Malaysia Revenue (Million) Forecast, by Application 2019 & 2032
- Table 118: ASEAN Oil and Gas Industry in Malaysia Volume (Thousand) Forecast, by Application 2019 & 2032
- Table 119: Oceania Oil and Gas Industry in Malaysia Revenue (Million) Forecast, by Application 2019 & 2032
- Table 120: Oceania Oil and Gas Industry in Malaysia Volume (Thousand) Forecast, by Application 2019 & 2032
- Table 121: Rest of Asia Pacific Oil and Gas Industry in Malaysia Revenue (Million) Forecast, by Application 2019 & 2032
- Table 122: Rest of Asia Pacific Oil and Gas Industry in Malaysia Volume (Thousand) Forecast, by Application 2019 & 2032
Frequently Asked Questions
1. What is the projected Compound Annual Growth Rate (CAGR) of the Oil and Gas Industry in Malaysia?
The projected CAGR is approximately 1.40%.
2. Which companies are prominent players in the Oil and Gas Industry in Malaysia?
Key companies in the market include Petro-Excel Sdn Bhd (PESB), ExxonMobil Corporation, Shell Plc, BP Plc, Petronas Gas Bhd, Chevron Corporation, Altus Oil & Gas Malaysia Sdn Bhd, Malaysiaian General Petroleum Corporation, Malaysiaian Natural Gas Holding Company*List Not Exhaustive, Petro Teguh (M) Sdn Bhd.
3. What are the main segments of the Oil and Gas Industry in Malaysia?
The market segments include Upstream, Midstream, Downstream.
4. Can you provide details about the market size?
The market size is estimated to be USD XX Million as of 2022.
5. What are some drivers contributing to market growth?
4.; Surging Demand For Refined Petroleum Products4.; Significant Untapped Petroleum Reserves in the Sedimentary Basins.
6. What are the notable trends driving market growth?
Midstream Sector is Expected to Have Significant Market Share.
7. Are there any restraints impacting market growth?
4.; High Volatility of Crude Oil Prices.
8. Can you provide examples of recent developments in the market?
January 2023: A consortium of JGC Corporation and Samsung Heavy Industries (SHI) secured an engineering, procurement, construction, and commissioning (EPCC) contract with Petronas for Malaysia's first nearshore floating LNG facility project. The planned facility is set to become the world's first nearshore floating LNG facility. It has a minimum production capacity of 2 million tonnes of LNG annually and is scheduled for completion in 2027.
9. What pricing options are available for accessing the report?
Pricing options include single-user, multi-user, and enterprise licenses priced at USD 3800, USD 4500, and USD 5800 respectively.
10. Is the market size provided in terms of value or volume?
The market size is provided in terms of value, measured in Million and volume, measured in Thousand.
11. Are there any specific market keywords associated with the report?
Yes, the market keyword associated with the report is "Oil and Gas Industry in Malaysia," which aids in identifying and referencing the specific market segment covered.
12. How do I determine which pricing option suits my needs best?
The pricing options vary based on user requirements and access needs. Individual users may opt for single-user licenses, while businesses requiring broader access may choose multi-user or enterprise licenses for cost-effective access to the report.
13. Are there any additional resources or data provided in the Oil and Gas Industry in Malaysia report?
While the report offers comprehensive insights, it's advisable to review the specific contents or supplementary materials provided to ascertain if additional resources or data are available.
14. How can I stay updated on further developments or reports in the Oil and Gas Industry in Malaysia?
To stay informed about further developments, trends, and reports in the Oil and Gas Industry in Malaysia, consider subscribing to industry newsletters, following relevant companies and organizations, or regularly checking reputable industry news sources and publications.
Methodology
Step 1 - Identification of Relevant Samples Size from Population Database


Step 2 - Approaches for Defining Global Market Size (Value, Volume* & Price*)

Note*: In applicable scenarios
Step 3 - Data Sources
Primary Research
- Web Analytics
- Survey Reports
- Research Institute
- Latest Research Reports
- Opinion Leaders
Secondary Research
- Annual Reports
- White Paper
- Latest Press Release
- Industry Association
- Paid Database
- Investor Presentations

Step 4 - Data Triangulation
Involves using different sources of information in order to increase the validity of a study
These sources are likely to be stakeholders in a program - participants, other researchers, program staff, other community members, and so on.
Then we put all data in single framework & apply various statistical tools to find out the dynamic on the market.
During the analysis stage, feedback from the stakeholder groups would be compared to determine areas of agreement as well as areas of divergence


