
Key Insights
The Trinidad and Tobago oil and gas industry, while facing headwinds from global energy transitions, remains a significant contributor to the nation's economy. The period 2019-2024 likely witnessed fluctuating market performance influenced by global oil price volatility and the COVID-19 pandemic's impact on energy demand. Production levels, although historically significant, may have experienced some decline during this period, potentially impacting overall market size. However, ongoing exploration activities and investment in existing infrastructure suggest a degree of resilience. The country's strategic location and established infrastructure provide a competitive advantage, particularly for supplying regional markets. Looking forward to 2025-2033, a moderate Compound Annual Growth Rate (CAGR) is anticipated, driven by factors including sustained global demand (particularly in emerging markets), ongoing investment in upstream and downstream projects, and efforts to diversify the energy sector through exploration of natural gas and renewable energy sources. This growth, however, is expected to be tempered by the global push towards decarbonization and the increasing pressure on fossil fuel producers to adopt sustainable practices. Government policies aimed at promoting responsible energy development and attracting foreign investment will play a critical role in shaping the industry's future trajectory. Diversification into petrochemicals and other value-added products will likely become increasingly important for maintaining long-term profitability and economic contribution.
The industry's future depends on successfully navigating the complexities of the global energy transition. This includes strategic investments in carbon capture and storage technologies, the exploration of alternative energy sources to create a more diversified energy mix, and adaptation to evolving international environmental regulations. Focus on efficiency improvements in production and processing, coupled with initiatives to enhance environmental sustainability, will be crucial for ensuring the long-term viability and positive image of the Trinidad and Tobago oil and gas sector. The nation’s commitment to responsible energy management will be a key determinant of its success in this evolving landscape.
Oil and Gas Industry in Trinidad and Tobago: 2019-2033 Market Analysis & Forecast Report
This comprehensive report provides an in-depth analysis of the Oil and Gas industry in Trinidad and Tobago, offering critical insights for industry professionals, investors, and policymakers. Covering the period from 2019 to 2033, with a focus on 2025, this report delivers actionable intelligence on market dynamics, key players, and future growth prospects. The study leverages extensive primary and secondary research to provide a nuanced understanding of this dynamic sector.
Oil and Gas Industry in Trinidad and Tobago Market Structure & Innovation Trends
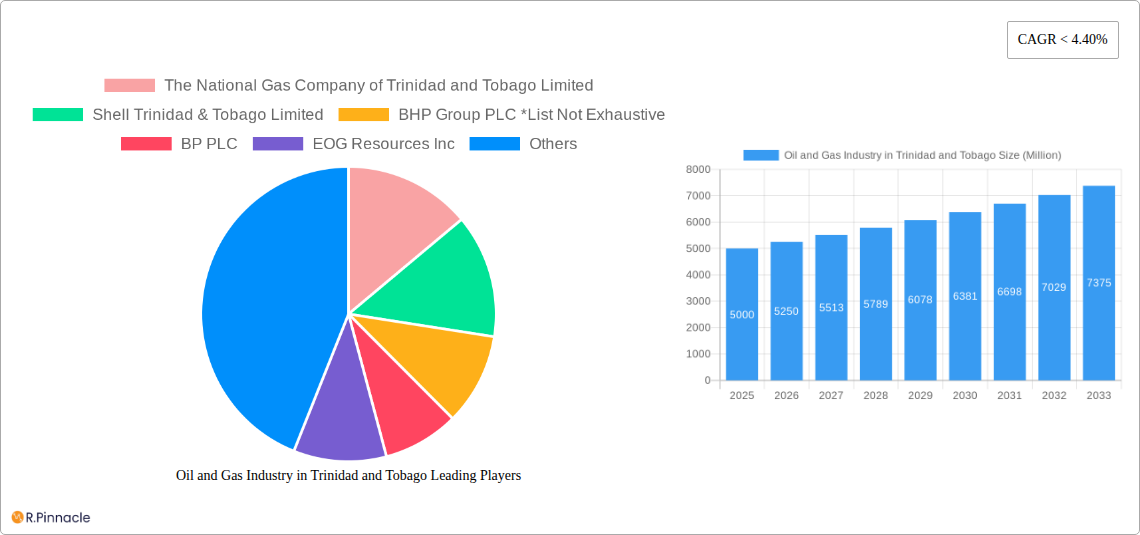
This section analyzes the competitive landscape of Trinidad and Tobago's oil and gas sector, exploring market concentration, innovation drivers, and regulatory influences. We examine the roles of major players such as The National Gas Company of Trinidad and Tobago Limited, Shell Trinidad & Tobago Limited, BHP Group PLC, BP PLC, and EOG Resources Inc. (list not exhaustive), assessing their market share and contributions to innovation. Furthermore, the report delves into mergers and acquisitions (M&A) activity, quantifying deal values and their impact on market structure. The analysis includes an assessment of regulatory frameworks, the presence of product substitutes, end-user demographics, and the overall innovation ecosystem. We project a xx% market share for The National Gas Company of Trinidad and Tobago Limited in 2025, with total M&A deal values exceeding $xx Million in the period 2019-2024.
- Market Concentration: Analysis of market share distribution among key players.
- Innovation Drivers: Identification of key technological advancements and their impact.
- Regulatory Landscape: Evaluation of government policies and their influence on industry activities.
- Product Substitutes: Assessment of the threat from alternative energy sources.
- M&A Activity: Detailed analysis of significant mergers and acquisitions, including deal values.
Oil and Gas Industry in Trinidad and Tobago Market Dynamics & Trends
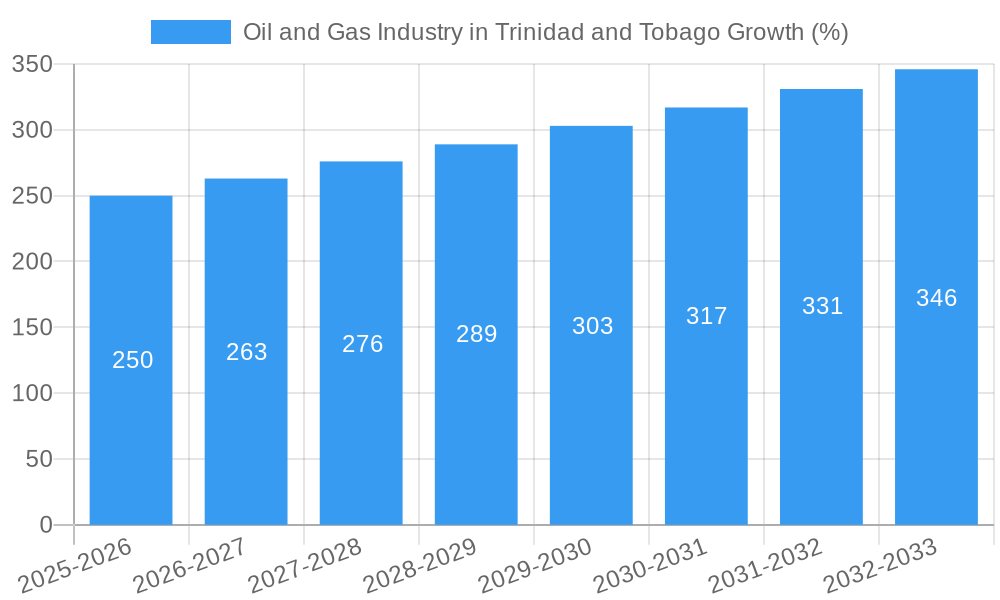
This section examines the key drivers and trends shaping the Trinidad and Tobago oil and gas market from 2019 to 2033. We analyze market growth, focusing on the compound annual growth rate (CAGR) and market penetration rates for both onshore and offshore segments. The impact of technological disruptions, evolving consumer preferences (e.g., demand for cleaner energy sources), and intense competitive dynamics are thoroughly explored. Specific factors influencing growth are detailed, providing a comprehensive understanding of the market’s trajectory. We project a CAGR of xx% for the overall market between 2025 and 2033, with offshore production exhibiting a higher growth rate than onshore.
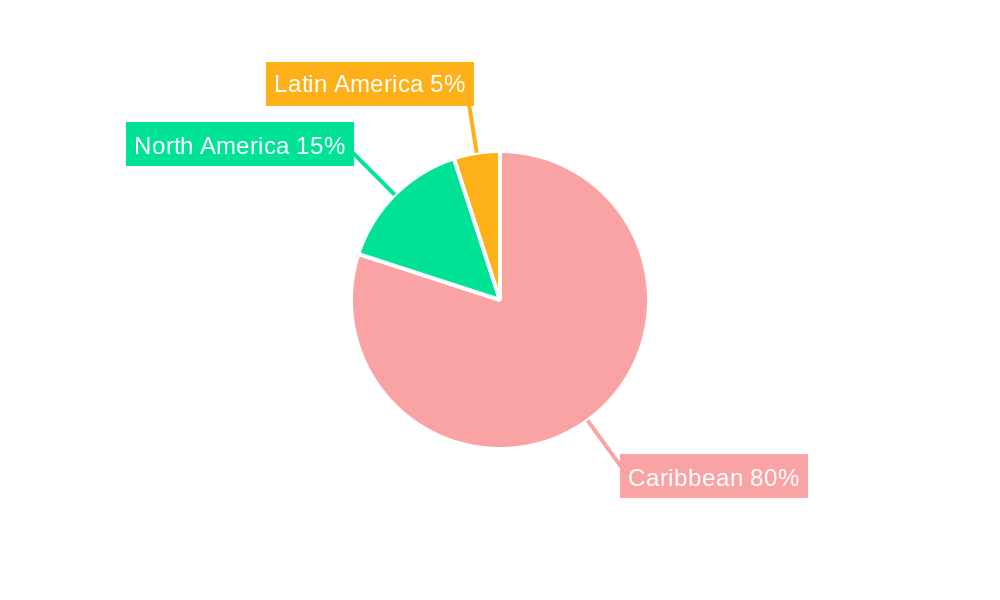
Dominant Regions & Segments in Oil and Gas Industry in Trinidad and Tobago
This section identifies the dominant regions and segments within the Trinidad and Tobago oil and gas industry. A detailed analysis of onshore and offshore operations will be provided. We will assess which sector (onshore or offshore) holds the larger market share and contribute a greater value to the overall GDP.
- Onshore:
- Key drivers: Existing infrastructure, proximity to processing facilities, lower initial capital investment.
- Dominance analysis: Market share, production volume, and economic contribution.
- Offshore:
- Key drivers: Access to larger reserves, potential for higher production, advancements in deepwater technology.
- Dominance analysis: Market share, production volume, investment levels, and future potential.
The report will conclude with an assessment of which segment (onshore or offshore) is expected to experience greater growth during the forecast period (2025-2033).
Oil and Gas Industry in Trinidad and Tobago Product Innovations
This section highlights recent product innovations within the Trinidad and Tobago oil and gas sector, including advancements in extraction technologies, processing techniques, and the development of new energy products. The analysis emphasizes the competitive advantages offered by these innovations and their alignment with broader market trends, particularly concerning sustainability and environmental concerns. The focus will be on the technological advancements that improve efficiency, reduce costs, and minimize environmental impact.
Report Scope & Segmentation Analysis
This report segments the Trinidad and Tobago oil and gas market by location of deployment: onshore and offshore. Each segment is analyzed in detail, including growth projections, market sizes, and competitive dynamics. Detailed forecasts are provided for each segment for the period 2025-2033, outlining their respective contributions to the overall market value. The analysis identifies the leading companies in each segment and highlights the competitive strategies they employ.
Key Drivers of Oil and Gas Industry in Trinidad and Tobago Growth
This section identifies the primary factors driving growth in the Trinidad and Tobago oil and gas sector. These drivers include advancements in exploration and extraction technologies, supportive government policies, increasing global energy demand, and strategic investments in infrastructure development. Specific examples of these drivers and their projected impact on market growth will be provided.
Challenges in the Oil and Gas Industry in Trinidad and Tobago Sector
This section outlines the key challenges facing the Trinidad and Tobago oil and gas industry, including regulatory hurdles, volatile global oil prices, environmental concerns, and the need for significant investments in infrastructure upgrades and technological advancements. The quantifiable impact of these challenges on market growth and profitability will be assessed.
Emerging Opportunities in Oil and Gas Industry in Trinidad and Tobago
This section highlights emerging opportunities for growth and innovation in the Trinidad and Tobago oil and gas sector. These opportunities include the development of new energy sources, the adoption of sustainable practices, investments in renewable energy technologies, and the exploration of new markets and partnerships.
Leading Players in the Oil and Gas Industry in Trinidad and Tobago Market
- The National Gas Company of Trinidad and Tobago Limited
- Shell Trinidad & Tobago Limited
- BHP Group PLC
- BP PLC
- EOG Resources Inc
Key Developments in Oil and Gas Industry in Trinidad and Tobago Industry
- [Year/Month]: [Development Description and Impact on Market Dynamics]
- [Year/Month]: [Development Description and Impact on Market Dynamics]
- [Year/Month]: [Development Description and Impact on Market Dynamics]
Future Outlook for Oil and Gas Industry in Trinidad and Tobago Market
This section provides a summary of the future outlook for the Trinidad and Tobago oil and gas market, focusing on growth potential, strategic opportunities, and the long-term sustainability of the sector. The analysis considers the interplay of various factors such as technological innovation, government policies, and global energy demand. It concludes with an overall assessment of the market’s prospects and the potential for significant growth in the coming years.
Oil and Gas Industry in Trinidad and Tobago Segmentation
-
1. Location of Deployment
- 1.1. Onshore
- 1.2. Offshore
Oil and Gas Industry in Trinidad and Tobago Segmentation By Geography
-
1. North America
- 1.1. United States
- 1.2. Canada
- 1.3. Mexico
-
2. South America
- 2.1. Brazil
- 2.2. Argentina
- 2.3. Rest of South America
-
3. Europe
- 3.1. United Kingdom
- 3.2. Germany
- 3.3. France
- 3.4. Italy
- 3.5. Spain
- 3.6. Russia
- 3.7. Benelux
- 3.8. Nordics
- 3.9. Rest of Europe
-
4. Middle East & Africa
- 4.1. Turkey
- 4.2. Israel
- 4.3. GCC
- 4.4. North Africa
- 4.5. South Africa
- 4.6. Rest of Middle East & Africa
-
5. Asia Pacific
- 5.1. China
- 5.2. India
- 5.3. Japan
- 5.4. South Korea
- 5.5. ASEAN
- 5.6. Oceania
- 5.7. Rest of Asia Pacific
Oil and Gas Industry in Trinidad and Tobago REPORT HIGHLIGHTS
| Aspects | Details |
|---|---|
| Study Period | 2019-2033 |
| Base Year | 2024 |
| Estimated Year | 2025 |
| Forecast Period | 2025-2033 |
| Historical Period | 2019-2024 |
| Growth Rate | CAGR of < 4.40% from 2019-2033 |
| Segmentation |
|
Table of Contents
- 1. Introduction
- 1.1. Research Scope
- 1.2. Market Segmentation
- 1.3. Research Methodology
- 1.4. Definitions and Assumptions
- 2. Executive Summary
- 2.1. Introduction
- 3. Market Dynamics
- 3.1. Introduction
- 3.2. Market Drivers
- 3.2.1. 4.; Increasing Investment in Oil and Gas Sector4.; Supportive Government Policies
- 3.3. Market Restrains
- 3.3.1. 4.; Inclination towards renewable energy
- 3.4. Market Trends
- 3.4.1. Offshore Oil and Gas Production to Dominate the Market
- 4. Market Factor Analysis
- 4.1. Porters Five Forces
- 4.2. Supply/Value Chain
- 4.3. PESTEL analysis
- 4.4. Market Entropy
- 4.5. Patent/Trademark Analysis
- 5. Global Oil and Gas Industry in Trinidad and Tobago Analysis, Insights and Forecast, 2019-2031
- 5.1. Market Analysis, Insights and Forecast - by Location of Deployment
- 5.1.1. Onshore
- 5.1.2. Offshore
- 5.2. Market Analysis, Insights and Forecast - by Region
- 5.2.1. North America
- 5.2.2. South America
- 5.2.3. Europe
- 5.2.4. Middle East & Africa
- 5.2.5. Asia Pacific
- 5.1. Market Analysis, Insights and Forecast - by Location of Deployment
- 6. North America Oil and Gas Industry in Trinidad and Tobago Analysis, Insights and Forecast, 2019-2031
- 6.1. Market Analysis, Insights and Forecast - by Location of Deployment
- 6.1.1. Onshore
- 6.1.2. Offshore
- 6.1. Market Analysis, Insights and Forecast - by Location of Deployment
- 7. South America Oil and Gas Industry in Trinidad and Tobago Analysis, Insights and Forecast, 2019-2031
- 7.1. Market Analysis, Insights and Forecast - by Location of Deployment
- 7.1.1. Onshore
- 7.1.2. Offshore
- 7.1. Market Analysis, Insights and Forecast - by Location of Deployment
- 8. Europe Oil and Gas Industry in Trinidad and Tobago Analysis, Insights and Forecast, 2019-2031
- 8.1. Market Analysis, Insights and Forecast - by Location of Deployment
- 8.1.1. Onshore
- 8.1.2. Offshore
- 8.1. Market Analysis, Insights and Forecast - by Location of Deployment
- 9. Middle East & Africa Oil and Gas Industry in Trinidad and Tobago Analysis, Insights and Forecast, 2019-2031
- 9.1. Market Analysis, Insights and Forecast - by Location of Deployment
- 9.1.1. Onshore
- 9.1.2. Offshore
- 9.1. Market Analysis, Insights and Forecast - by Location of Deployment
- 10. Asia Pacific Oil and Gas Industry in Trinidad and Tobago Analysis, Insights and Forecast, 2019-2031
- 10.1. Market Analysis, Insights and Forecast - by Location of Deployment
- 10.1.1. Onshore
- 10.1.2. Offshore
- 10.1. Market Analysis, Insights and Forecast - by Location of Deployment
- 11. Competitive Analysis
- 11.1. Global Market Share Analysis 2024
- 11.2. Company Profiles
- 11.2.1 The National Gas Company of Trinidad and Tobago Limited
- 11.2.1.1. Overview
- 11.2.1.2. Products
- 11.2.1.3. SWOT Analysis
- 11.2.1.4. Recent Developments
- 11.2.1.5. Financials (Based on Availability)
- 11.2.2 Shell Trinidad & Tobago Limited
- 11.2.2.1. Overview
- 11.2.2.2. Products
- 11.2.2.3. SWOT Analysis
- 11.2.2.4. Recent Developments
- 11.2.2.5. Financials (Based on Availability)
- 11.2.3 BHP Group PLC *List Not Exhaustive
- 11.2.3.1. Overview
- 11.2.3.2. Products
- 11.2.3.3. SWOT Analysis
- 11.2.3.4. Recent Developments
- 11.2.3.5. Financials (Based on Availability)
- 11.2.4 BP PLC
- 11.2.4.1. Overview
- 11.2.4.2. Products
- 11.2.4.3. SWOT Analysis
- 11.2.4.4. Recent Developments
- 11.2.4.5. Financials (Based on Availability)
- 11.2.5 EOG Resources Inc
- 11.2.5.1. Overview
- 11.2.5.2. Products
- 11.2.5.3. SWOT Analysis
- 11.2.5.4. Recent Developments
- 11.2.5.5. Financials (Based on Availability)
- 11.2.1 The National Gas Company of Trinidad and Tobago Limited
List of Figures
- Figure 1: Global Oil and Gas Industry in Trinidad and Tobago Revenue Breakdown (Million, %) by Region 2024 & 2032
- Figure 2: Trinidad and Tobago Oil and Gas Industry in Trinidad and Tobago Revenue (Million), by Country 2024 & 2032
- Figure 3: Trinidad and Tobago Oil and Gas Industry in Trinidad and Tobago Revenue Share (%), by Country 2024 & 2032
- Figure 4: North America Oil and Gas Industry in Trinidad and Tobago Revenue (Million), by Location of Deployment 2024 & 2032
- Figure 5: North America Oil and Gas Industry in Trinidad and Tobago Revenue Share (%), by Location of Deployment 2024 & 2032
- Figure 6: North America Oil and Gas Industry in Trinidad and Tobago Revenue (Million), by Country 2024 & 2032
- Figure 7: North America Oil and Gas Industry in Trinidad and Tobago Revenue Share (%), by Country 2024 & 2032
- Figure 8: South America Oil and Gas Industry in Trinidad and Tobago Revenue (Million), by Location of Deployment 2024 & 2032
- Figure 9: South America Oil and Gas Industry in Trinidad and Tobago Revenue Share (%), by Location of Deployment 2024 & 2032
- Figure 10: South America Oil and Gas Industry in Trinidad and Tobago Revenue (Million), by Country 2024 & 2032
- Figure 11: South America Oil and Gas Industry in Trinidad and Tobago Revenue Share (%), by Country 2024 & 2032
- Figure 12: Europe Oil and Gas Industry in Trinidad and Tobago Revenue (Million), by Location of Deployment 2024 & 2032
- Figure 13: Europe Oil and Gas Industry in Trinidad and Tobago Revenue Share (%), by Location of Deployment 2024 & 2032
- Figure 14: Europe Oil and Gas Industry in Trinidad and Tobago Revenue (Million), by Country 2024 & 2032
- Figure 15: Europe Oil and Gas Industry in Trinidad and Tobago Revenue Share (%), by Country 2024 & 2032
- Figure 16: Middle East & Africa Oil and Gas Industry in Trinidad and Tobago Revenue (Million), by Location of Deployment 2024 & 2032
- Figure 17: Middle East & Africa Oil and Gas Industry in Trinidad and Tobago Revenue Share (%), by Location of Deployment 2024 & 2032
- Figure 18: Middle East & Africa Oil and Gas Industry in Trinidad and Tobago Revenue (Million), by Country 2024 & 2032
- Figure 19: Middle East & Africa Oil and Gas Industry in Trinidad and Tobago Revenue Share (%), by Country 2024 & 2032
- Figure 20: Asia Pacific Oil and Gas Industry in Trinidad and Tobago Revenue (Million), by Location of Deployment 2024 & 2032
- Figure 21: Asia Pacific Oil and Gas Industry in Trinidad and Tobago Revenue Share (%), by Location of Deployment 2024 & 2032
- Figure 22: Asia Pacific Oil and Gas Industry in Trinidad and Tobago Revenue (Million), by Country 2024 & 2032
- Figure 23: Asia Pacific Oil and Gas Industry in Trinidad and Tobago Revenue Share (%), by Country 2024 & 2032
List of Tables
- Table 1: Global Oil and Gas Industry in Trinidad and Tobago Revenue Million Forecast, by Region 2019 & 2032
- Table 2: Global Oil and Gas Industry in Trinidad and Tobago Revenue Million Forecast, by Location of Deployment 2019 & 2032
- Table 3: Global Oil and Gas Industry in Trinidad and Tobago Revenue Million Forecast, by Region 2019 & 2032
- Table 4: Global Oil and Gas Industry in Trinidad and Tobago Revenue Million Forecast, by Country 2019 & 2032
- Table 5: Global Oil and Gas Industry in Trinidad and Tobago Revenue Million Forecast, by Location of Deployment 2019 & 2032
- Table 6: Global Oil and Gas Industry in Trinidad and Tobago Revenue Million Forecast, by Country 2019 & 2032
- Table 7: United States Oil and Gas Industry in Trinidad and Tobago Revenue (Million) Forecast, by Application 2019 & 2032
- Table 8: Canada Oil and Gas Industry in Trinidad and Tobago Revenue (Million) Forecast, by Application 2019 & 2032
- Table 9: Mexico Oil and Gas Industry in Trinidad and Tobago Revenue (Million) Forecast, by Application 2019 & 2032
- Table 10: Global Oil and Gas Industry in Trinidad and Tobago Revenue Million Forecast, by Location of Deployment 2019 & 2032
- Table 11: Global Oil and Gas Industry in Trinidad and Tobago Revenue Million Forecast, by Country 2019 & 2032
- Table 12: Brazil Oil and Gas Industry in Trinidad and Tobago Revenue (Million) Forecast, by Application 2019 & 2032
- Table 13: Argentina Oil and Gas Industry in Trinidad and Tobago Revenue (Million) Forecast, by Application 2019 & 2032
- Table 14: Rest of South America Oil and Gas Industry in Trinidad and Tobago Revenue (Million) Forecast, by Application 2019 & 2032
- Table 15: Global Oil and Gas Industry in Trinidad and Tobago Revenue Million Forecast, by Location of Deployment 2019 & 2032
- Table 16: Global Oil and Gas Industry in Trinidad and Tobago Revenue Million Forecast, by Country 2019 & 2032
- Table 17: United Kingdom Oil and Gas Industry in Trinidad and Tobago Revenue (Million) Forecast, by Application 2019 & 2032
- Table 18: Germany Oil and Gas Industry in Trinidad and Tobago Revenue (Million) Forecast, by Application 2019 & 2032
- Table 19: France Oil and Gas Industry in Trinidad and Tobago Revenue (Million) Forecast, by Application 2019 & 2032
- Table 20: Italy Oil and Gas Industry in Trinidad and Tobago Revenue (Million) Forecast, by Application 2019 & 2032
- Table 21: Spain Oil and Gas Industry in Trinidad and Tobago Revenue (Million) Forecast, by Application 2019 & 2032
- Table 22: Russia Oil and Gas Industry in Trinidad and Tobago Revenue (Million) Forecast, by Application 2019 & 2032
- Table 23: Benelux Oil and Gas Industry in Trinidad and Tobago Revenue (Million) Forecast, by Application 2019 & 2032
- Table 24: Nordics Oil and Gas Industry in Trinidad and Tobago Revenue (Million) Forecast, by Application 2019 & 2032
- Table 25: Rest of Europe Oil and Gas Industry in Trinidad and Tobago Revenue (Million) Forecast, by Application 2019 & 2032
- Table 26: Global Oil and Gas Industry in Trinidad and Tobago Revenue Million Forecast, by Location of Deployment 2019 & 2032
- Table 27: Global Oil and Gas Industry in Trinidad and Tobago Revenue Million Forecast, by Country 2019 & 2032
- Table 28: Turkey Oil and Gas Industry in Trinidad and Tobago Revenue (Million) Forecast, by Application 2019 & 2032
- Table 29: Israel Oil and Gas Industry in Trinidad and Tobago Revenue (Million) Forecast, by Application 2019 & 2032
- Table 30: GCC Oil and Gas Industry in Trinidad and Tobago Revenue (Million) Forecast, by Application 2019 & 2032
- Table 31: North Africa Oil and Gas Industry in Trinidad and Tobago Revenue (Million) Forecast, by Application 2019 & 2032
- Table 32: South Africa Oil and Gas Industry in Trinidad and Tobago Revenue (Million) Forecast, by Application 2019 & 2032
- Table 33: Rest of Middle East & Africa Oil and Gas Industry in Trinidad and Tobago Revenue (Million) Forecast, by Application 2019 & 2032
- Table 34: Global Oil and Gas Industry in Trinidad and Tobago Revenue Million Forecast, by Location of Deployment 2019 & 2032
- Table 35: Global Oil and Gas Industry in Trinidad and Tobago Revenue Million Forecast, by Country 2019 & 2032
- Table 36: China Oil and Gas Industry in Trinidad and Tobago Revenue (Million) Forecast, by Application 2019 & 2032
- Table 37: India Oil and Gas Industry in Trinidad and Tobago Revenue (Million) Forecast, by Application 2019 & 2032
- Table 38: Japan Oil and Gas Industry in Trinidad and Tobago Revenue (Million) Forecast, by Application 2019 & 2032
- Table 39: South Korea Oil and Gas Industry in Trinidad and Tobago Revenue (Million) Forecast, by Application 2019 & 2032
- Table 40: ASEAN Oil and Gas Industry in Trinidad and Tobago Revenue (Million) Forecast, by Application 2019 & 2032
- Table 41: Oceania Oil and Gas Industry in Trinidad and Tobago Revenue (Million) Forecast, by Application 2019 & 2032
- Table 42: Rest of Asia Pacific Oil and Gas Industry in Trinidad and Tobago Revenue (Million) Forecast, by Application 2019 & 2032
Frequently Asked Questions
1. What is the projected Compound Annual Growth Rate (CAGR) of the Oil and Gas Industry in Trinidad and Tobago?
The projected CAGR is approximately < 4.40%.
2. Which companies are prominent players in the Oil and Gas Industry in Trinidad and Tobago?
Key companies in the market include The National Gas Company of Trinidad and Tobago Limited, Shell Trinidad & Tobago Limited, BHP Group PLC *List Not Exhaustive, BP PLC, EOG Resources Inc.
3. What are the main segments of the Oil and Gas Industry in Trinidad and Tobago?
The market segments include Location of Deployment.
4. Can you provide details about the market size?
The market size is estimated to be USD XX Million as of 2022.
5. What are some drivers contributing to market growth?
4.; Increasing Investment in Oil and Gas Sector4.; Supportive Government Policies.
6. What are the notable trends driving market growth?
Offshore Oil and Gas Production to Dominate the Market.
7. Are there any restraints impacting market growth?
4.; Inclination towards renewable energy.
8. Can you provide examples of recent developments in the market?
N/A
9. What pricing options are available for accessing the report?
Pricing options include single-user, multi-user, and enterprise licenses priced at USD 3800, USD 4500, and USD 5800 respectively.
10. Is the market size provided in terms of value or volume?
The market size is provided in terms of value, measured in Million.
11. Are there any specific market keywords associated with the report?
Yes, the market keyword associated with the report is "Oil and Gas Industry in Trinidad and Tobago," which aids in identifying and referencing the specific market segment covered.
12. How do I determine which pricing option suits my needs best?
The pricing options vary based on user requirements and access needs. Individual users may opt for single-user licenses, while businesses requiring broader access may choose multi-user or enterprise licenses for cost-effective access to the report.
13. Are there any additional resources or data provided in the Oil and Gas Industry in Trinidad and Tobago report?
While the report offers comprehensive insights, it's advisable to review the specific contents or supplementary materials provided to ascertain if additional resources or data are available.
14. How can I stay updated on further developments or reports in the Oil and Gas Industry in Trinidad and Tobago?
To stay informed about further developments, trends, and reports in the Oil and Gas Industry in Trinidad and Tobago, consider subscribing to industry newsletters, following relevant companies and organizations, or regularly checking reputable industry news sources and publications.
Methodology
Step 1 - Identification of Relevant Samples Size from Population Database


Step 2 - Approaches for Defining Global Market Size (Value, Volume* & Price*)

Note*: In applicable scenarios
Step 3 - Data Sources
Primary Research
- Web Analytics
- Survey Reports
- Research Institute
- Latest Research Reports
- Opinion Leaders
Secondary Research
- Annual Reports
- White Paper
- Latest Press Release
- Industry Association
- Paid Database
- Investor Presentations

Step 4 - Data Triangulation
Involves using different sources of information in order to increase the validity of a study
These sources are likely to be stakeholders in a program - participants, other researchers, program staff, other community members, and so on.
Then we put all data in single framework & apply various statistical tools to find out the dynamic on the market.
During the analysis stage, feedback from the stakeholder groups would be compared to determine areas of agreement as well as areas of divergence


