
Key Insights
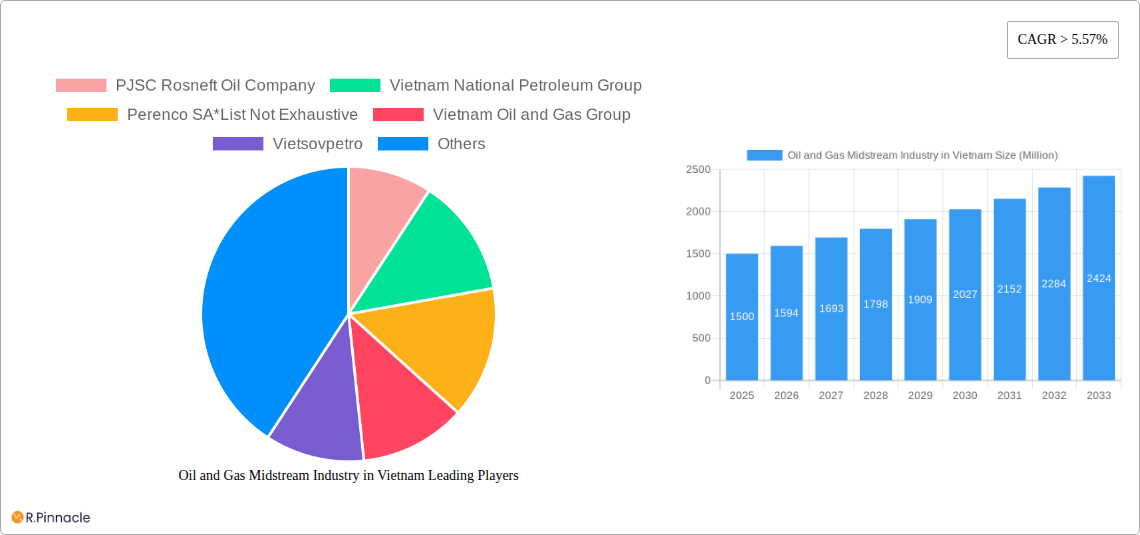
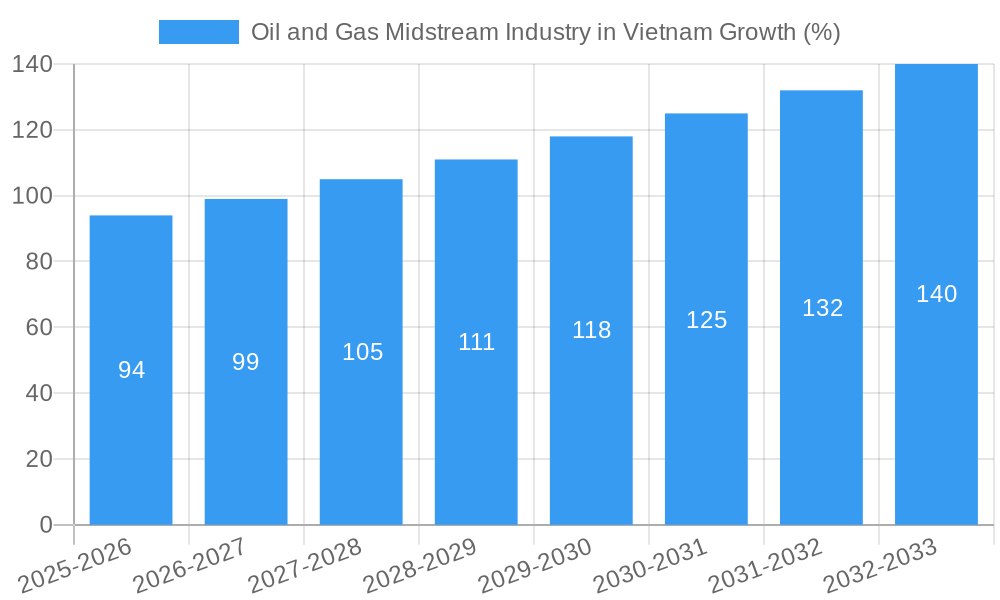
The Vietnamese oil and gas midstream sector, encompassing storage, LNG terminals, and transportation, presents a compelling investment opportunity, exhibiting a Compound Annual Growth Rate (CAGR) exceeding 5.57% from 2019 to 2033. This robust growth is fueled by Vietnam's increasing energy demand driven by its rapidly expanding economy and industrialization. The country's strategic location in Southeast Asia further enhances its importance as a regional energy hub, attracting significant foreign investment in midstream infrastructure development. Key drivers include government initiatives promoting energy security and diversification, alongside rising domestic consumption of natural gas and petroleum products. While challenges such as infrastructure limitations and environmental concerns exist, ongoing investments in upgrading existing facilities and constructing new LNG import terminals are mitigating these constraints. Major players like PJSC Rosneft Oil Company, Vietnam National Petroleum Group, and Perenco SA are actively shaping the market landscape, fostering competition and driving innovation. The segment breakdown reveals a strong focus across storage, LNG terminals, and transportation, indicating balanced growth across the value chain. The forecast period (2025-2033) anticipates continued expansion, with the market size expected to significantly increase based on the projected CAGR.
The substantial growth trajectory suggests significant opportunities for both domestic and international companies operating in the Vietnamese oil and gas midstream sector. The ongoing development of new infrastructure, alongside the government's commitment to sustainable energy development, indicates a positive outlook for the coming decade. However, companies must navigate the complexities of the regulatory environment and address environmental concerns to achieve long-term success. Furthermore, the evolving geopolitical landscape and global energy transitions present both challenges and opportunities, requiring strategic planning and adaptability to thrive in this dynamic market. Further analysis should focus on specific sub-segments to identify areas with the most promising growth potential. Understanding the interplay between domestic policy, international collaboration, and technological advancements will be crucial for stakeholders to capitalize on the sector's growth.
Oil and Gas Midstream Industry in Vietnam: A Comprehensive Market Report (2019-2033)
This in-depth report provides a comprehensive analysis of Vietnam's oil and gas midstream sector, covering market structure, dynamics, key players, and future growth prospects. With a focus on the period 2019-2033 (Base Year: 2025, Forecast Period: 2025-2033), this report is an essential resource for industry professionals, investors, and policymakers seeking to understand this dynamic market. The report leverages extensive data analysis to provide actionable insights across various segments, including Storage, LNG Terminals, and Transportation. We analyze market trends, innovation drivers, competitive dynamics, and emerging opportunities, offering a 360-degree view of the Vietnamese oil and gas midstream landscape.
Oil and Gas Midstream Industry in Vietnam Market Structure & Innovation Trends
Vietnam's oil and gas midstream sector exhibits a complex market structure characterized by a mix of state-owned enterprises (SOEs) and international players. Market concentration is moderate, with key players such as Vietnam National Petroleum Group (PetroVietnam), Vietsovpetro, and Vietnam Oil and Gas Group holding significant market share, though the exact figures remain commercially sensitive and are therefore unavailable (xx%). However, the presence of international companies like PJSC Rosneft Oil Company and Perenco SA indicates growing foreign investment and competition.
- Market Concentration: Moderate, with SOEs holding significant but undisclosed shares.
- Innovation Drivers: Government policies promoting energy diversification, increasing LNG demand, and technological advancements in pipeline infrastructure and storage solutions.
- Regulatory Framework: Vietnam's regulatory environment is evolving, impacting investment decisions and market entry. Specific details are unavailable (xx).
- Product Substitutes: Limited substitutes exist for midstream services, though improvements in energy efficiency and renewable energy sources may present long-term challenges.
- End-User Demographics: Primarily power generation, industrial users, and domestic consumption.
- M&A Activities: The report estimates xx Million USD worth of M&A activity in the historical period, with a projected xx Million USD during the forecast period. Specific deal values and details are commercially sensitive (xx).
Oil and Gas Midstream Industry in Vietnam Market Dynamics & Trends
The Vietnamese oil and gas midstream market is experiencing robust growth driven by increasing energy demand, expanding industrialization, and government initiatives to improve energy infrastructure. The CAGR for the period 2025-2033 is estimated at xx%, fueled by rising LNG imports and domestic gas production. Technological disruptions are evident in the adoption of advanced pipeline technologies, automation in storage facilities, and digital solutions for optimizing logistics. Consumer preferences are shifting towards cleaner energy sources, although natural gas still plays a pivotal role in Vietnam's energy mix. Competitive dynamics are characterized by increasing competition among both domestic and international players, leading to pricing pressures and a focus on operational efficiency. Market penetration of LNG is expected to increase substantially due to government initiatives to diversify energy resources, with the market penetration rate in 2025 projected at xx%.
Dominant Regions & Segments in Oil and Gas Midstream Industry in Vietnam
The Southern region of Vietnam is currently the dominant area for midstream activities, owing to the concentration of LNG import terminals and industrial hubs.
- Key Drivers for Southern Region Dominance:
- Proximity to major industrial centers.
- Existing infrastructure and port facilities.
- Government support for energy projects.
- Significant investment in LNG infrastructure.
Regarding segments, the Transportation segment is currently the most dominant due to the extensive network of pipelines and the transportation of both domestic and imported gas. The LNG Terminals segment is experiencing rapid growth, driven by increasing LNG imports, and is projected to surpass the Transportation segment within the forecast period. Storage continues to show modest but consistent growth in line with energy consumption. These trends may be subject to fluctuations in the coming years.
Oil and Gas Midstream Industry in Vietnam Product Innovations
Recent product innovations focus on improving efficiency and safety in gas transportation and storage. This includes the implementation of advanced pipeline monitoring systems, automation in LNG terminals, and the adoption of smart storage solutions. These innovations are enhancing the sector's competitiveness while improving safety and reducing environmental impact. The market is experiencing a shift towards higher capacity, more efficient, and technologically advanced equipment.
Report Scope & Segmentation Analysis
This report segments the Vietnamese oil and gas midstream market by product type: Storage, LNG Terminals, and Transportation. Each segment is analyzed in terms of market size, growth projections, and competitive dynamics. For instance, the Storage segment projects xx Million USD in 2025, with an expected CAGR of xx% until 2033. The LNG Terminals segment shows a significantly higher growth trajectory due to increasing LNG imports and government support for infrastructure development. The Transportation segment will witness steady growth driven by increased gas production and consumption, but may face pressures from the adoption of alternative transportation options and the growth of other segments.
Key Drivers of Oil and Gas Midstream Industry in Vietnam Growth
Several factors drive the growth of Vietnam's oil and gas midstream industry. These include rising energy demand from a growing economy and expanding industrial sector, government initiatives promoting energy security and infrastructure development (such as the investment in LNG infrastructure), and increasing investment in the sector from both domestic and foreign companies. Technological advancements, particularly in pipeline technologies and LNG terminal management, are also contributing to growth and efficiency.
Challenges in the Oil and Gas Midstream Industry in Vietnam Sector
The sector faces challenges, including regulatory uncertainties and infrastructure limitations, which may impact the timely completion of projects. The competition for investment capital, especially against renewable energy projects, represents another major hurdle. Supply chain disruptions, both domestically and globally, may also influence costs and timelines. Precise quantifiable impacts on various parameters due to these challenges are not readily available at the moment.
Emerging Opportunities in Oil and Gas Midstream Industry in Vietnam
Emerging opportunities exist in the expansion of LNG infrastructure, particularly the development of new terminals and pipelines. The growth of renewable energy integration is likely to open opportunities for hydrogen storage and transport. Furthermore, the adoption of advanced technologies, such as digital twins and AI-powered optimization tools, presents promising avenues for improving operational efficiency and reducing costs.
Leading Players in the Oil and Gas Midstream Industry in Vietnam Market
- PJSC Rosneft Oil Company
- Vietnam National Petroleum Group
- Perenco SA
- Vietnam Oil and Gas Group
- Vietsovpetro
Key Developments in Oil and Gas Midstream Industry in Vietnam Industry
- December 2021: Energy Capital Vietnam (ECV), B.Grimm Power, and Siemens Energy form a consortium to develop an LNG-to-power project in Mui Ke Ga, with a USD 200 Million investment planned.
- August 2020: McDermott International Ltd secures a contract from Delta Offshore Energy for FEED services for a subsea gas pipeline connecting an offshore platform to a power plant in Bac Lieu Province.
Future Outlook for Oil and Gas Midstream Industry in Vietnam Market
Vietnam's oil and gas midstream sector holds significant potential for future growth, driven by continued economic expansion and government support for infrastructure development. Strategic opportunities exist for companies that can leverage technological advancements to enhance efficiency, safety, and environmental sustainability. The increasing demand for natural gas, alongside government initiatives, indicates strong growth prospects in the coming decade, with additional investment expected to further strengthen the industry.
Oil and Gas Midstream Industry in Vietnam Segmentation
-
1. Transportation
-
1.1. Overview
- 1.1.1. Existing Infrastructure
- 1.1.2. Projects in Pipeline
- 1.1.3. Upcoming Projects
-
1.1. Overview
-
2. Storage
-
2.1. Overview
- 2.1.1. Existing Infrastructure
- 2.1.2. Projects in Pipeline
- 2.1.3. Upcoming Projects
-
2.1. Overview
-
3. LNG Terminals
-
3.1. Overview
- 3.1.1. Existing Infrastructure
- 3.1.2. Projects in Pipeline
- 3.1.3. Upcoming Projects
-
3.1. Overview
Oil and Gas Midstream Industry in Vietnam Segmentation By Geography
-
1. North America
- 1.1. United States
- 1.2. Canada
- 1.3. Mexico
-
2. South America
- 2.1. Brazil
- 2.2. Argentina
- 2.3. Rest of South America
-
3. Europe
- 3.1. United Kingdom
- 3.2. Germany
- 3.3. France
- 3.4. Italy
- 3.5. Spain
- 3.6. Russia
- 3.7. Benelux
- 3.8. Nordics
- 3.9. Rest of Europe
-
4. Middle East & Africa
- 4.1. Turkey
- 4.2. Israel
- 4.3. GCC
- 4.4. North Africa
- 4.5. South Africa
- 4.6. Rest of Middle East & Africa
-
5. Asia Pacific
- 5.1. China
- 5.2. India
- 5.3. Japan
- 5.4. South Korea
- 5.5. ASEAN
- 5.6. Oceania
- 5.7. Rest of Asia Pacific
Oil and Gas Midstream Industry in Vietnam REPORT HIGHLIGHTS
| Aspects | Details |
|---|---|
| Study Period | 2019-2033 |
| Base Year | 2024 |
| Estimated Year | 2025 |
| Forecast Period | 2025-2033 |
| Historical Period | 2019-2024 |
| Growth Rate | CAGR of > 5.57% from 2019-2033 |
| Segmentation |
|
Table of Contents
- 1. Introduction
- 1.1. Research Scope
- 1.2. Market Segmentation
- 1.3. Research Methodology
- 1.4. Definitions and Assumptions
- 2. Executive Summary
- 2.1. Introduction
- 3. Market Dynamics
- 3.1. Introduction
- 3.2. Market Drivers
- 3.2.1. 4.; Increasing Investments in Hydropower Generation4.; Favorable Government Policies
- 3.3. Market Restrains
- 3.3.1. 4.; Adoption of Other Alternative Clean Energy Sources
- 3.4. Market Trends
- 3.4.1. Storage Capacity to Witness Significant Growth
- 4. Market Factor Analysis
- 4.1. Porters Five Forces
- 4.2. Supply/Value Chain
- 4.3. PESTEL analysis
- 4.4. Market Entropy
- 4.5. Patent/Trademark Analysis
- 5. Global Oil and Gas Midstream Industry in Vietnam Analysis, Insights and Forecast, 2019-2031
- 5.1. Market Analysis, Insights and Forecast - by Transportation
- 5.1.1. Overview
- 5.1.1.1. Existing Infrastructure
- 5.1.1.2. Projects in Pipeline
- 5.1.1.3. Upcoming Projects
- 5.1.1. Overview
- 5.2. Market Analysis, Insights and Forecast - by Storage
- 5.2.1. Overview
- 5.2.1.1. Existing Infrastructure
- 5.2.1.2. Projects in Pipeline
- 5.2.1.3. Upcoming Projects
- 5.2.1. Overview
- 5.3. Market Analysis, Insights and Forecast - by LNG Terminals
- 5.3.1. Overview
- 5.3.1.1. Existing Infrastructure
- 5.3.1.2. Projects in Pipeline
- 5.3.1.3. Upcoming Projects
- 5.3.1. Overview
- 5.4. Market Analysis, Insights and Forecast - by Region
- 5.4.1. North America
- 5.4.2. South America
- 5.4.3. Europe
- 5.4.4. Middle East & Africa
- 5.4.5. Asia Pacific
- 5.1. Market Analysis, Insights and Forecast - by Transportation
- 6. North America Oil and Gas Midstream Industry in Vietnam Analysis, Insights and Forecast, 2019-2031
- 6.1. Market Analysis, Insights and Forecast - by Transportation
- 6.1.1. Overview
- 6.1.1.1. Existing Infrastructure
- 6.1.1.2. Projects in Pipeline
- 6.1.1.3. Upcoming Projects
- 6.1.1. Overview
- 6.2. Market Analysis, Insights and Forecast - by Storage
- 6.2.1. Overview
- 6.2.1.1. Existing Infrastructure
- 6.2.1.2. Projects in Pipeline
- 6.2.1.3. Upcoming Projects
- 6.2.1. Overview
- 6.3. Market Analysis, Insights and Forecast - by LNG Terminals
- 6.3.1. Overview
- 6.3.1.1. Existing Infrastructure
- 6.3.1.2. Projects in Pipeline
- 6.3.1.3. Upcoming Projects
- 6.3.1. Overview
- 6.1. Market Analysis, Insights and Forecast - by Transportation
- 7. South America Oil and Gas Midstream Industry in Vietnam Analysis, Insights and Forecast, 2019-2031
- 7.1. Market Analysis, Insights and Forecast - by Transportation
- 7.1.1. Overview
- 7.1.1.1. Existing Infrastructure
- 7.1.1.2. Projects in Pipeline
- 7.1.1.3. Upcoming Projects
- 7.1.1. Overview
- 7.2. Market Analysis, Insights and Forecast - by Storage
- 7.2.1. Overview
- 7.2.1.1. Existing Infrastructure
- 7.2.1.2. Projects in Pipeline
- 7.2.1.3. Upcoming Projects
- 7.2.1. Overview
- 7.3. Market Analysis, Insights and Forecast - by LNG Terminals
- 7.3.1. Overview
- 7.3.1.1. Existing Infrastructure
- 7.3.1.2. Projects in Pipeline
- 7.3.1.3. Upcoming Projects
- 7.3.1. Overview
- 7.1. Market Analysis, Insights and Forecast - by Transportation
- 8. Europe Oil and Gas Midstream Industry in Vietnam Analysis, Insights and Forecast, 2019-2031
- 8.1. Market Analysis, Insights and Forecast - by Transportation
- 8.1.1. Overview
- 8.1.1.1. Existing Infrastructure
- 8.1.1.2. Projects in Pipeline
- 8.1.1.3. Upcoming Projects
- 8.1.1. Overview
- 8.2. Market Analysis, Insights and Forecast - by Storage
- 8.2.1. Overview
- 8.2.1.1. Existing Infrastructure
- 8.2.1.2. Projects in Pipeline
- 8.2.1.3. Upcoming Projects
- 8.2.1. Overview
- 8.3. Market Analysis, Insights and Forecast - by LNG Terminals
- 8.3.1. Overview
- 8.3.1.1. Existing Infrastructure
- 8.3.1.2. Projects in Pipeline
- 8.3.1.3. Upcoming Projects
- 8.3.1. Overview
- 8.1. Market Analysis, Insights and Forecast - by Transportation
- 9. Middle East & Africa Oil and Gas Midstream Industry in Vietnam Analysis, Insights and Forecast, 2019-2031
- 9.1. Market Analysis, Insights and Forecast - by Transportation
- 9.1.1. Overview
- 9.1.1.1. Existing Infrastructure
- 9.1.1.2. Projects in Pipeline
- 9.1.1.3. Upcoming Projects
- 9.1.1. Overview
- 9.2. Market Analysis, Insights and Forecast - by Storage
- 9.2.1. Overview
- 9.2.1.1. Existing Infrastructure
- 9.2.1.2. Projects in Pipeline
- 9.2.1.3. Upcoming Projects
- 9.2.1. Overview
- 9.3. Market Analysis, Insights and Forecast - by LNG Terminals
- 9.3.1. Overview
- 9.3.1.1. Existing Infrastructure
- 9.3.1.2. Projects in Pipeline
- 9.3.1.3. Upcoming Projects
- 9.3.1. Overview
- 9.1. Market Analysis, Insights and Forecast - by Transportation
- 10. Asia Pacific Oil and Gas Midstream Industry in Vietnam Analysis, Insights and Forecast, 2019-2031
- 10.1. Market Analysis, Insights and Forecast - by Transportation
- 10.1.1. Overview
- 10.1.1.1. Existing Infrastructure
- 10.1.1.2. Projects in Pipeline
- 10.1.1.3. Upcoming Projects
- 10.1.1. Overview
- 10.2. Market Analysis, Insights and Forecast - by Storage
- 10.2.1. Overview
- 10.2.1.1. Existing Infrastructure
- 10.2.1.2. Projects in Pipeline
- 10.2.1.3. Upcoming Projects
- 10.2.1. Overview
- 10.3. Market Analysis, Insights and Forecast - by LNG Terminals
- 10.3.1. Overview
- 10.3.1.1. Existing Infrastructure
- 10.3.1.2. Projects in Pipeline
- 10.3.1.3. Upcoming Projects
- 10.3.1. Overview
- 10.1. Market Analysis, Insights and Forecast - by Transportation
- 11. Competitive Analysis
- 11.1. Global Market Share Analysis 2024
- 11.2. Company Profiles
- 11.2.1 PJSC Rosneft Oil Company
- 11.2.1.1. Overview
- 11.2.1.2. Products
- 11.2.1.3. SWOT Analysis
- 11.2.1.4. Recent Developments
- 11.2.1.5. Financials (Based on Availability)
- 11.2.2 Vietnam National Petroleum Group
- 11.2.2.1. Overview
- 11.2.2.2. Products
- 11.2.2.3. SWOT Analysis
- 11.2.2.4. Recent Developments
- 11.2.2.5. Financials (Based on Availability)
- 11.2.3 Perenco SA*List Not Exhaustive
- 11.2.3.1. Overview
- 11.2.3.2. Products
- 11.2.3.3. SWOT Analysis
- 11.2.3.4. Recent Developments
- 11.2.3.5. Financials (Based on Availability)
- 11.2.4 Vietnam Oil and Gas Group
- 11.2.4.1. Overview
- 11.2.4.2. Products
- 11.2.4.3. SWOT Analysis
- 11.2.4.4. Recent Developments
- 11.2.4.5. Financials (Based on Availability)
- 11.2.5 Vietsovpetro
- 11.2.5.1. Overview
- 11.2.5.2. Products
- 11.2.5.3. SWOT Analysis
- 11.2.5.4. Recent Developments
- 11.2.5.5. Financials (Based on Availability)
- 11.2.1 PJSC Rosneft Oil Company
List of Figures
- Figure 1: Global Oil and Gas Midstream Industry in Vietnam Revenue Breakdown (Million, %) by Region 2024 & 2032
- Figure 2: Vietnam Oil and Gas Midstream Industry in Vietnam Revenue (Million), by Country 2024 & 2032
- Figure 3: Vietnam Oil and Gas Midstream Industry in Vietnam Revenue Share (%), by Country 2024 & 2032
- Figure 4: North America Oil and Gas Midstream Industry in Vietnam Revenue (Million), by Transportation 2024 & 2032
- Figure 5: North America Oil and Gas Midstream Industry in Vietnam Revenue Share (%), by Transportation 2024 & 2032
- Figure 6: North America Oil and Gas Midstream Industry in Vietnam Revenue (Million), by Storage 2024 & 2032
- Figure 7: North America Oil and Gas Midstream Industry in Vietnam Revenue Share (%), by Storage 2024 & 2032
- Figure 8: North America Oil and Gas Midstream Industry in Vietnam Revenue (Million), by LNG Terminals 2024 & 2032
- Figure 9: North America Oil and Gas Midstream Industry in Vietnam Revenue Share (%), by LNG Terminals 2024 & 2032
- Figure 10: North America Oil and Gas Midstream Industry in Vietnam Revenue (Million), by Country 2024 & 2032
- Figure 11: North America Oil and Gas Midstream Industry in Vietnam Revenue Share (%), by Country 2024 & 2032
- Figure 12: South America Oil and Gas Midstream Industry in Vietnam Revenue (Million), by Transportation 2024 & 2032
- Figure 13: South America Oil and Gas Midstream Industry in Vietnam Revenue Share (%), by Transportation 2024 & 2032
- Figure 14: South America Oil and Gas Midstream Industry in Vietnam Revenue (Million), by Storage 2024 & 2032
- Figure 15: South America Oil and Gas Midstream Industry in Vietnam Revenue Share (%), by Storage 2024 & 2032
- Figure 16: South America Oil and Gas Midstream Industry in Vietnam Revenue (Million), by LNG Terminals 2024 & 2032
- Figure 17: South America Oil and Gas Midstream Industry in Vietnam Revenue Share (%), by LNG Terminals 2024 & 2032
- Figure 18: South America Oil and Gas Midstream Industry in Vietnam Revenue (Million), by Country 2024 & 2032
- Figure 19: South America Oil and Gas Midstream Industry in Vietnam Revenue Share (%), by Country 2024 & 2032
- Figure 20: Europe Oil and Gas Midstream Industry in Vietnam Revenue (Million), by Transportation 2024 & 2032
- Figure 21: Europe Oil and Gas Midstream Industry in Vietnam Revenue Share (%), by Transportation 2024 & 2032
- Figure 22: Europe Oil and Gas Midstream Industry in Vietnam Revenue (Million), by Storage 2024 & 2032
- Figure 23: Europe Oil and Gas Midstream Industry in Vietnam Revenue Share (%), by Storage 2024 & 2032
- Figure 24: Europe Oil and Gas Midstream Industry in Vietnam Revenue (Million), by LNG Terminals 2024 & 2032
- Figure 25: Europe Oil and Gas Midstream Industry in Vietnam Revenue Share (%), by LNG Terminals 2024 & 2032
- Figure 26: Europe Oil and Gas Midstream Industry in Vietnam Revenue (Million), by Country 2024 & 2032
- Figure 27: Europe Oil and Gas Midstream Industry in Vietnam Revenue Share (%), by Country 2024 & 2032
- Figure 28: Middle East & Africa Oil and Gas Midstream Industry in Vietnam Revenue (Million), by Transportation 2024 & 2032
- Figure 29: Middle East & Africa Oil and Gas Midstream Industry in Vietnam Revenue Share (%), by Transportation 2024 & 2032
- Figure 30: Middle East & Africa Oil and Gas Midstream Industry in Vietnam Revenue (Million), by Storage 2024 & 2032
- Figure 31: Middle East & Africa Oil and Gas Midstream Industry in Vietnam Revenue Share (%), by Storage 2024 & 2032
- Figure 32: Middle East & Africa Oil and Gas Midstream Industry in Vietnam Revenue (Million), by LNG Terminals 2024 & 2032
- Figure 33: Middle East & Africa Oil and Gas Midstream Industry in Vietnam Revenue Share (%), by LNG Terminals 2024 & 2032
- Figure 34: Middle East & Africa Oil and Gas Midstream Industry in Vietnam Revenue (Million), by Country 2024 & 2032
- Figure 35: Middle East & Africa Oil and Gas Midstream Industry in Vietnam Revenue Share (%), by Country 2024 & 2032
- Figure 36: Asia Pacific Oil and Gas Midstream Industry in Vietnam Revenue (Million), by Transportation 2024 & 2032
- Figure 37: Asia Pacific Oil and Gas Midstream Industry in Vietnam Revenue Share (%), by Transportation 2024 & 2032
- Figure 38: Asia Pacific Oil and Gas Midstream Industry in Vietnam Revenue (Million), by Storage 2024 & 2032
- Figure 39: Asia Pacific Oil and Gas Midstream Industry in Vietnam Revenue Share (%), by Storage 2024 & 2032
- Figure 40: Asia Pacific Oil and Gas Midstream Industry in Vietnam Revenue (Million), by LNG Terminals 2024 & 2032
- Figure 41: Asia Pacific Oil and Gas Midstream Industry in Vietnam Revenue Share (%), by LNG Terminals 2024 & 2032
- Figure 42: Asia Pacific Oil and Gas Midstream Industry in Vietnam Revenue (Million), by Country 2024 & 2032
- Figure 43: Asia Pacific Oil and Gas Midstream Industry in Vietnam Revenue Share (%), by Country 2024 & 2032
List of Tables
- Table 1: Global Oil and Gas Midstream Industry in Vietnam Revenue Million Forecast, by Region 2019 & 2032
- Table 2: Global Oil and Gas Midstream Industry in Vietnam Revenue Million Forecast, by Transportation 2019 & 2032
- Table 3: Global Oil and Gas Midstream Industry in Vietnam Revenue Million Forecast, by Storage 2019 & 2032
- Table 4: Global Oil and Gas Midstream Industry in Vietnam Revenue Million Forecast, by LNG Terminals 2019 & 2032
- Table 5: Global Oil and Gas Midstream Industry in Vietnam Revenue Million Forecast, by Region 2019 & 2032
- Table 6: Global Oil and Gas Midstream Industry in Vietnam Revenue Million Forecast, by Country 2019 & 2032
- Table 7: Global Oil and Gas Midstream Industry in Vietnam Revenue Million Forecast, by Transportation 2019 & 2032
- Table 8: Global Oil and Gas Midstream Industry in Vietnam Revenue Million Forecast, by Storage 2019 & 2032
- Table 9: Global Oil and Gas Midstream Industry in Vietnam Revenue Million Forecast, by LNG Terminals 2019 & 2032
- Table 10: Global Oil and Gas Midstream Industry in Vietnam Revenue Million Forecast, by Country 2019 & 2032
- Table 11: United States Oil and Gas Midstream Industry in Vietnam Revenue (Million) Forecast, by Application 2019 & 2032
- Table 12: Canada Oil and Gas Midstream Industry in Vietnam Revenue (Million) Forecast, by Application 2019 & 2032
- Table 13: Mexico Oil and Gas Midstream Industry in Vietnam Revenue (Million) Forecast, by Application 2019 & 2032
- Table 14: Global Oil and Gas Midstream Industry in Vietnam Revenue Million Forecast, by Transportation 2019 & 2032
- Table 15: Global Oil and Gas Midstream Industry in Vietnam Revenue Million Forecast, by Storage 2019 & 2032
- Table 16: Global Oil and Gas Midstream Industry in Vietnam Revenue Million Forecast, by LNG Terminals 2019 & 2032
- Table 17: Global Oil and Gas Midstream Industry in Vietnam Revenue Million Forecast, by Country 2019 & 2032
- Table 18: Brazil Oil and Gas Midstream Industry in Vietnam Revenue (Million) Forecast, by Application 2019 & 2032
- Table 19: Argentina Oil and Gas Midstream Industry in Vietnam Revenue (Million) Forecast, by Application 2019 & 2032
- Table 20: Rest of South America Oil and Gas Midstream Industry in Vietnam Revenue (Million) Forecast, by Application 2019 & 2032
- Table 21: Global Oil and Gas Midstream Industry in Vietnam Revenue Million Forecast, by Transportation 2019 & 2032
- Table 22: Global Oil and Gas Midstream Industry in Vietnam Revenue Million Forecast, by Storage 2019 & 2032
- Table 23: Global Oil and Gas Midstream Industry in Vietnam Revenue Million Forecast, by LNG Terminals 2019 & 2032
- Table 24: Global Oil and Gas Midstream Industry in Vietnam Revenue Million Forecast, by Country 2019 & 2032
- Table 25: United Kingdom Oil and Gas Midstream Industry in Vietnam Revenue (Million) Forecast, by Application 2019 & 2032
- Table 26: Germany Oil and Gas Midstream Industry in Vietnam Revenue (Million) Forecast, by Application 2019 & 2032
- Table 27: France Oil and Gas Midstream Industry in Vietnam Revenue (Million) Forecast, by Application 2019 & 2032
- Table 28: Italy Oil and Gas Midstream Industry in Vietnam Revenue (Million) Forecast, by Application 2019 & 2032
- Table 29: Spain Oil and Gas Midstream Industry in Vietnam Revenue (Million) Forecast, by Application 2019 & 2032
- Table 30: Russia Oil and Gas Midstream Industry in Vietnam Revenue (Million) Forecast, by Application 2019 & 2032
- Table 31: Benelux Oil and Gas Midstream Industry in Vietnam Revenue (Million) Forecast, by Application 2019 & 2032
- Table 32: Nordics Oil and Gas Midstream Industry in Vietnam Revenue (Million) Forecast, by Application 2019 & 2032
- Table 33: Rest of Europe Oil and Gas Midstream Industry in Vietnam Revenue (Million) Forecast, by Application 2019 & 2032
- Table 34: Global Oil and Gas Midstream Industry in Vietnam Revenue Million Forecast, by Transportation 2019 & 2032
- Table 35: Global Oil and Gas Midstream Industry in Vietnam Revenue Million Forecast, by Storage 2019 & 2032
- Table 36: Global Oil and Gas Midstream Industry in Vietnam Revenue Million Forecast, by LNG Terminals 2019 & 2032
- Table 37: Global Oil and Gas Midstream Industry in Vietnam Revenue Million Forecast, by Country 2019 & 2032
- Table 38: Turkey Oil and Gas Midstream Industry in Vietnam Revenue (Million) Forecast, by Application 2019 & 2032
- Table 39: Israel Oil and Gas Midstream Industry in Vietnam Revenue (Million) Forecast, by Application 2019 & 2032
- Table 40: GCC Oil and Gas Midstream Industry in Vietnam Revenue (Million) Forecast, by Application 2019 & 2032
- Table 41: North Africa Oil and Gas Midstream Industry in Vietnam Revenue (Million) Forecast, by Application 2019 & 2032
- Table 42: South Africa Oil and Gas Midstream Industry in Vietnam Revenue (Million) Forecast, by Application 2019 & 2032
- Table 43: Rest of Middle East & Africa Oil and Gas Midstream Industry in Vietnam Revenue (Million) Forecast, by Application 2019 & 2032
- Table 44: Global Oil and Gas Midstream Industry in Vietnam Revenue Million Forecast, by Transportation 2019 & 2032
- Table 45: Global Oil and Gas Midstream Industry in Vietnam Revenue Million Forecast, by Storage 2019 & 2032
- Table 46: Global Oil and Gas Midstream Industry in Vietnam Revenue Million Forecast, by LNG Terminals 2019 & 2032
- Table 47: Global Oil and Gas Midstream Industry in Vietnam Revenue Million Forecast, by Country 2019 & 2032
- Table 48: China Oil and Gas Midstream Industry in Vietnam Revenue (Million) Forecast, by Application 2019 & 2032
- Table 49: India Oil and Gas Midstream Industry in Vietnam Revenue (Million) Forecast, by Application 2019 & 2032
- Table 50: Japan Oil and Gas Midstream Industry in Vietnam Revenue (Million) Forecast, by Application 2019 & 2032
- Table 51: South Korea Oil and Gas Midstream Industry in Vietnam Revenue (Million) Forecast, by Application 2019 & 2032
- Table 52: ASEAN Oil and Gas Midstream Industry in Vietnam Revenue (Million) Forecast, by Application 2019 & 2032
- Table 53: Oceania Oil and Gas Midstream Industry in Vietnam Revenue (Million) Forecast, by Application 2019 & 2032
- Table 54: Rest of Asia Pacific Oil and Gas Midstream Industry in Vietnam Revenue (Million) Forecast, by Application 2019 & 2032
Frequently Asked Questions
1. What is the projected Compound Annual Growth Rate (CAGR) of the Oil and Gas Midstream Industry in Vietnam?
The projected CAGR is approximately > 5.57%.
2. Which companies are prominent players in the Oil and Gas Midstream Industry in Vietnam?
Key companies in the market include PJSC Rosneft Oil Company, Vietnam National Petroleum Group, Perenco SA*List Not Exhaustive, Vietnam Oil and Gas Group, Vietsovpetro.
3. What are the main segments of the Oil and Gas Midstream Industry in Vietnam?
The market segments include Transportation, Storage, LNG Terminals.
4. Can you provide details about the market size?
The market size is estimated to be USD XX Million as of 2022.
5. What are some drivers contributing to market growth?
4.; Increasing Investments in Hydropower Generation4.; Favorable Government Policies.
6. What are the notable trends driving market growth?
Storage Capacity to Witness Significant Growth.
7. Are there any restraints impacting market growth?
4.; Adoption of Other Alternative Clean Energy Sources.
8. Can you provide examples of recent developments in the market?
In December 2021, Energy Capital Vietnam (ECV) announced that B.Grimm Power of Thailand and Siemens Energy joined its consortium to develop an LNG-to-power project in Mui Ke Ga (MKG), Binh Thuan Province, in Southern Vietnam. B.Grimm Power plans to invest approximately USD 200 million in equity at the financial close of the project.
9. What pricing options are available for accessing the report?
Pricing options include single-user, multi-user, and enterprise licenses priced at USD 3800, USD 4500, and USD 5800 respectively.
10. Is the market size provided in terms of value or volume?
The market size is provided in terms of value, measured in Million.
11. Are there any specific market keywords associated with the report?
Yes, the market keyword associated with the report is "Oil and Gas Midstream Industry in Vietnam," which aids in identifying and referencing the specific market segment covered.
12. How do I determine which pricing option suits my needs best?
The pricing options vary based on user requirements and access needs. Individual users may opt for single-user licenses, while businesses requiring broader access may choose multi-user or enterprise licenses for cost-effective access to the report.
13. Are there any additional resources or data provided in the Oil and Gas Midstream Industry in Vietnam report?
While the report offers comprehensive insights, it's advisable to review the specific contents or supplementary materials provided to ascertain if additional resources or data are available.
14. How can I stay updated on further developments or reports in the Oil and Gas Midstream Industry in Vietnam?
To stay informed about further developments, trends, and reports in the Oil and Gas Midstream Industry in Vietnam, consider subscribing to industry newsletters, following relevant companies and organizations, or regularly checking reputable industry news sources and publications.
Methodology
Step 1 - Identification of Relevant Samples Size from Population Database


Step 2 - Approaches for Defining Global Market Size (Value, Volume* & Price*)

Note*: In applicable scenarios
Step 3 - Data Sources
Primary Research
- Web Analytics
- Survey Reports
- Research Institute
- Latest Research Reports
- Opinion Leaders
Secondary Research
- Annual Reports
- White Paper
- Latest Press Release
- Industry Association
- Paid Database
- Investor Presentations

Step 4 - Data Triangulation
Involves using different sources of information in order to increase the validity of a study
These sources are likely to be stakeholders in a program - participants, other researchers, program staff, other community members, and so on.
Then we put all data in single framework & apply various statistical tools to find out the dynamic on the market.
During the analysis stage, feedback from the stakeholder groups would be compared to determine areas of agreement as well as areas of divergence


