
Key Insights
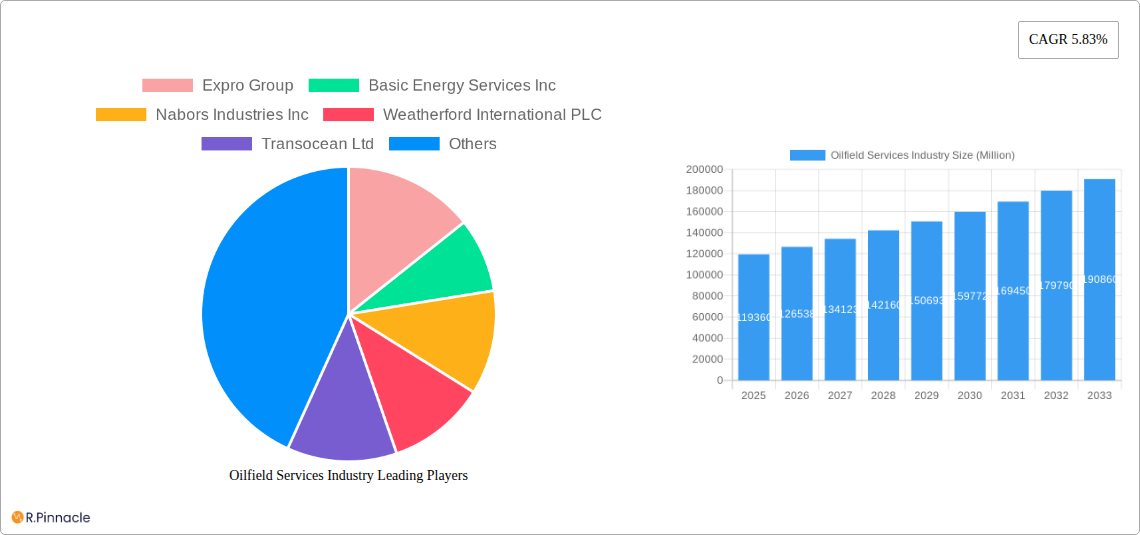
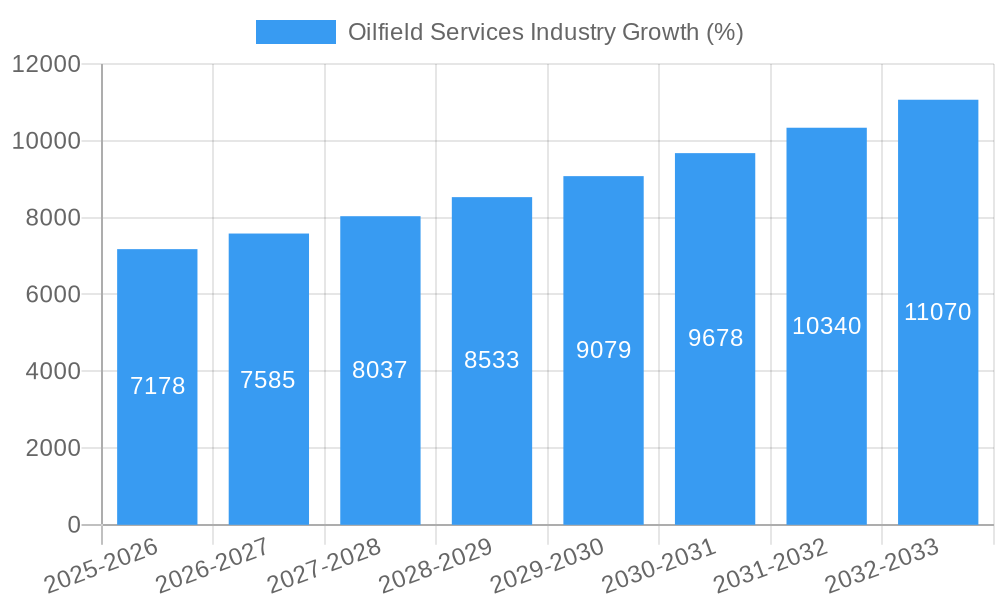
The global oilfield services market, valued at $119.36 billion in 2025, is projected to experience robust growth, driven by increasing global energy demand and ongoing investments in upstream oil and gas exploration and production activities. The Compound Annual Growth Rate (CAGR) of 5.83% from 2025 to 2033 indicates a significant expansion of the market, with substantial opportunities across various service types and geographical locations. Key drivers include technological advancements enhancing efficiency and reducing operational costs, the growing adoption of digitalization and automation in oilfield operations, and the ongoing exploration and development of unconventional resources like shale gas and oil sands. While regulatory changes and fluctuating oil prices pose challenges, the long-term outlook remains positive, particularly in regions with significant reserves and ongoing investments in infrastructure development. The market segmentation shows strong growth across all service types, with drilling services, completion services, and production & intervention services being major contributors. Onshore operations currently dominate, but offshore activity is also expected to increase, driven by deepwater exploration projects and technological advancements in offshore drilling and production techniques. Major players like Schlumberger, Halliburton, and Baker Hughes continue to lead the market through technological innovation and strategic partnerships, while regional differences in growth rates reflect variations in exploration and production activity, regulatory frameworks, and economic conditions.
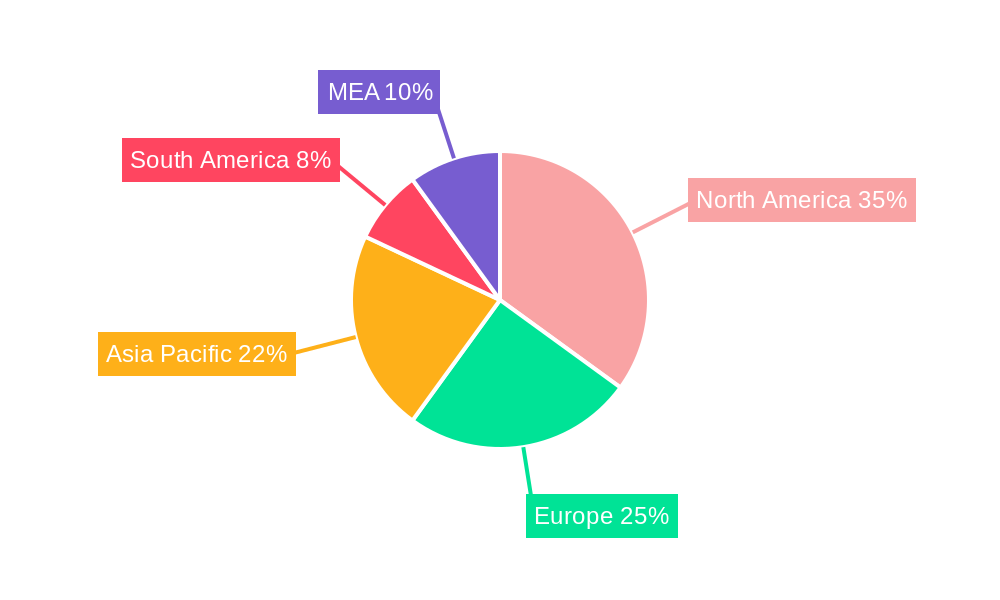
The geographical distribution of market share indicates significant opportunities across North America, Europe, and the Asia-Pacific region, driven by robust energy demand and considerable investments in oil and gas exploration and production. North America's established oil and gas industry and presence of major service providers contribute to a substantial market share. The Asia-Pacific region, particularly China and India, showcases significant growth potential due to rapidly increasing energy consumption and ongoing infrastructure development. Europe, while facing challenges related to energy transition policies, is expected to maintain a steady market share driven by existing offshore and onshore operations, particularly in the North Sea. The Middle East and Africa (MEA) region, rich in oil and gas reserves, will also witness significant market expansion due to extensive ongoing and planned projects, especially in Saudi Arabia and the UAE. South America, with significant oil reserves, especially in Brazil, will experience moderate growth, influenced by economic conditions and government policies. Competitive dynamics are shaped by the integration of technology, strategic mergers and acquisitions, and the ongoing expansion of service offerings by major players, leading to a dynamic and constantly evolving market landscape.
Oilfield Services Industry Report: 2019-2033 Forecast
This comprehensive report provides an in-depth analysis of the Oilfield Services Industry, offering invaluable insights for industry professionals, investors, and strategic decision-makers. With a study period spanning 2019-2033, a base year of 2025, and a forecast period of 2025-2033, this report leverages historical data (2019-2024) to project future market trends and opportunities. The report covers key players including Expro Group, Basic Energy Services Inc, Nabors Industries Inc, Weatherford International PLC, Transocean Ltd, Baker Hughes Company, China Oilfield Services Limited, Halliburton Company, OiLSERV, Schlumberger Limited, and Valaris PLC, analyzing market dynamics across various segments and geographical locations. Expect detailed analysis of market size (in Millions), CAGR, and market share.
Oilfield Services Industry Market Structure & Innovation Trends
This section analyzes the competitive landscape of the oilfield services market, focusing on market concentration, innovation drivers, regulatory influences, and M&A activity. The market is characterized by a few dominant players and a significant number of smaller niche players. The top 10 companies hold approximately xx% of the market share in 2025, with Schlumberger and Halliburton leading the pack. Innovation is driven by the need for improved efficiency, reduced environmental impact, and technological advancements in areas like AI and digitalization.
- Market Concentration: Highly concentrated with a few major players controlling a significant market share.
- Innovation Drivers: Increased efficiency demands, environmental regulations, technological advancements (AI, digitalization).
- Regulatory Frameworks: Vary widely across regions impacting operational costs and investment decisions.
- Product Substitutes: Limited direct substitutes, competition primarily from other service providers.
- End-User Demographics: Primarily upstream oil and gas companies, with increasing demand from renewable energy sectors.
- M&A Activity: Significant M&A activity observed in the historical period with deal values exceeding $xx Million in total. The trend is expected to continue with a focus on acquiring specialized technologies and expanding geographic reach.
Oilfield Services Industry Market Dynamics & Trends
The oilfield services market is experiencing dynamic growth driven by several factors including fluctuating oil prices, increasing demand for oil and gas, and ongoing technological advancements. The market is expected to register a CAGR of xx% during the forecast period. Technological disruptions, particularly in areas like automation and data analytics, are changing operational efficiency and safety parameters across the industry. Consumer preferences are shifting towards more sustainable and environmentally friendly solutions.
Significant market growth is projected in offshore operations, driven by increasing exploration and production activities in deepwater areas. Market penetration of digital technologies is increasing with greater acceptance of remote monitoring and digital twin approaches. Competitive dynamics are characterized by ongoing technological innovation, strategic partnerships, and mergers and acquisitions.
Dominant Regions & Segments in Oilfield Services Industry
The oilfield services market is geographically diverse, with significant variations in growth rates and market characteristics across regions. Onshore operations currently dominate the market share, followed by offshore operations. Drilling services constitute the largest segment by service type, followed by completion and production services.
- Leading Regions: North America (US, Canada) and the Middle East are currently the leading regions, followed by Asia-Pacific.
- Key Drivers (North America): Established oil and gas infrastructure, technological advancements, and favorable regulatory environments.
- Key Drivers (Middle East): Large oil and gas reserves, significant investments in exploration and production, and government support.
- Leading Segments:
- Drilling Services: High demand driven by exploration and production activities, especially in unconventional resources.
- Completion Services: Strong growth prospects due to increasing adoption of advanced completion techniques.
- Production and Intervention Services: High demand due to aging infrastructure and the need for improved production efficiency.
- Other Services: This segment includes specialized services like well testing, and environmental remediation which are experiencing moderate growth.
- Offshore: The Offshore segment is expected to witness significant growth due to exploration and production of deepwater reserves.
- Onshore: Onshore segment currently holds largest market share driven by readily accessible land and existing infrastructure.
Oilfield Services Industry Product Innovations
Recent product innovations focus on enhancing efficiency, safety, and environmental performance. These innovations include automated drilling systems, advanced completion techniques, and digital solutions for remote monitoring and data analysis. The integration of AI and machine learning is transforming various aspects of oilfield operations, leading to improved decision-making and optimized resource allocation. The market fit for these innovations is strong, driven by industry needs for cost reduction and improved operational efficiency.
Report Scope & Segmentation Analysis
This report segments the oilfield services market by service type (Drilling Services, Completion Services, Production and Intervention Services, Other Services) and location of deployment (Onshore, Offshore). Each segment is analyzed with respect to market size (in Millions), growth projections (CAGR), and competitive dynamics.
- Drilling Services: The drilling segment is projected to maintain steady growth, driven by increased exploration activities, particularly in unconventional oil and gas.
- Completion Services: Growth in this segment is expected due to technological advancements like hydraulic fracturing, making it crucial for maximizing reservoir potential.
- Production and Intervention Services: Significant market growth is predicted for this segment due to increasing need for enhanced oil recovery and well maintenance.
- Other Services: This segment showcases moderate growth opportunities driven by increasing demand for specialized services.
- Onshore: The Onshore segment will likely continue to dominate owing to relatively lower setup and operational costs.
- Offshore: Offshore segment has a high growth trajectory due to exploration of deepwater reserves, albeit higher initial investments.
Key Drivers of Oilfield Services Industry Growth
Several factors drive the growth of the oilfield services industry. These include increasing global energy demand, technological advancements leading to improved efficiency and cost reduction, investments in exploration and production activities, particularly in unconventional resources. Government policies promoting energy independence and supportive regulatory frameworks in some regions also play a key role.
Challenges in the Oilfield Services Industry Sector
The oilfield services industry faces several challenges, including fluctuating oil prices impacting demand and profitability, stringent environmental regulations increasing operational costs, and intense competition leading to pricing pressures. Supply chain disruptions can also impact the availability of crucial equipment and materials, leading to project delays and increased costs. The impact of these factors on the industry's profitability is significant, potentially resulting in reduced investment and decreased growth rates.
Emerging Opportunities in Oilfield Services Industry
Emerging opportunities exist in the development and application of digital technologies such as AI and machine learning for optimizing operations, in exploration and production of unconventional resources (e.g., shale gas), and in the growing renewable energy sector, particularly in areas such as geothermal and hydrogen production. These areas offer significant growth potential for oilfield service providers willing to adapt and innovate.
Leading Players in the Oilfield Services Industry Market
- Expro Group
- Basic Energy Services Inc
- Nabors Industries Inc
- Weatherford International PLC
- Transocean Ltd
- Baker Hughes Company
- China Oilfield Services Limited
- Halliburton Company
- OiLSERV
- Schlumberger Limited
- Valaris PLC
Key Developments in Oilfield Services Industry
September 2023: SLB signed a subsurface technology agreement with INEOS Energy, focusing on AI-driven operational performance improvements for continued growth, new acquisitions, and CCS. This signifies a shift towards technologically advanced solutions and sustainable practices within the industry.
April 2023: QatarEnergy and Shell PLC agreed to explore the C-10 block offshore Mauritania, highlighting continued investment in offshore exploration and production. This development represents expansion of exploration activities in new and potentially lucrative areas.
Future Outlook for Oilfield Services Industry Market
The future of the oilfield services market is promising, driven by sustained demand for oil and gas, technological advancements, and strategic investments in exploration and production. Despite challenges like environmental regulations and price volatility, the industry is poised for growth, particularly in segments focused on efficiency improvements, digitalization, and sustainable practices. Companies that embrace innovation and adapt to changing market dynamics are best positioned to capture significant opportunities.
Oilfield Services Industry Segmentation
-
1. Service Type
- 1.1. Drilling Services
- 1.2. Completion Services
- 1.3. Production and Intervention Services
- 1.4. Other Services
-
2. Location of Deployment
- 2.1. Onshore
- 2.2. Offshore
Oilfield Services Industry Segmentation By Geography
-
1. North America
- 1.1. United States
- 1.2. Canada
- 1.3. Rest of North America
-
2. Europe
- 2.1. Germany
- 2.2. France
- 2.3. United Kingdom
- 2.4. Italy
- 2.5. Russia
- 2.6. Spain
- 2.7. NORDIC
- 2.8. Turkey
- 2.9. Rest of Europe
-
3. Asia Pacific
- 3.1. China
- 3.2. India
- 3.3. Japan
- 3.4. South Korea
- 3.5. Malaysia
- 3.6. Thailand
- 3.7. Vietnam
- 3.8. Rest of Asia Pacific
-
4. South America
- 4.1. Brazil
- 4.2. Argentina
- 4.3. Colombia
- 4.4. Rest of South America
-
5. Middle East and Africa
- 5.1. Saudi Arabia
- 5.2. United Arab Emirates
- 5.3. South Africa
- 5.4. Nigeria
- 5.5. Qatar
- 5.6. Egypt
- 5.7. Rest of the Middle East and Africa
Oilfield Services Industry REPORT HIGHLIGHTS
| Aspects | Details |
|---|---|
| Study Period | 2019-2033 |
| Base Year | 2024 |
| Estimated Year | 2025 |
| Forecast Period | 2025-2033 |
| Historical Period | 2019-2024 |
| Growth Rate | CAGR of 5.83% from 2019-2033 |
| Segmentation |
|
Table of Contents
- 1. Introduction
- 1.1. Research Scope
- 1.2. Market Segmentation
- 1.3. Research Methodology
- 1.4. Definitions and Assumptions
- 2. Executive Summary
- 2.1. Introduction
- 3. Market Dynamics
- 3.1. Introduction
- 3.2. Market Drivers
- 3.2.1 4.; Increasing Development of Gas Reserves and Advanced Technology
- 3.2.2 Tools
- 3.2.3 and Equipment4.; Increasing Investment in the Oilfield Services across World
- 3.3. Market Restrains
- 3.3.1 4.; The Volatile Oil Prices Over the Recent Period
- 3.3.2 Owing to the Supply-Demand Gap
- 3.4. Market Trends
- 3.4.1. Drilling Services Are Expected to Dominate the Market
- 4. Market Factor Analysis
- 4.1. Porters Five Forces
- 4.2. Supply/Value Chain
- 4.3. PESTEL analysis
- 4.4. Market Entropy
- 4.5. Patent/Trademark Analysis
- 5. Global Oilfield Services Industry Analysis, Insights and Forecast, 2019-2031
- 5.1. Market Analysis, Insights and Forecast - by Service Type
- 5.1.1. Drilling Services
- 5.1.2. Completion Services
- 5.1.3. Production and Intervention Services
- 5.1.4. Other Services
- 5.2. Market Analysis, Insights and Forecast - by Location of Deployment
- 5.2.1. Onshore
- 5.2.2. Offshore
- 5.3. Market Analysis, Insights and Forecast - by Region
- 5.3.1. North America
- 5.3.2. Europe
- 5.3.3. Asia Pacific
- 5.3.4. South America
- 5.3.5. Middle East and Africa
- 5.1. Market Analysis, Insights and Forecast - by Service Type
- 6. North America Oilfield Services Industry Analysis, Insights and Forecast, 2019-2031
- 6.1. Market Analysis, Insights and Forecast - by Service Type
- 6.1.1. Drilling Services
- 6.1.2. Completion Services
- 6.1.3. Production and Intervention Services
- 6.1.4. Other Services
- 6.2. Market Analysis, Insights and Forecast - by Location of Deployment
- 6.2.1. Onshore
- 6.2.2. Offshore
- 6.1. Market Analysis, Insights and Forecast - by Service Type
- 7. Europe Oilfield Services Industry Analysis, Insights and Forecast, 2019-2031
- 7.1. Market Analysis, Insights and Forecast - by Service Type
- 7.1.1. Drilling Services
- 7.1.2. Completion Services
- 7.1.3. Production and Intervention Services
- 7.1.4. Other Services
- 7.2. Market Analysis, Insights and Forecast - by Location of Deployment
- 7.2.1. Onshore
- 7.2.2. Offshore
- 7.1. Market Analysis, Insights and Forecast - by Service Type
- 8. Asia Pacific Oilfield Services Industry Analysis, Insights and Forecast, 2019-2031
- 8.1. Market Analysis, Insights and Forecast - by Service Type
- 8.1.1. Drilling Services
- 8.1.2. Completion Services
- 8.1.3. Production and Intervention Services
- 8.1.4. Other Services
- 8.2. Market Analysis, Insights and Forecast - by Location of Deployment
- 8.2.1. Onshore
- 8.2.2. Offshore
- 8.1. Market Analysis, Insights and Forecast - by Service Type
- 9. South America Oilfield Services Industry Analysis, Insights and Forecast, 2019-2031
- 9.1. Market Analysis, Insights and Forecast - by Service Type
- 9.1.1. Drilling Services
- 9.1.2. Completion Services
- 9.1.3. Production and Intervention Services
- 9.1.4. Other Services
- 9.2. Market Analysis, Insights and Forecast - by Location of Deployment
- 9.2.1. Onshore
- 9.2.2. Offshore
- 9.1. Market Analysis, Insights and Forecast - by Service Type
- 10. Middle East and Africa Oilfield Services Industry Analysis, Insights and Forecast, 2019-2031
- 10.1. Market Analysis, Insights and Forecast - by Service Type
- 10.1.1. Drilling Services
- 10.1.2. Completion Services
- 10.1.3. Production and Intervention Services
- 10.1.4. Other Services
- 10.2. Market Analysis, Insights and Forecast - by Location of Deployment
- 10.2.1. Onshore
- 10.2.2. Offshore
- 10.1. Market Analysis, Insights and Forecast - by Service Type
- 11. North America Oilfield Services Industry Analysis, Insights and Forecast, 2019-2031
- 11.1. Market Analysis, Insights and Forecast - By Country/Sub-region
- 11.1.1 United States
- 11.1.2 Canada
- 11.1.3 Mexico
- 12. Europe Oilfield Services Industry Analysis, Insights and Forecast, 2019-2031
- 12.1. Market Analysis, Insights and Forecast - By Country/Sub-region
- 12.1.1 Germany
- 12.1.2 United Kingdom
- 12.1.3 France
- 12.1.4 Spain
- 12.1.5 Italy
- 12.1.6 Spain
- 12.1.7 Belgium
- 12.1.8 Netherland
- 12.1.9 Nordics
- 12.1.10 Rest of Europe
- 13. Asia Pacific Oilfield Services Industry Analysis, Insights and Forecast, 2019-2031
- 13.1. Market Analysis, Insights and Forecast - By Country/Sub-region
- 13.1.1 China
- 13.1.2 Japan
- 13.1.3 India
- 13.1.4 South Korea
- 13.1.5 Southeast Asia
- 13.1.6 Australia
- 13.1.7 Indonesia
- 13.1.8 Phillipes
- 13.1.9 Singapore
- 13.1.10 Thailandc
- 13.1.11 Rest of Asia Pacific
- 14. South America Oilfield Services Industry Analysis, Insights and Forecast, 2019-2031
- 14.1. Market Analysis, Insights and Forecast - By Country/Sub-region
- 14.1.1 Brazil
- 14.1.2 Argentina
- 14.1.3 Peru
- 14.1.4 Chile
- 14.1.5 Colombia
- 14.1.6 Ecuador
- 14.1.7 Venezuela
- 14.1.8 Rest of South America
- 15. MEA Oilfield Services Industry Analysis, Insights and Forecast, 2019-2031
- 15.1. Market Analysis, Insights and Forecast - By Country/Sub-region
- 15.1.1 United Arab Emirates
- 15.1.2 Saudi Arabia
- 15.1.3 South Africa
- 15.1.4 Rest of Middle East and Africa
- 16. Competitive Analysis
- 16.1. Global Market Share Analysis 2024
- 16.2. Company Profiles
- 16.2.1 Expro Group
- 16.2.1.1. Overview
- 16.2.1.2. Products
- 16.2.1.3. SWOT Analysis
- 16.2.1.4. Recent Developments
- 16.2.1.5. Financials (Based on Availability)
- 16.2.2 Basic Energy Services Inc
- 16.2.2.1. Overview
- 16.2.2.2. Products
- 16.2.2.3. SWOT Analysis
- 16.2.2.4. Recent Developments
- 16.2.2.5. Financials (Based on Availability)
- 16.2.3 Nabors Industries Inc
- 16.2.3.1. Overview
- 16.2.3.2. Products
- 16.2.3.3. SWOT Analysis
- 16.2.3.4. Recent Developments
- 16.2.3.5. Financials (Based on Availability)
- 16.2.4 Weatherford International PLC
- 16.2.4.1. Overview
- 16.2.4.2. Products
- 16.2.4.3. SWOT Analysis
- 16.2.4.4. Recent Developments
- 16.2.4.5. Financials (Based on Availability)
- 16.2.5 Transocean Ltd
- 16.2.5.1. Overview
- 16.2.5.2. Products
- 16.2.5.3. SWOT Analysis
- 16.2.5.4. Recent Developments
- 16.2.5.5. Financials (Based on Availability)
- 16.2.6 Baker Hughes Company
- 16.2.6.1. Overview
- 16.2.6.2. Products
- 16.2.6.3. SWOT Analysis
- 16.2.6.4. Recent Developments
- 16.2.6.5. Financials (Based on Availability)
- 16.2.7 China Oilfield Services Limited
- 16.2.7.1. Overview
- 16.2.7.2. Products
- 16.2.7.3. SWOT Analysis
- 16.2.7.4. Recent Developments
- 16.2.7.5. Financials (Based on Availability)
- 16.2.8 Halliburton Company
- 16.2.8.1. Overview
- 16.2.8.2. Products
- 16.2.8.3. SWOT Analysis
- 16.2.8.4. Recent Developments
- 16.2.8.5. Financials (Based on Availability)
- 16.2.9 OiLSERV
- 16.2.9.1. Overview
- 16.2.9.2. Products
- 16.2.9.3. SWOT Analysis
- 16.2.9.4. Recent Developments
- 16.2.9.5. Financials (Based on Availability)
- 16.2.10 Schlumberger Limited
- 16.2.10.1. Overview
- 16.2.10.2. Products
- 16.2.10.3. SWOT Analysis
- 16.2.10.4. Recent Developments
- 16.2.10.5. Financials (Based on Availability)
- 16.2.11 Valaris PLC
- 16.2.11.1. Overview
- 16.2.11.2. Products
- 16.2.11.3. SWOT Analysis
- 16.2.11.4. Recent Developments
- 16.2.11.5. Financials (Based on Availability)
- 16.2.1 Expro Group
List of Figures
- Figure 1: Global Oilfield Services Industry Revenue Breakdown (Million, %) by Region 2024 & 2032
- Figure 2: North America Oilfield Services Industry Revenue (Million), by Country 2024 & 2032
- Figure 3: North America Oilfield Services Industry Revenue Share (%), by Country 2024 & 2032
- Figure 4: Europe Oilfield Services Industry Revenue (Million), by Country 2024 & 2032
- Figure 5: Europe Oilfield Services Industry Revenue Share (%), by Country 2024 & 2032
- Figure 6: Asia Pacific Oilfield Services Industry Revenue (Million), by Country 2024 & 2032
- Figure 7: Asia Pacific Oilfield Services Industry Revenue Share (%), by Country 2024 & 2032
- Figure 8: South America Oilfield Services Industry Revenue (Million), by Country 2024 & 2032
- Figure 9: South America Oilfield Services Industry Revenue Share (%), by Country 2024 & 2032
- Figure 10: MEA Oilfield Services Industry Revenue (Million), by Country 2024 & 2032
- Figure 11: MEA Oilfield Services Industry Revenue Share (%), by Country 2024 & 2032
- Figure 12: North America Oilfield Services Industry Revenue (Million), by Service Type 2024 & 2032
- Figure 13: North America Oilfield Services Industry Revenue Share (%), by Service Type 2024 & 2032
- Figure 14: North America Oilfield Services Industry Revenue (Million), by Location of Deployment 2024 & 2032
- Figure 15: North America Oilfield Services Industry Revenue Share (%), by Location of Deployment 2024 & 2032
- Figure 16: North America Oilfield Services Industry Revenue (Million), by Country 2024 & 2032
- Figure 17: North America Oilfield Services Industry Revenue Share (%), by Country 2024 & 2032
- Figure 18: Europe Oilfield Services Industry Revenue (Million), by Service Type 2024 & 2032
- Figure 19: Europe Oilfield Services Industry Revenue Share (%), by Service Type 2024 & 2032
- Figure 20: Europe Oilfield Services Industry Revenue (Million), by Location of Deployment 2024 & 2032
- Figure 21: Europe Oilfield Services Industry Revenue Share (%), by Location of Deployment 2024 & 2032
- Figure 22: Europe Oilfield Services Industry Revenue (Million), by Country 2024 & 2032
- Figure 23: Europe Oilfield Services Industry Revenue Share (%), by Country 2024 & 2032
- Figure 24: Asia Pacific Oilfield Services Industry Revenue (Million), by Service Type 2024 & 2032
- Figure 25: Asia Pacific Oilfield Services Industry Revenue Share (%), by Service Type 2024 & 2032
- Figure 26: Asia Pacific Oilfield Services Industry Revenue (Million), by Location of Deployment 2024 & 2032
- Figure 27: Asia Pacific Oilfield Services Industry Revenue Share (%), by Location of Deployment 2024 & 2032
- Figure 28: Asia Pacific Oilfield Services Industry Revenue (Million), by Country 2024 & 2032
- Figure 29: Asia Pacific Oilfield Services Industry Revenue Share (%), by Country 2024 & 2032
- Figure 30: South America Oilfield Services Industry Revenue (Million), by Service Type 2024 & 2032
- Figure 31: South America Oilfield Services Industry Revenue Share (%), by Service Type 2024 & 2032
- Figure 32: South America Oilfield Services Industry Revenue (Million), by Location of Deployment 2024 & 2032
- Figure 33: South America Oilfield Services Industry Revenue Share (%), by Location of Deployment 2024 & 2032
- Figure 34: South America Oilfield Services Industry Revenue (Million), by Country 2024 & 2032
- Figure 35: South America Oilfield Services Industry Revenue Share (%), by Country 2024 & 2032
- Figure 36: Middle East and Africa Oilfield Services Industry Revenue (Million), by Service Type 2024 & 2032
- Figure 37: Middle East and Africa Oilfield Services Industry Revenue Share (%), by Service Type 2024 & 2032
- Figure 38: Middle East and Africa Oilfield Services Industry Revenue (Million), by Location of Deployment 2024 & 2032
- Figure 39: Middle East and Africa Oilfield Services Industry Revenue Share (%), by Location of Deployment 2024 & 2032
- Figure 40: Middle East and Africa Oilfield Services Industry Revenue (Million), by Country 2024 & 2032
- Figure 41: Middle East and Africa Oilfield Services Industry Revenue Share (%), by Country 2024 & 2032
List of Tables
- Table 1: Global Oilfield Services Industry Revenue Million Forecast, by Region 2019 & 2032
- Table 2: Global Oilfield Services Industry Revenue Million Forecast, by Service Type 2019 & 2032
- Table 3: Global Oilfield Services Industry Revenue Million Forecast, by Location of Deployment 2019 & 2032
- Table 4: Global Oilfield Services Industry Revenue Million Forecast, by Region 2019 & 2032
- Table 5: Global Oilfield Services Industry Revenue Million Forecast, by Country 2019 & 2032
- Table 6: United States Oilfield Services Industry Revenue (Million) Forecast, by Application 2019 & 2032
- Table 7: Canada Oilfield Services Industry Revenue (Million) Forecast, by Application 2019 & 2032
- Table 8: Mexico Oilfield Services Industry Revenue (Million) Forecast, by Application 2019 & 2032
- Table 9: Global Oilfield Services Industry Revenue Million Forecast, by Country 2019 & 2032
- Table 10: Germany Oilfield Services Industry Revenue (Million) Forecast, by Application 2019 & 2032
- Table 11: United Kingdom Oilfield Services Industry Revenue (Million) Forecast, by Application 2019 & 2032
- Table 12: France Oilfield Services Industry Revenue (Million) Forecast, by Application 2019 & 2032
- Table 13: Spain Oilfield Services Industry Revenue (Million) Forecast, by Application 2019 & 2032
- Table 14: Italy Oilfield Services Industry Revenue (Million) Forecast, by Application 2019 & 2032
- Table 15: Spain Oilfield Services Industry Revenue (Million) Forecast, by Application 2019 & 2032
- Table 16: Belgium Oilfield Services Industry Revenue (Million) Forecast, by Application 2019 & 2032
- Table 17: Netherland Oilfield Services Industry Revenue (Million) Forecast, by Application 2019 & 2032
- Table 18: Nordics Oilfield Services Industry Revenue (Million) Forecast, by Application 2019 & 2032
- Table 19: Rest of Europe Oilfield Services Industry Revenue (Million) Forecast, by Application 2019 & 2032
- Table 20: Global Oilfield Services Industry Revenue Million Forecast, by Country 2019 & 2032
- Table 21: China Oilfield Services Industry Revenue (Million) Forecast, by Application 2019 & 2032
- Table 22: Japan Oilfield Services Industry Revenue (Million) Forecast, by Application 2019 & 2032
- Table 23: India Oilfield Services Industry Revenue (Million) Forecast, by Application 2019 & 2032
- Table 24: South Korea Oilfield Services Industry Revenue (Million) Forecast, by Application 2019 & 2032
- Table 25: Southeast Asia Oilfield Services Industry Revenue (Million) Forecast, by Application 2019 & 2032
- Table 26: Australia Oilfield Services Industry Revenue (Million) Forecast, by Application 2019 & 2032
- Table 27: Indonesia Oilfield Services Industry Revenue (Million) Forecast, by Application 2019 & 2032
- Table 28: Phillipes Oilfield Services Industry Revenue (Million) Forecast, by Application 2019 & 2032
- Table 29: Singapore Oilfield Services Industry Revenue (Million) Forecast, by Application 2019 & 2032
- Table 30: Thailandc Oilfield Services Industry Revenue (Million) Forecast, by Application 2019 & 2032
- Table 31: Rest of Asia Pacific Oilfield Services Industry Revenue (Million) Forecast, by Application 2019 & 2032
- Table 32: Global Oilfield Services Industry Revenue Million Forecast, by Country 2019 & 2032
- Table 33: Brazil Oilfield Services Industry Revenue (Million) Forecast, by Application 2019 & 2032
- Table 34: Argentina Oilfield Services Industry Revenue (Million) Forecast, by Application 2019 & 2032
- Table 35: Peru Oilfield Services Industry Revenue (Million) Forecast, by Application 2019 & 2032
- Table 36: Chile Oilfield Services Industry Revenue (Million) Forecast, by Application 2019 & 2032
- Table 37: Colombia Oilfield Services Industry Revenue (Million) Forecast, by Application 2019 & 2032
- Table 38: Ecuador Oilfield Services Industry Revenue (Million) Forecast, by Application 2019 & 2032
- Table 39: Venezuela Oilfield Services Industry Revenue (Million) Forecast, by Application 2019 & 2032
- Table 40: Rest of South America Oilfield Services Industry Revenue (Million) Forecast, by Application 2019 & 2032
- Table 41: Global Oilfield Services Industry Revenue Million Forecast, by Country 2019 & 2032
- Table 42: United Arab Emirates Oilfield Services Industry Revenue (Million) Forecast, by Application 2019 & 2032
- Table 43: Saudi Arabia Oilfield Services Industry Revenue (Million) Forecast, by Application 2019 & 2032
- Table 44: South Africa Oilfield Services Industry Revenue (Million) Forecast, by Application 2019 & 2032
- Table 45: Rest of Middle East and Africa Oilfield Services Industry Revenue (Million) Forecast, by Application 2019 & 2032
- Table 46: Global Oilfield Services Industry Revenue Million Forecast, by Service Type 2019 & 2032
- Table 47: Global Oilfield Services Industry Revenue Million Forecast, by Location of Deployment 2019 & 2032
- Table 48: Global Oilfield Services Industry Revenue Million Forecast, by Country 2019 & 2032
- Table 49: United States Oilfield Services Industry Revenue (Million) Forecast, by Application 2019 & 2032
- Table 50: Canada Oilfield Services Industry Revenue (Million) Forecast, by Application 2019 & 2032
- Table 51: Rest of North America Oilfield Services Industry Revenue (Million) Forecast, by Application 2019 & 2032
- Table 52: Global Oilfield Services Industry Revenue Million Forecast, by Service Type 2019 & 2032
- Table 53: Global Oilfield Services Industry Revenue Million Forecast, by Location of Deployment 2019 & 2032
- Table 54: Global Oilfield Services Industry Revenue Million Forecast, by Country 2019 & 2032
- Table 55: Germany Oilfield Services Industry Revenue (Million) Forecast, by Application 2019 & 2032
- Table 56: France Oilfield Services Industry Revenue (Million) Forecast, by Application 2019 & 2032
- Table 57: United Kingdom Oilfield Services Industry Revenue (Million) Forecast, by Application 2019 & 2032
- Table 58: Italy Oilfield Services Industry Revenue (Million) Forecast, by Application 2019 & 2032
- Table 59: Russia Oilfield Services Industry Revenue (Million) Forecast, by Application 2019 & 2032
- Table 60: Spain Oilfield Services Industry Revenue (Million) Forecast, by Application 2019 & 2032
- Table 61: NORDIC Oilfield Services Industry Revenue (Million) Forecast, by Application 2019 & 2032
- Table 62: Turkey Oilfield Services Industry Revenue (Million) Forecast, by Application 2019 & 2032
- Table 63: Rest of Europe Oilfield Services Industry Revenue (Million) Forecast, by Application 2019 & 2032
- Table 64: Global Oilfield Services Industry Revenue Million Forecast, by Service Type 2019 & 2032
- Table 65: Global Oilfield Services Industry Revenue Million Forecast, by Location of Deployment 2019 & 2032
- Table 66: Global Oilfield Services Industry Revenue Million Forecast, by Country 2019 & 2032
- Table 67: China Oilfield Services Industry Revenue (Million) Forecast, by Application 2019 & 2032
- Table 68: India Oilfield Services Industry Revenue (Million) Forecast, by Application 2019 & 2032
- Table 69: Japan Oilfield Services Industry Revenue (Million) Forecast, by Application 2019 & 2032
- Table 70: South Korea Oilfield Services Industry Revenue (Million) Forecast, by Application 2019 & 2032
- Table 71: Malaysia Oilfield Services Industry Revenue (Million) Forecast, by Application 2019 & 2032
- Table 72: Thailand Oilfield Services Industry Revenue (Million) Forecast, by Application 2019 & 2032
- Table 73: Vietnam Oilfield Services Industry Revenue (Million) Forecast, by Application 2019 & 2032
- Table 74: Rest of Asia Pacific Oilfield Services Industry Revenue (Million) Forecast, by Application 2019 & 2032
- Table 75: Global Oilfield Services Industry Revenue Million Forecast, by Service Type 2019 & 2032
- Table 76: Global Oilfield Services Industry Revenue Million Forecast, by Location of Deployment 2019 & 2032
- Table 77: Global Oilfield Services Industry Revenue Million Forecast, by Country 2019 & 2032
- Table 78: Brazil Oilfield Services Industry Revenue (Million) Forecast, by Application 2019 & 2032
- Table 79: Argentina Oilfield Services Industry Revenue (Million) Forecast, by Application 2019 & 2032
- Table 80: Colombia Oilfield Services Industry Revenue (Million) Forecast, by Application 2019 & 2032
- Table 81: Rest of South America Oilfield Services Industry Revenue (Million) Forecast, by Application 2019 & 2032
- Table 82: Global Oilfield Services Industry Revenue Million Forecast, by Service Type 2019 & 2032
- Table 83: Global Oilfield Services Industry Revenue Million Forecast, by Location of Deployment 2019 & 2032
- Table 84: Global Oilfield Services Industry Revenue Million Forecast, by Country 2019 & 2032
- Table 85: Saudi Arabia Oilfield Services Industry Revenue (Million) Forecast, by Application 2019 & 2032
- Table 86: United Arab Emirates Oilfield Services Industry Revenue (Million) Forecast, by Application 2019 & 2032
- Table 87: South Africa Oilfield Services Industry Revenue (Million) Forecast, by Application 2019 & 2032
- Table 88: Nigeria Oilfield Services Industry Revenue (Million) Forecast, by Application 2019 & 2032
- Table 89: Qatar Oilfield Services Industry Revenue (Million) Forecast, by Application 2019 & 2032
- Table 90: Egypt Oilfield Services Industry Revenue (Million) Forecast, by Application 2019 & 2032
- Table 91: Rest of the Middle East and Africa Oilfield Services Industry Revenue (Million) Forecast, by Application 2019 & 2032
Frequently Asked Questions
1. What is the projected Compound Annual Growth Rate (CAGR) of the Oilfield Services Industry?
The projected CAGR is approximately 5.83%.
2. Which companies are prominent players in the Oilfield Services Industry?
Key companies in the market include Expro Group, Basic Energy Services Inc, Nabors Industries Inc, Weatherford International PLC, Transocean Ltd, Baker Hughes Company, China Oilfield Services Limited, Halliburton Company, OiLSERV, Schlumberger Limited, Valaris PLC.
3. What are the main segments of the Oilfield Services Industry?
The market segments include Service Type, Location of Deployment.
4. Can you provide details about the market size?
The market size is estimated to be USD 119.36 Million as of 2022.
5. What are some drivers contributing to market growth?
4.; Increasing Development of Gas Reserves and Advanced Technology. Tools. and Equipment4.; Increasing Investment in the Oilfield Services across World.
6. What are the notable trends driving market growth?
Drilling Services Are Expected to Dominate the Market.
7. Are there any restraints impacting market growth?
4.; The Volatile Oil Prices Over the Recent Period. Owing to the Supply-Demand Gap.
8. Can you provide examples of recent developments in the market?
September 2023: SLB signed a subsurface technology agreement with INEOS Energy, the energy division of INEOS, a global chemical and manufacturing company. INEOS Energy will partner with SLB’s Performance Centre in Aberdeen to collaborate and innovate subsurface technologies, including AI capabilities, to help it drive operational performance for continued growth, new acquisitions, and carbon capture and storage (CCS).
9. What pricing options are available for accessing the report?
Pricing options include single-user, multi-user, and enterprise licenses priced at USD 4750, USD 5250, and USD 8750 respectively.
10. Is the market size provided in terms of value or volume?
The market size is provided in terms of value, measured in Million.
11. Are there any specific market keywords associated with the report?
Yes, the market keyword associated with the report is "Oilfield Services Industry," which aids in identifying and referencing the specific market segment covered.
12. How do I determine which pricing option suits my needs best?
The pricing options vary based on user requirements and access needs. Individual users may opt for single-user licenses, while businesses requiring broader access may choose multi-user or enterprise licenses for cost-effective access to the report.
13. Are there any additional resources or data provided in the Oilfield Services Industry report?
While the report offers comprehensive insights, it's advisable to review the specific contents or supplementary materials provided to ascertain if additional resources or data are available.
14. How can I stay updated on further developments or reports in the Oilfield Services Industry?
To stay informed about further developments, trends, and reports in the Oilfield Services Industry, consider subscribing to industry newsletters, following relevant companies and organizations, or regularly checking reputable industry news sources and publications.
Methodology
Step 1 - Identification of Relevant Samples Size from Population Database


Step 2 - Approaches for Defining Global Market Size (Value, Volume* & Price*)

Note*: In applicable scenarios
Step 3 - Data Sources
Primary Research
- Web Analytics
- Survey Reports
- Research Institute
- Latest Research Reports
- Opinion Leaders
Secondary Research
- Annual Reports
- White Paper
- Latest Press Release
- Industry Association
- Paid Database
- Investor Presentations

Step 4 - Data Triangulation
Involves using different sources of information in order to increase the validity of a study
These sources are likely to be stakeholders in a program - participants, other researchers, program staff, other community members, and so on.
Then we put all data in single framework & apply various statistical tools to find out the dynamic on the market.
During the analysis stage, feedback from the stakeholder groups would be compared to determine areas of agreement as well as areas of divergence


