
Key Insights
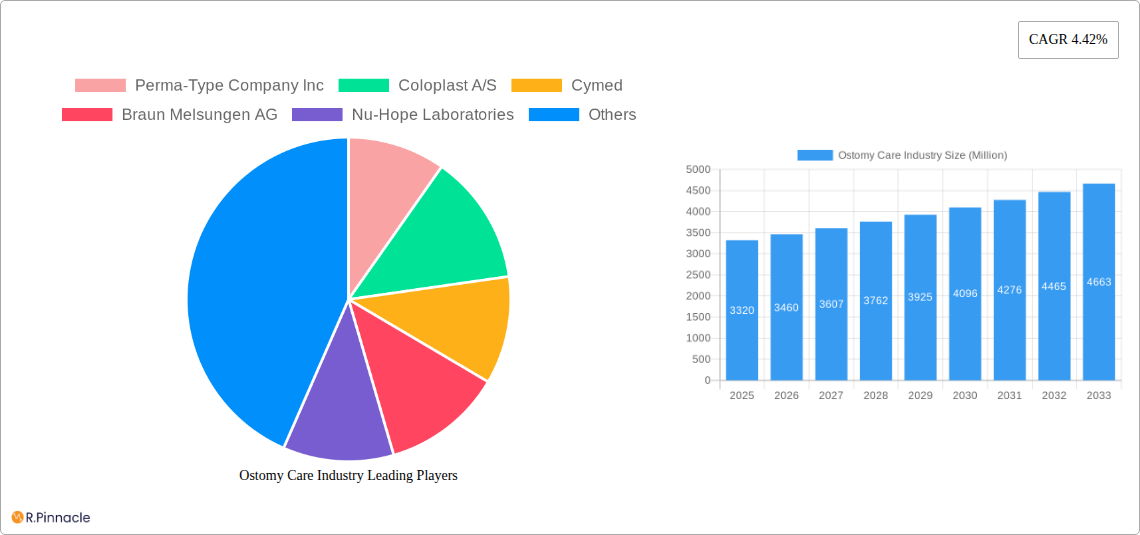
The ostomy care market, valued at $3.32 billion in 2025, is projected to experience robust growth, driven by a rising prevalence of colorectal cancer, inflammatory bowel disease (IBD), and other conditions requiring ostomy surgery. Technological advancements in ostomy products, such as improved adhesives, skin barriers, and more comfortable bag designs, are further fueling market expansion. The increasing geriatric population, susceptible to conditions necessitating ostomy care, presents a significant growth opportunity. Demand is particularly strong in developed regions like North America and Europe, where healthcare infrastructure is advanced and disposable incomes are higher. However, factors such as high treatment costs and the potential for complications associated with ostomy surgery act as restraints. The market is segmented by product type (ostomy bags, accessories), surgery type (colostomy, ileostomy, urostomy), and end-user (hospitals, home care, ambulatory surgical centers). Growth is expected across all segments, with ostomy bags representing the largest portion of the market due to their essential nature in ostomy management. Home healthcare settings are expected to see increased demand as patients increasingly prefer at-home care solutions. Competitive landscape analysis reveals key players such as Coloplast, ConvaTec, Hollister, and others continuously investing in R&D and strategic acquisitions to strengthen their market presence. The market's future growth trajectory hinges on continued innovation, improved patient outcomes, and expanding access to affordable and high-quality ostomy care globally.
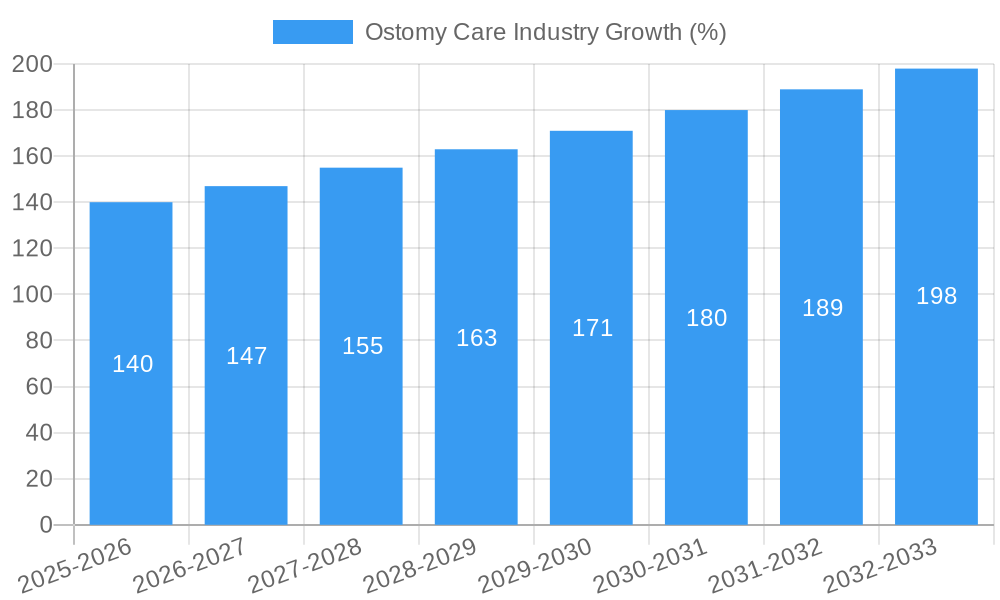
The forecast period (2025-2033) anticipates a steady expansion, with the CAGR of 4.42% indicating consistent market growth. This growth will be influenced by factors such as increased awareness of ostomy care options, improved patient education, and the expansion of healthcare services in emerging markets. Companies are focusing on developing innovative products and services to cater to the evolving needs of patients, including telehealth platforms for remote monitoring and patient support. The Asia-Pacific region, driven by population growth and rising healthcare expenditure, is projected to experience significant growth in the coming years. However, regulatory hurdles and variations in reimbursement policies across different regions present challenges to market expansion. Overall, the ostomy care market is poised for substantial growth, presenting significant opportunities for existing and new market entrants.
Ostomy Care Industry Market Report: 2019-2033
This comprehensive report provides a detailed analysis of the Ostomy Care industry, projecting a market value exceeding $XX Million by 2033. The study covers the period from 2019 to 2033, with a focus on the 2025-2033 forecast period and a base year of 2025. It offers actionable insights for industry professionals, investors, and stakeholders seeking to navigate this dynamic market.
Ostomy Care Industry Market Structure & Innovation Trends
The Ostomy Care market is characterized by a moderately concentrated landscape, with key players such as Coloplast A/S, ConvaTec Group Plc, and Hollister Inc. holding significant market share. However, the presence of numerous smaller companies fosters competition and innovation. Market share data for 2024 shows Coloplast A/S leading with an estimated xx% share, followed by ConvaTec Group Plc at xx% and Hollister Inc. at xx%. The industry is driven by advancements in materials science, leading to improved comfort and adherence of ostomy products. Regulatory frameworks, such as those governing medical device approvals, play a crucial role. Substitutes are limited, mainly focusing on alternative surgical techniques. The end-user demographic skews toward an aging population with higher incidences of colorectal and urological cancers and inflammatory bowel disease. M&A activity has been significant; for example, the xx Million acquisition of Apria Inc. by Owens & Minor Inc. in January 2022 broadened the latter's ostomy portfolio.
- Market Concentration: Moderately concentrated with significant players holding substantial market share.
- Innovation Drivers: Advancements in materials science, improved product design, and minimally invasive surgical techniques.
- Regulatory Landscape: Stringent regulations governing medical devices and healthcare products.
- Product Substitutes: Limited substitutes, primarily alternative surgical procedures.
- End-User Demographics: Aging population with increased prevalence of relevant diseases.
- M&A Activity: Significant M&A activity impacting market consolidation and expansion.
Ostomy Care Industry Market Dynamics & Trends
The Ostomy Care market is experiencing robust growth, with a projected Compound Annual Growth Rate (CAGR) of xx% during the forecast period (2025-2033). This growth is primarily driven by increasing prevalence of diseases requiring ostomy surgery, rising geriatric population, and technological advancements leading to improved product features and patient outcomes. Technological disruptions, such as the introduction of smart ostomy bags and telehealth monitoring systems, are enhancing patient convenience and care management. Consumer preferences are shifting towards more discreet, comfortable, and user-friendly products. Competitive dynamics are characterized by a combination of product differentiation, pricing strategies, and strategic partnerships. Market penetration remains relatively high in developed regions, with growth opportunities focusing on emerging markets and underserved populations.
Dominant Regions & Segments in Ostomy Care Industry
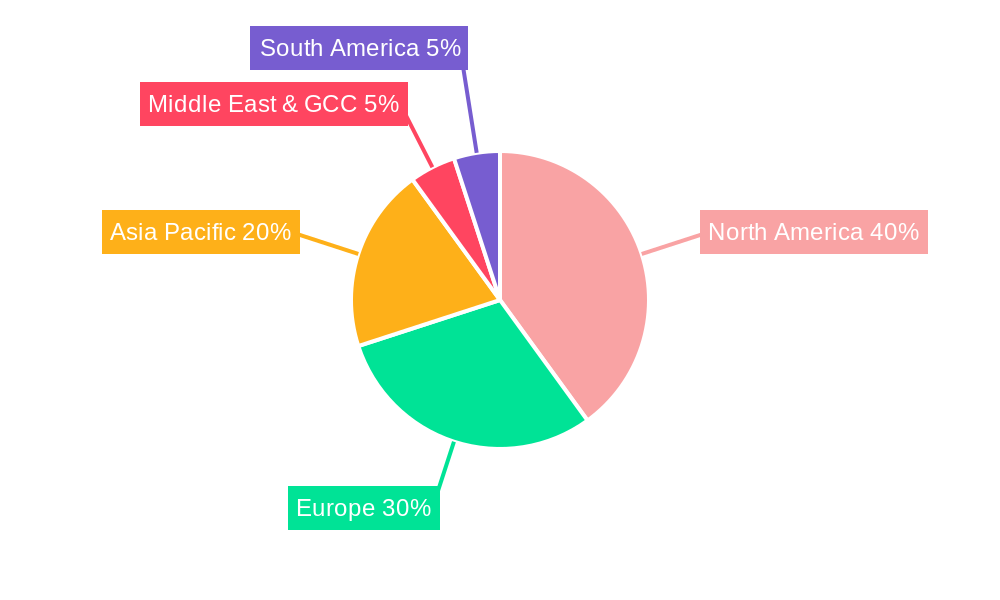
The North American region currently dominates the Ostomy Care market, driven by factors such as high healthcare expenditure, advanced healthcare infrastructure, and a significant aging population. However, rapidly developing economies in Asia-Pacific are poised for substantial growth in the coming years.
- Leading Region: North America
- Leading Product Type: Ostomy Bags
- Leading Surgery Type: Colostomy
- Leading End User: Hospitals and Specialty Clinics
Key Drivers for North American Dominance:
- High healthcare expenditure.
- Well-established healthcare infrastructure.
- Large geriatric population with higher disease prevalence.
- Strong presence of major market players.
Key Drivers for Asia-Pacific Growth Potential:
- Increasing prevalence of chronic diseases.
- Growing healthcare infrastructure investments.
- Rising disposable incomes and healthcare awareness.
- Favorable government policies supporting healthcare access.
Ostomy Care Industry Product Innovations
Recent years have witnessed significant product innovations, including the development of improved adhesive technologies, more discreet and comfortable ostomy bags, and advanced accessories for better skin protection. These advancements address unmet patient needs, enhance comfort and convenience, and improve the overall quality of life for ostomy patients. The market is also witnessing a shift towards technologically advanced products, such as smart ostomy bags that provide real-time data on stoma output and skin health.
Report Scope & Segmentation Analysis
This report segments the Ostomy Care market by product type (Ostomy Bags and Ostomy Accessories), surgery type (Colostomy, Ileostomy, and Urostomy), and end-user (Hospitals and Specialty Clinics, Home Care Settings, and Ambulatory Surgical Centers). Each segment's growth projections, market sizes, and competitive dynamics are analyzed in detail, providing a comprehensive understanding of market opportunities and challenges across different segments. For instance, the Ostomy Bags segment is projected to witness a CAGR of xx% during the forecast period, driven by increasing demand for advanced features such as improved adherence and comfort.
Key Drivers of Ostomy Care Industry Growth
Several factors are driving the growth of the Ostomy Care industry. The increasing prevalence of diseases requiring ostomy surgery, such as colorectal cancer, Crohn's disease, and ulcerative colitis, is a major factor. The aging global population also significantly contributes to market expansion, as older individuals are more susceptible to these conditions. Technological advancements resulting in improved product designs, better patient comfort, and enhanced healthcare management systems are additional key drivers. Finally, supportive government policies and rising healthcare expenditure play a crucial role in fostering industry growth.
Challenges in the Ostomy Care Industry Sector
The Ostomy Care industry faces several challenges, including stringent regulatory hurdles for new product approvals, potential supply chain disruptions impacting the availability of raw materials, and intense competition among established and emerging players. These factors can impact product pricing, market access, and overall profitability. The industry also faces the challenge of managing patient adherence to ostomy care protocols, requiring strong patient education and support programs. The estimated impact of these challenges on market growth is projected to be a reduction of xx% in the overall market CAGR during the forecast period.
Emerging Opportunities in Ostomy Care Industry
The Ostomy Care industry presents several emerging opportunities. The expansion into underserved markets, particularly in developing countries, offers significant growth potential. The integration of telehealth technologies for remote patient monitoring and support could revolutionize ostomy care. Focus on patient education and improved access to specialized healthcare professionals could lead to better patient outcomes and increased market demand. Furthermore, innovations in product design and materials offer opportunities to improve patient comfort, reducing the stigma associated with ostomy care.
Leading Players in the Ostomy Care Industry Market
- Perma-Type Company Inc
- Coloplast A/S
- Cymed
- Braun Melsungen AG
- Nu-Hope Laboratories
- ConvaTec Group Plc
- Welland Medical Ltd
- Hollister Inc
- Marlen Manufacturing & Development Co
- ALCARE Co Ltd
- Torbot Group Inc
- Salts Healthcare
Key Developments in Ostomy Care Industry Industry
- January 2023: OstomyCure announced the complete patient recruitment milestone in the clinical trial of its innovative titanium port TIES implant technology. This development could significantly improve the quality of life for ostomy patients.
- February 2022: HR Pharmaceuticals, Inc. launched a new product line, Vitus Ostomy Care, expanding the range of ostomy accessories available in the market.
- January 2022: Owens & Minor Inc. acquired Apria Inc., broadening its ostomy care portfolio and strengthening its market position.
Future Outlook for Ostomy Care Industry Market
The Ostomy Care market is poised for continued growth, driven by technological advancements, increasing disease prevalence, and the expansion into emerging markets. Strategic partnerships, product diversification, and a focus on patient-centric solutions will be crucial for success in this dynamic industry. The market's future potential is significant, presenting numerous opportunities for both established players and new entrants. The rising adoption of minimally invasive surgical procedures and the growing demand for advanced ostomy products are expected to contribute to the sustained growth of the Ostomy Care market.
Ostomy Care Industry Segmentation
-
1. Product Type
- 1.1. Ostomy Bags
- 1.2. Ostomy Accessories
-
2. Surgery Type
- 2.1. Colostomy
- 2.2. Ileostomy
- 2.3. Urostomy
-
3. End User
- 3.1. Hospitals and Specialty clinics
- 3.2. Home care settings
- 3.3. Ambulatory Surgical Centers
Ostomy Care Industry Segmentation By Geography
-
1. North America
- 1.1. United States
- 1.2. Canada
- 1.3. Mexico
-
2. Europe
- 2.1. Germany
- 2.2. United Kingdom
- 2.3. France
- 2.4. Italy
- 2.5. Spain
- 2.6. Rest of Europe
-
3. Asia Pacific
- 3.1. China
- 3.2. Japan
- 3.3. India
- 3.4. Australia
- 3.5. South Korea
- 3.6. Rest of Asia Pacific
- 4. Middle East
-
5. GCC
- 5.1. South Africa
- 5.2. Rest of Middle East
-
6. South America
- 6.1. Brazil
- 6.2. Argentina
- 6.3. Rest of South America
Ostomy Care Industry REPORT HIGHLIGHTS
| Aspects | Details |
|---|---|
| Study Period | 2019-2033 |
| Base Year | 2024 |
| Estimated Year | 2025 |
| Forecast Period | 2025-2033 |
| Historical Period | 2019-2024 |
| Growth Rate | CAGR of 4.42% from 2019-2033 |
| Segmentation |
|
Table of Contents
- 1. Introduction
- 1.1. Research Scope
- 1.2. Market Segmentation
- 1.3. Research Methodology
- 1.4. Definitions and Assumptions
- 2. Executive Summary
- 2.1. Introduction
- 3. Market Dynamics
- 3.1. Introduction
- 3.2. Market Drivers
- 3.2.1. Growing Prevalence of Inflammatory Bowel Diseases; Technological Advancements in the Arena of Ostomy Care; Increase in Initiatives to Raise Ostomy Awareness
- 3.3. Market Restrains
- 3.3.1. Risk of Skin Irritation and Infections
- 3.4. Market Trends
- 3.4.1. Ostomy Bags Segment is Expected to Exhibit a Significant Market Growth Over the Forecast Period
- 4. Market Factor Analysis
- 4.1. Porters Five Forces
- 4.2. Supply/Value Chain
- 4.3. PESTEL analysis
- 4.4. Market Entropy
- 4.5. Patent/Trademark Analysis
- 5. Global Ostomy Care Industry Analysis, Insights and Forecast, 2019-2031
- 5.1. Market Analysis, Insights and Forecast - by Product Type
- 5.1.1. Ostomy Bags
- 5.1.2. Ostomy Accessories
- 5.2. Market Analysis, Insights and Forecast - by Surgery Type
- 5.2.1. Colostomy
- 5.2.2. Ileostomy
- 5.2.3. Urostomy
- 5.3. Market Analysis, Insights and Forecast - by End User
- 5.3.1. Hospitals and Specialty clinics
- 5.3.2. Home care settings
- 5.3.3. Ambulatory Surgical Centers
- 5.4. Market Analysis, Insights and Forecast - by Region
- 5.4.1. North America
- 5.4.2. Europe
- 5.4.3. Asia Pacific
- 5.4.4. Middle East
- 5.4.5. GCC
- 5.4.6. South America
- 5.1. Market Analysis, Insights and Forecast - by Product Type
- 6. North America Ostomy Care Industry Analysis, Insights and Forecast, 2019-2031
- 6.1. Market Analysis, Insights and Forecast - by Product Type
- 6.1.1. Ostomy Bags
- 6.1.2. Ostomy Accessories
- 6.2. Market Analysis, Insights and Forecast - by Surgery Type
- 6.2.1. Colostomy
- 6.2.2. Ileostomy
- 6.2.3. Urostomy
- 6.3. Market Analysis, Insights and Forecast - by End User
- 6.3.1. Hospitals and Specialty clinics
- 6.3.2. Home care settings
- 6.3.3. Ambulatory Surgical Centers
- 6.1. Market Analysis, Insights and Forecast - by Product Type
- 7. Europe Ostomy Care Industry Analysis, Insights and Forecast, 2019-2031
- 7.1. Market Analysis, Insights and Forecast - by Product Type
- 7.1.1. Ostomy Bags
- 7.1.2. Ostomy Accessories
- 7.2. Market Analysis, Insights and Forecast - by Surgery Type
- 7.2.1. Colostomy
- 7.2.2. Ileostomy
- 7.2.3. Urostomy
- 7.3. Market Analysis, Insights and Forecast - by End User
- 7.3.1. Hospitals and Specialty clinics
- 7.3.2. Home care settings
- 7.3.3. Ambulatory Surgical Centers
- 7.1. Market Analysis, Insights and Forecast - by Product Type
- 8. Asia Pacific Ostomy Care Industry Analysis, Insights and Forecast, 2019-2031
- 8.1. Market Analysis, Insights and Forecast - by Product Type
- 8.1.1. Ostomy Bags
- 8.1.2. Ostomy Accessories
- 8.2. Market Analysis, Insights and Forecast - by Surgery Type
- 8.2.1. Colostomy
- 8.2.2. Ileostomy
- 8.2.3. Urostomy
- 8.3. Market Analysis, Insights and Forecast - by End User
- 8.3.1. Hospitals and Specialty clinics
- 8.3.2. Home care settings
- 8.3.3. Ambulatory Surgical Centers
- 8.1. Market Analysis, Insights and Forecast - by Product Type
- 9. Middle East Ostomy Care Industry Analysis, Insights and Forecast, 2019-2031
- 9.1. Market Analysis, Insights and Forecast - by Product Type
- 9.1.1. Ostomy Bags
- 9.1.2. Ostomy Accessories
- 9.2. Market Analysis, Insights and Forecast - by Surgery Type
- 9.2.1. Colostomy
- 9.2.2. Ileostomy
- 9.2.3. Urostomy
- 9.3. Market Analysis, Insights and Forecast - by End User
- 9.3.1. Hospitals and Specialty clinics
- 9.3.2. Home care settings
- 9.3.3. Ambulatory Surgical Centers
- 9.1. Market Analysis, Insights and Forecast - by Product Type
- 10. GCC Ostomy Care Industry Analysis, Insights and Forecast, 2019-2031
- 10.1. Market Analysis, Insights and Forecast - by Product Type
- 10.1.1. Ostomy Bags
- 10.1.2. Ostomy Accessories
- 10.2. Market Analysis, Insights and Forecast - by Surgery Type
- 10.2.1. Colostomy
- 10.2.2. Ileostomy
- 10.2.3. Urostomy
- 10.3. Market Analysis, Insights and Forecast - by End User
- 10.3.1. Hospitals and Specialty clinics
- 10.3.2. Home care settings
- 10.3.3. Ambulatory Surgical Centers
- 10.1. Market Analysis, Insights and Forecast - by Product Type
- 11. South America Ostomy Care Industry Analysis, Insights and Forecast, 2019-2031
- 11.1. Market Analysis, Insights and Forecast - by Product Type
- 11.1.1. Ostomy Bags
- 11.1.2. Ostomy Accessories
- 11.2. Market Analysis, Insights and Forecast - by Surgery Type
- 11.2.1. Colostomy
- 11.2.2. Ileostomy
- 11.2.3. Urostomy
- 11.3. Market Analysis, Insights and Forecast - by End User
- 11.3.1. Hospitals and Specialty clinics
- 11.3.2. Home care settings
- 11.3.3. Ambulatory Surgical Centers
- 11.1. Market Analysis, Insights and Forecast - by Product Type
- 12. North America Ostomy Care Industry Analysis, Insights and Forecast, 2019-2031
- 12.1. Market Analysis, Insights and Forecast - By Country/Sub-region
- 12.1.1. undefined
- 13. Europe Ostomy Care Industry Analysis, Insights and Forecast, 2019-2031
- 13.1. Market Analysis, Insights and Forecast - By Country/Sub-region
- 13.1.1. undefined
- 14. Asia Pacific Ostomy Care Industry Analysis, Insights and Forecast, 2019-2031
- 14.1. Market Analysis, Insights and Forecast - By Country/Sub-region
- 14.1.1. undefined
- 15. Middle East Ostomy Care Industry Analysis, Insights and Forecast, 2019-2031
- 15.1. Market Analysis, Insights and Forecast - By Country/Sub-region
- 15.1.1. undefined
- 16. GCC Ostomy Care Industry Analysis, Insights and Forecast, 2019-2031
- 16.1. Market Analysis, Insights and Forecast - By Country/Sub-region
- 16.1.1. undefined
- 17. South America Ostomy Care Industry Analysis, Insights and Forecast, 2019-2031
- 17.1. Market Analysis, Insights and Forecast - By Country/Sub-region
- 17.1.1. undefined
- 18. Competitive Analysis
- 18.1. Global Market Share Analysis 2024
- 18.2. Company Profiles
- 18.2.1 Perma-Type Company Inc
- 18.2.1.1. Overview
- 18.2.1.2. Products
- 18.2.1.3. SWOT Analysis
- 18.2.1.4. Recent Developments
- 18.2.1.5. Financials (Based on Availability)
- 18.2.2 Coloplast A/S
- 18.2.2.1. Overview
- 18.2.2.2. Products
- 18.2.2.3. SWOT Analysis
- 18.2.2.4. Recent Developments
- 18.2.2.5. Financials (Based on Availability)
- 18.2.3 Cymed
- 18.2.3.1. Overview
- 18.2.3.2. Products
- 18.2.3.3. SWOT Analysis
- 18.2.3.4. Recent Developments
- 18.2.3.5. Financials (Based on Availability)
- 18.2.4 Braun Melsungen AG
- 18.2.4.1. Overview
- 18.2.4.2. Products
- 18.2.4.3. SWOT Analysis
- 18.2.4.4. Recent Developments
- 18.2.4.5. Financials (Based on Availability)
- 18.2.5 Nu-Hope Laboratories
- 18.2.5.1. Overview
- 18.2.5.2. Products
- 18.2.5.3. SWOT Analysis
- 18.2.5.4. Recent Developments
- 18.2.5.5. Financials (Based on Availability)
- 18.2.6 ConvaTec Group Plc
- 18.2.6.1. Overview
- 18.2.6.2. Products
- 18.2.6.3. SWOT Analysis
- 18.2.6.4. Recent Developments
- 18.2.6.5. Financials (Based on Availability)
- 18.2.7 Welland Medical Ltd
- 18.2.7.1. Overview
- 18.2.7.2. Products
- 18.2.7.3. SWOT Analysis
- 18.2.7.4. Recent Developments
- 18.2.7.5. Financials (Based on Availability)
- 18.2.8 Hollister Inc
- 18.2.8.1. Overview
- 18.2.8.2. Products
- 18.2.8.3. SWOT Analysis
- 18.2.8.4. Recent Developments
- 18.2.8.5. Financials (Based on Availability)
- 18.2.9 Marlen Manufacturing & Development Co
- 18.2.9.1. Overview
- 18.2.9.2. Products
- 18.2.9.3. SWOT Analysis
- 18.2.9.4. Recent Developments
- 18.2.9.5. Financials (Based on Availability)
- 18.2.10 ALCARE Co Ltd
- 18.2.10.1. Overview
- 18.2.10.2. Products
- 18.2.10.3. SWOT Analysis
- 18.2.10.4. Recent Developments
- 18.2.10.5. Financials (Based on Availability)
- 18.2.11 Torbot Group Inc
- 18.2.11.1. Overview
- 18.2.11.2. Products
- 18.2.11.3. SWOT Analysis
- 18.2.11.4. Recent Developments
- 18.2.11.5. Financials (Based on Availability)
- 18.2.12 Salts Healthcare
- 18.2.12.1. Overview
- 18.2.12.2. Products
- 18.2.12.3. SWOT Analysis
- 18.2.12.4. Recent Developments
- 18.2.12.5. Financials (Based on Availability)
- 18.2.1 Perma-Type Company Inc
List of Figures
- Figure 1: Global Ostomy Care Industry Revenue Breakdown (Million, %) by Region 2024 & 2032
- Figure 2: Global Ostomy Care Industry Volume Breakdown (K Unit, %) by Region 2024 & 2032
- Figure 3: North America Ostomy Care Industry Revenue (Million), by Country 2024 & 2032
- Figure 4: North America Ostomy Care Industry Volume (K Unit), by Country 2024 & 2032
- Figure 5: North America Ostomy Care Industry Revenue Share (%), by Country 2024 & 2032
- Figure 6: North America Ostomy Care Industry Volume Share (%), by Country 2024 & 2032
- Figure 7: Europe Ostomy Care Industry Revenue (Million), by Country 2024 & 2032
- Figure 8: Europe Ostomy Care Industry Volume (K Unit), by Country 2024 & 2032
- Figure 9: Europe Ostomy Care Industry Revenue Share (%), by Country 2024 & 2032
- Figure 10: Europe Ostomy Care Industry Volume Share (%), by Country 2024 & 2032
- Figure 11: Asia Pacific Ostomy Care Industry Revenue (Million), by Country 2024 & 2032
- Figure 12: Asia Pacific Ostomy Care Industry Volume (K Unit), by Country 2024 & 2032
- Figure 13: Asia Pacific Ostomy Care Industry Revenue Share (%), by Country 2024 & 2032
- Figure 14: Asia Pacific Ostomy Care Industry Volume Share (%), by Country 2024 & 2032
- Figure 15: Middle East Ostomy Care Industry Revenue (Million), by Country 2024 & 2032
- Figure 16: Middle East Ostomy Care Industry Volume (K Unit), by Country 2024 & 2032
- Figure 17: Middle East Ostomy Care Industry Revenue Share (%), by Country 2024 & 2032
- Figure 18: Middle East Ostomy Care Industry Volume Share (%), by Country 2024 & 2032
- Figure 19: GCC Ostomy Care Industry Revenue (Million), by Country 2024 & 2032
- Figure 20: GCC Ostomy Care Industry Volume (K Unit), by Country 2024 & 2032
- Figure 21: GCC Ostomy Care Industry Revenue Share (%), by Country 2024 & 2032
- Figure 22: GCC Ostomy Care Industry Volume Share (%), by Country 2024 & 2032
- Figure 23: South America Ostomy Care Industry Revenue (Million), by Country 2024 & 2032
- Figure 24: South America Ostomy Care Industry Volume (K Unit), by Country 2024 & 2032
- Figure 25: South America Ostomy Care Industry Revenue Share (%), by Country 2024 & 2032
- Figure 26: South America Ostomy Care Industry Volume Share (%), by Country 2024 & 2032
- Figure 27: North America Ostomy Care Industry Revenue (Million), by Product Type 2024 & 2032
- Figure 28: North America Ostomy Care Industry Volume (K Unit), by Product Type 2024 & 2032
- Figure 29: North America Ostomy Care Industry Revenue Share (%), by Product Type 2024 & 2032
- Figure 30: North America Ostomy Care Industry Volume Share (%), by Product Type 2024 & 2032
- Figure 31: North America Ostomy Care Industry Revenue (Million), by Surgery Type 2024 & 2032
- Figure 32: North America Ostomy Care Industry Volume (K Unit), by Surgery Type 2024 & 2032
- Figure 33: North America Ostomy Care Industry Revenue Share (%), by Surgery Type 2024 & 2032
- Figure 34: North America Ostomy Care Industry Volume Share (%), by Surgery Type 2024 & 2032
- Figure 35: North America Ostomy Care Industry Revenue (Million), by End User 2024 & 2032
- Figure 36: North America Ostomy Care Industry Volume (K Unit), by End User 2024 & 2032
- Figure 37: North America Ostomy Care Industry Revenue Share (%), by End User 2024 & 2032
- Figure 38: North America Ostomy Care Industry Volume Share (%), by End User 2024 & 2032
- Figure 39: North America Ostomy Care Industry Revenue (Million), by Country 2024 & 2032
- Figure 40: North America Ostomy Care Industry Volume (K Unit), by Country 2024 & 2032
- Figure 41: North America Ostomy Care Industry Revenue Share (%), by Country 2024 & 2032
- Figure 42: North America Ostomy Care Industry Volume Share (%), by Country 2024 & 2032
- Figure 43: Europe Ostomy Care Industry Revenue (Million), by Product Type 2024 & 2032
- Figure 44: Europe Ostomy Care Industry Volume (K Unit), by Product Type 2024 & 2032
- Figure 45: Europe Ostomy Care Industry Revenue Share (%), by Product Type 2024 & 2032
- Figure 46: Europe Ostomy Care Industry Volume Share (%), by Product Type 2024 & 2032
- Figure 47: Europe Ostomy Care Industry Revenue (Million), by Surgery Type 2024 & 2032
- Figure 48: Europe Ostomy Care Industry Volume (K Unit), by Surgery Type 2024 & 2032
- Figure 49: Europe Ostomy Care Industry Revenue Share (%), by Surgery Type 2024 & 2032
- Figure 50: Europe Ostomy Care Industry Volume Share (%), by Surgery Type 2024 & 2032
- Figure 51: Europe Ostomy Care Industry Revenue (Million), by End User 2024 & 2032
- Figure 52: Europe Ostomy Care Industry Volume (K Unit), by End User 2024 & 2032
- Figure 53: Europe Ostomy Care Industry Revenue Share (%), by End User 2024 & 2032
- Figure 54: Europe Ostomy Care Industry Volume Share (%), by End User 2024 & 2032
- Figure 55: Europe Ostomy Care Industry Revenue (Million), by Country 2024 & 2032
- Figure 56: Europe Ostomy Care Industry Volume (K Unit), by Country 2024 & 2032
- Figure 57: Europe Ostomy Care Industry Revenue Share (%), by Country 2024 & 2032
- Figure 58: Europe Ostomy Care Industry Volume Share (%), by Country 2024 & 2032
- Figure 59: Asia Pacific Ostomy Care Industry Revenue (Million), by Product Type 2024 & 2032
- Figure 60: Asia Pacific Ostomy Care Industry Volume (K Unit), by Product Type 2024 & 2032
- Figure 61: Asia Pacific Ostomy Care Industry Revenue Share (%), by Product Type 2024 & 2032
- Figure 62: Asia Pacific Ostomy Care Industry Volume Share (%), by Product Type 2024 & 2032
- Figure 63: Asia Pacific Ostomy Care Industry Revenue (Million), by Surgery Type 2024 & 2032
- Figure 64: Asia Pacific Ostomy Care Industry Volume (K Unit), by Surgery Type 2024 & 2032
- Figure 65: Asia Pacific Ostomy Care Industry Revenue Share (%), by Surgery Type 2024 & 2032
- Figure 66: Asia Pacific Ostomy Care Industry Volume Share (%), by Surgery Type 2024 & 2032
- Figure 67: Asia Pacific Ostomy Care Industry Revenue (Million), by End User 2024 & 2032
- Figure 68: Asia Pacific Ostomy Care Industry Volume (K Unit), by End User 2024 & 2032
- Figure 69: Asia Pacific Ostomy Care Industry Revenue Share (%), by End User 2024 & 2032
- Figure 70: Asia Pacific Ostomy Care Industry Volume Share (%), by End User 2024 & 2032
- Figure 71: Asia Pacific Ostomy Care Industry Revenue (Million), by Country 2024 & 2032
- Figure 72: Asia Pacific Ostomy Care Industry Volume (K Unit), by Country 2024 & 2032
- Figure 73: Asia Pacific Ostomy Care Industry Revenue Share (%), by Country 2024 & 2032
- Figure 74: Asia Pacific Ostomy Care Industry Volume Share (%), by Country 2024 & 2032
- Figure 75: Middle East Ostomy Care Industry Revenue (Million), by Product Type 2024 & 2032
- Figure 76: Middle East Ostomy Care Industry Volume (K Unit), by Product Type 2024 & 2032
- Figure 77: Middle East Ostomy Care Industry Revenue Share (%), by Product Type 2024 & 2032
- Figure 78: Middle East Ostomy Care Industry Volume Share (%), by Product Type 2024 & 2032
- Figure 79: Middle East Ostomy Care Industry Revenue (Million), by Surgery Type 2024 & 2032
- Figure 80: Middle East Ostomy Care Industry Volume (K Unit), by Surgery Type 2024 & 2032
- Figure 81: Middle East Ostomy Care Industry Revenue Share (%), by Surgery Type 2024 & 2032
- Figure 82: Middle East Ostomy Care Industry Volume Share (%), by Surgery Type 2024 & 2032
- Figure 83: Middle East Ostomy Care Industry Revenue (Million), by End User 2024 & 2032
- Figure 84: Middle East Ostomy Care Industry Volume (K Unit), by End User 2024 & 2032
- Figure 85: Middle East Ostomy Care Industry Revenue Share (%), by End User 2024 & 2032
- Figure 86: Middle East Ostomy Care Industry Volume Share (%), by End User 2024 & 2032
- Figure 87: Middle East Ostomy Care Industry Revenue (Million), by Country 2024 & 2032
- Figure 88: Middle East Ostomy Care Industry Volume (K Unit), by Country 2024 & 2032
- Figure 89: Middle East Ostomy Care Industry Revenue Share (%), by Country 2024 & 2032
- Figure 90: Middle East Ostomy Care Industry Volume Share (%), by Country 2024 & 2032
- Figure 91: GCC Ostomy Care Industry Revenue (Million), by Product Type 2024 & 2032
- Figure 92: GCC Ostomy Care Industry Volume (K Unit), by Product Type 2024 & 2032
- Figure 93: GCC Ostomy Care Industry Revenue Share (%), by Product Type 2024 & 2032
- Figure 94: GCC Ostomy Care Industry Volume Share (%), by Product Type 2024 & 2032
- Figure 95: GCC Ostomy Care Industry Revenue (Million), by Surgery Type 2024 & 2032
- Figure 96: GCC Ostomy Care Industry Volume (K Unit), by Surgery Type 2024 & 2032
- Figure 97: GCC Ostomy Care Industry Revenue Share (%), by Surgery Type 2024 & 2032
- Figure 98: GCC Ostomy Care Industry Volume Share (%), by Surgery Type 2024 & 2032
- Figure 99: GCC Ostomy Care Industry Revenue (Million), by End User 2024 & 2032
- Figure 100: GCC Ostomy Care Industry Volume (K Unit), by End User 2024 & 2032
- Figure 101: GCC Ostomy Care Industry Revenue Share (%), by End User 2024 & 2032
- Figure 102: GCC Ostomy Care Industry Volume Share (%), by End User 2024 & 2032
- Figure 103: GCC Ostomy Care Industry Revenue (Million), by Country 2024 & 2032
- Figure 104: GCC Ostomy Care Industry Volume (K Unit), by Country 2024 & 2032
- Figure 105: GCC Ostomy Care Industry Revenue Share (%), by Country 2024 & 2032
- Figure 106: GCC Ostomy Care Industry Volume Share (%), by Country 2024 & 2032
- Figure 107: South America Ostomy Care Industry Revenue (Million), by Product Type 2024 & 2032
- Figure 108: South America Ostomy Care Industry Volume (K Unit), by Product Type 2024 & 2032
- Figure 109: South America Ostomy Care Industry Revenue Share (%), by Product Type 2024 & 2032
- Figure 110: South America Ostomy Care Industry Volume Share (%), by Product Type 2024 & 2032
- Figure 111: South America Ostomy Care Industry Revenue (Million), by Surgery Type 2024 & 2032
- Figure 112: South America Ostomy Care Industry Volume (K Unit), by Surgery Type 2024 & 2032
- Figure 113: South America Ostomy Care Industry Revenue Share (%), by Surgery Type 2024 & 2032
- Figure 114: South America Ostomy Care Industry Volume Share (%), by Surgery Type 2024 & 2032
- Figure 115: South America Ostomy Care Industry Revenue (Million), by End User 2024 & 2032
- Figure 116: South America Ostomy Care Industry Volume (K Unit), by End User 2024 & 2032
- Figure 117: South America Ostomy Care Industry Revenue Share (%), by End User 2024 & 2032
- Figure 118: South America Ostomy Care Industry Volume Share (%), by End User 2024 & 2032
- Figure 119: South America Ostomy Care Industry Revenue (Million), by Country 2024 & 2032
- Figure 120: South America Ostomy Care Industry Volume (K Unit), by Country 2024 & 2032
- Figure 121: South America Ostomy Care Industry Revenue Share (%), by Country 2024 & 2032
- Figure 122: South America Ostomy Care Industry Volume Share (%), by Country 2024 & 2032
List of Tables
- Table 1: Global Ostomy Care Industry Revenue Million Forecast, by Region 2019 & 2032
- Table 2: Global Ostomy Care Industry Volume K Unit Forecast, by Region 2019 & 2032
- Table 3: Global Ostomy Care Industry Revenue Million Forecast, by Product Type 2019 & 2032
- Table 4: Global Ostomy Care Industry Volume K Unit Forecast, by Product Type 2019 & 2032
- Table 5: Global Ostomy Care Industry Revenue Million Forecast, by Surgery Type 2019 & 2032
- Table 6: Global Ostomy Care Industry Volume K Unit Forecast, by Surgery Type 2019 & 2032
- Table 7: Global Ostomy Care Industry Revenue Million Forecast, by End User 2019 & 2032
- Table 8: Global Ostomy Care Industry Volume K Unit Forecast, by End User 2019 & 2032
- Table 9: Global Ostomy Care Industry Revenue Million Forecast, by Region 2019 & 2032
- Table 10: Global Ostomy Care Industry Volume K Unit Forecast, by Region 2019 & 2032
- Table 11: Global Ostomy Care Industry Revenue Million Forecast, by Country 2019 & 2032
- Table 12: Global Ostomy Care Industry Volume K Unit Forecast, by Country 2019 & 2032
- Table 13: Global Ostomy Care Industry Revenue Million Forecast, by Country 2019 & 2032
- Table 14: Global Ostomy Care Industry Volume K Unit Forecast, by Country 2019 & 2032
- Table 15: Global Ostomy Care Industry Revenue Million Forecast, by Country 2019 & 2032
- Table 16: Global Ostomy Care Industry Volume K Unit Forecast, by Country 2019 & 2032
- Table 17: Global Ostomy Care Industry Revenue Million Forecast, by Country 2019 & 2032
- Table 18: Global Ostomy Care Industry Volume K Unit Forecast, by Country 2019 & 2032
- Table 19: Global Ostomy Care Industry Revenue Million Forecast, by Country 2019 & 2032
- Table 20: Global Ostomy Care Industry Volume K Unit Forecast, by Country 2019 & 2032
- Table 21: Global Ostomy Care Industry Revenue Million Forecast, by Country 2019 & 2032
- Table 22: Global Ostomy Care Industry Volume K Unit Forecast, by Country 2019 & 2032
- Table 23: Global Ostomy Care Industry Revenue Million Forecast, by Product Type 2019 & 2032
- Table 24: Global Ostomy Care Industry Volume K Unit Forecast, by Product Type 2019 & 2032
- Table 25: Global Ostomy Care Industry Revenue Million Forecast, by Surgery Type 2019 & 2032
- Table 26: Global Ostomy Care Industry Volume K Unit Forecast, by Surgery Type 2019 & 2032
- Table 27: Global Ostomy Care Industry Revenue Million Forecast, by End User 2019 & 2032
- Table 28: Global Ostomy Care Industry Volume K Unit Forecast, by End User 2019 & 2032
- Table 29: Global Ostomy Care Industry Revenue Million Forecast, by Country 2019 & 2032
- Table 30: Global Ostomy Care Industry Volume K Unit Forecast, by Country 2019 & 2032
- Table 31: United States Ostomy Care Industry Revenue (Million) Forecast, by Application 2019 & 2032
- Table 32: United States Ostomy Care Industry Volume (K Unit) Forecast, by Application 2019 & 2032
- Table 33: Canada Ostomy Care Industry Revenue (Million) Forecast, by Application 2019 & 2032
- Table 34: Canada Ostomy Care Industry Volume (K Unit) Forecast, by Application 2019 & 2032
- Table 35: Mexico Ostomy Care Industry Revenue (Million) Forecast, by Application 2019 & 2032
- Table 36: Mexico Ostomy Care Industry Volume (K Unit) Forecast, by Application 2019 & 2032
- Table 37: Global Ostomy Care Industry Revenue Million Forecast, by Product Type 2019 & 2032
- Table 38: Global Ostomy Care Industry Volume K Unit Forecast, by Product Type 2019 & 2032
- Table 39: Global Ostomy Care Industry Revenue Million Forecast, by Surgery Type 2019 & 2032
- Table 40: Global Ostomy Care Industry Volume K Unit Forecast, by Surgery Type 2019 & 2032
- Table 41: Global Ostomy Care Industry Revenue Million Forecast, by End User 2019 & 2032
- Table 42: Global Ostomy Care Industry Volume K Unit Forecast, by End User 2019 & 2032
- Table 43: Global Ostomy Care Industry Revenue Million Forecast, by Country 2019 & 2032
- Table 44: Global Ostomy Care Industry Volume K Unit Forecast, by Country 2019 & 2032
- Table 45: Germany Ostomy Care Industry Revenue (Million) Forecast, by Application 2019 & 2032
- Table 46: Germany Ostomy Care Industry Volume (K Unit) Forecast, by Application 2019 & 2032
- Table 47: United Kingdom Ostomy Care Industry Revenue (Million) Forecast, by Application 2019 & 2032
- Table 48: United Kingdom Ostomy Care Industry Volume (K Unit) Forecast, by Application 2019 & 2032
- Table 49: France Ostomy Care Industry Revenue (Million) Forecast, by Application 2019 & 2032
- Table 50: France Ostomy Care Industry Volume (K Unit) Forecast, by Application 2019 & 2032
- Table 51: Italy Ostomy Care Industry Revenue (Million) Forecast, by Application 2019 & 2032
- Table 52: Italy Ostomy Care Industry Volume (K Unit) Forecast, by Application 2019 & 2032
- Table 53: Spain Ostomy Care Industry Revenue (Million) Forecast, by Application 2019 & 2032
- Table 54: Spain Ostomy Care Industry Volume (K Unit) Forecast, by Application 2019 & 2032
- Table 55: Rest of Europe Ostomy Care Industry Revenue (Million) Forecast, by Application 2019 & 2032
- Table 56: Rest of Europe Ostomy Care Industry Volume (K Unit) Forecast, by Application 2019 & 2032
- Table 57: Global Ostomy Care Industry Revenue Million Forecast, by Product Type 2019 & 2032
- Table 58: Global Ostomy Care Industry Volume K Unit Forecast, by Product Type 2019 & 2032
- Table 59: Global Ostomy Care Industry Revenue Million Forecast, by Surgery Type 2019 & 2032
- Table 60: Global Ostomy Care Industry Volume K Unit Forecast, by Surgery Type 2019 & 2032
- Table 61: Global Ostomy Care Industry Revenue Million Forecast, by End User 2019 & 2032
- Table 62: Global Ostomy Care Industry Volume K Unit Forecast, by End User 2019 & 2032
- Table 63: Global Ostomy Care Industry Revenue Million Forecast, by Country 2019 & 2032
- Table 64: Global Ostomy Care Industry Volume K Unit Forecast, by Country 2019 & 2032
- Table 65: China Ostomy Care Industry Revenue (Million) Forecast, by Application 2019 & 2032
- Table 66: China Ostomy Care Industry Volume (K Unit) Forecast, by Application 2019 & 2032
- Table 67: Japan Ostomy Care Industry Revenue (Million) Forecast, by Application 2019 & 2032
- Table 68: Japan Ostomy Care Industry Volume (K Unit) Forecast, by Application 2019 & 2032
- Table 69: India Ostomy Care Industry Revenue (Million) Forecast, by Application 2019 & 2032
- Table 70: India Ostomy Care Industry Volume (K Unit) Forecast, by Application 2019 & 2032
- Table 71: Australia Ostomy Care Industry Revenue (Million) Forecast, by Application 2019 & 2032
- Table 72: Australia Ostomy Care Industry Volume (K Unit) Forecast, by Application 2019 & 2032
- Table 73: South Korea Ostomy Care Industry Revenue (Million) Forecast, by Application 2019 & 2032
- Table 74: South Korea Ostomy Care Industry Volume (K Unit) Forecast, by Application 2019 & 2032
- Table 75: Rest of Asia Pacific Ostomy Care Industry Revenue (Million) Forecast, by Application 2019 & 2032
- Table 76: Rest of Asia Pacific Ostomy Care Industry Volume (K Unit) Forecast, by Application 2019 & 2032
- Table 77: Global Ostomy Care Industry Revenue Million Forecast, by Product Type 2019 & 2032
- Table 78: Global Ostomy Care Industry Volume K Unit Forecast, by Product Type 2019 & 2032
- Table 79: Global Ostomy Care Industry Revenue Million Forecast, by Surgery Type 2019 & 2032
- Table 80: Global Ostomy Care Industry Volume K Unit Forecast, by Surgery Type 2019 & 2032
- Table 81: Global Ostomy Care Industry Revenue Million Forecast, by End User 2019 & 2032
- Table 82: Global Ostomy Care Industry Volume K Unit Forecast, by End User 2019 & 2032
- Table 83: Global Ostomy Care Industry Revenue Million Forecast, by Country 2019 & 2032
- Table 84: Global Ostomy Care Industry Volume K Unit Forecast, by Country 2019 & 2032
- Table 85: Global Ostomy Care Industry Revenue Million Forecast, by Product Type 2019 & 2032
- Table 86: Global Ostomy Care Industry Volume K Unit Forecast, by Product Type 2019 & 2032
- Table 87: Global Ostomy Care Industry Revenue Million Forecast, by Surgery Type 2019 & 2032
- Table 88: Global Ostomy Care Industry Volume K Unit Forecast, by Surgery Type 2019 & 2032
- Table 89: Global Ostomy Care Industry Revenue Million Forecast, by End User 2019 & 2032
- Table 90: Global Ostomy Care Industry Volume K Unit Forecast, by End User 2019 & 2032
- Table 91: Global Ostomy Care Industry Revenue Million Forecast, by Country 2019 & 2032
- Table 92: Global Ostomy Care Industry Volume K Unit Forecast, by Country 2019 & 2032
- Table 93: South Africa Ostomy Care Industry Revenue (Million) Forecast, by Application 2019 & 2032
- Table 94: South Africa Ostomy Care Industry Volume (K Unit) Forecast, by Application 2019 & 2032
- Table 95: Rest of Middle East Ostomy Care Industry Revenue (Million) Forecast, by Application 2019 & 2032
- Table 96: Rest of Middle East Ostomy Care Industry Volume (K Unit) Forecast, by Application 2019 & 2032
- Table 97: Global Ostomy Care Industry Revenue Million Forecast, by Product Type 2019 & 2032
- Table 98: Global Ostomy Care Industry Volume K Unit Forecast, by Product Type 2019 & 2032
- Table 99: Global Ostomy Care Industry Revenue Million Forecast, by Surgery Type 2019 & 2032
- Table 100: Global Ostomy Care Industry Volume K Unit Forecast, by Surgery Type 2019 & 2032
- Table 101: Global Ostomy Care Industry Revenue Million Forecast, by End User 2019 & 2032
- Table 102: Global Ostomy Care Industry Volume K Unit Forecast, by End User 2019 & 2032
- Table 103: Global Ostomy Care Industry Revenue Million Forecast, by Country 2019 & 2032
- Table 104: Global Ostomy Care Industry Volume K Unit Forecast, by Country 2019 & 2032
- Table 105: Brazil Ostomy Care Industry Revenue (Million) Forecast, by Application 2019 & 2032
- Table 106: Brazil Ostomy Care Industry Volume (K Unit) Forecast, by Application 2019 & 2032
- Table 107: Argentina Ostomy Care Industry Revenue (Million) Forecast, by Application 2019 & 2032
- Table 108: Argentina Ostomy Care Industry Volume (K Unit) Forecast, by Application 2019 & 2032
- Table 109: Rest of South America Ostomy Care Industry Revenue (Million) Forecast, by Application 2019 & 2032
- Table 110: Rest of South America Ostomy Care Industry Volume (K Unit) Forecast, by Application 2019 & 2032
Frequently Asked Questions
1. What is the projected Compound Annual Growth Rate (CAGR) of the Ostomy Care Industry?
The projected CAGR is approximately 4.42%.
2. Which companies are prominent players in the Ostomy Care Industry?
Key companies in the market include Perma-Type Company Inc, Coloplast A/S, Cymed, Braun Melsungen AG, Nu-Hope Laboratories, ConvaTec Group Plc, Welland Medical Ltd, Hollister Inc, Marlen Manufacturing & Development Co, ALCARE Co Ltd, Torbot Group Inc, Salts Healthcare.
3. What are the main segments of the Ostomy Care Industry?
The market segments include Product Type, Surgery Type, End User.
4. Can you provide details about the market size?
The market size is estimated to be USD 3.32 Million as of 2022.
5. What are some drivers contributing to market growth?
Growing Prevalence of Inflammatory Bowel Diseases; Technological Advancements in the Arena of Ostomy Care; Increase in Initiatives to Raise Ostomy Awareness.
6. What are the notable trends driving market growth?
Ostomy Bags Segment is Expected to Exhibit a Significant Market Growth Over the Forecast Period.
7. Are there any restraints impacting market growth?
Risk of Skin Irritation and Infections.
8. Can you provide examples of recent developments in the market?
January 2023: OstomyCure, announced the complete patient recruitment milestone in the clinical trial its proprietary innovative titanium port TI,ES implant technology. TIES is an innovative titanium port implant that can be implanted within the stoma and attached to a lid to effectively close and open the stoma.
9. What pricing options are available for accessing the report?
Pricing options include single-user, multi-user, and enterprise licenses priced at USD 4750, USD 5250, and USD 8750 respectively.
10. Is the market size provided in terms of value or volume?
The market size is provided in terms of value, measured in Million and volume, measured in K Unit.
11. Are there any specific market keywords associated with the report?
Yes, the market keyword associated with the report is "Ostomy Care Industry," which aids in identifying and referencing the specific market segment covered.
12. How do I determine which pricing option suits my needs best?
The pricing options vary based on user requirements and access needs. Individual users may opt for single-user licenses, while businesses requiring broader access may choose multi-user or enterprise licenses for cost-effective access to the report.
13. Are there any additional resources or data provided in the Ostomy Care Industry report?
While the report offers comprehensive insights, it's advisable to review the specific contents or supplementary materials provided to ascertain if additional resources or data are available.
14. How can I stay updated on further developments or reports in the Ostomy Care Industry?
To stay informed about further developments, trends, and reports in the Ostomy Care Industry, consider subscribing to industry newsletters, following relevant companies and organizations, or regularly checking reputable industry news sources and publications.
Methodology
Step 1 - Identification of Relevant Samples Size from Population Database


Step 2 - Approaches for Defining Global Market Size (Value, Volume* & Price*)

Note*: In applicable scenarios
Step 3 - Data Sources
Primary Research
- Web Analytics
- Survey Reports
- Research Institute
- Latest Research Reports
- Opinion Leaders
Secondary Research
- Annual Reports
- White Paper
- Latest Press Release
- Industry Association
- Paid Database
- Investor Presentations

Step 4 - Data Triangulation
Involves using different sources of information in order to increase the validity of a study
These sources are likely to be stakeholders in a program - participants, other researchers, program staff, other community members, and so on.
Then we put all data in single framework & apply various statistical tools to find out the dynamic on the market.
During the analysis stage, feedback from the stakeholder groups would be compared to determine areas of agreement as well as areas of divergence


