
Key Insights
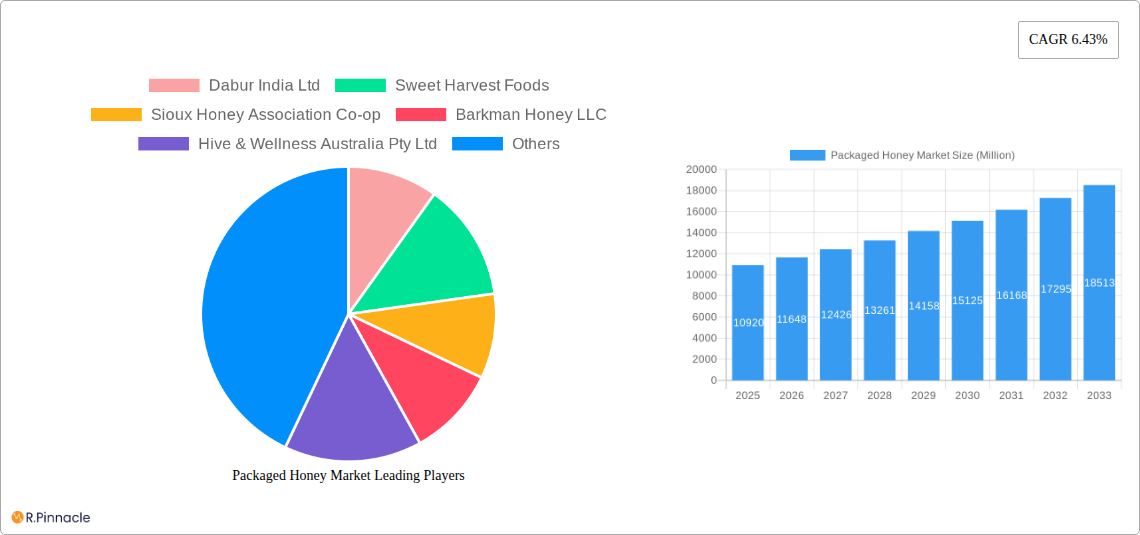
The global packaged honey market, valued at $10.92 billion in 2025, is projected to experience robust growth, driven by increasing consumer awareness of honey's health benefits and its versatile applications in food and beverages. This burgeoning demand is further fueled by the rising popularity of natural and organic food products, a trend that shows no signs of slowing. The market's expansion is also facilitated by the increasing adoption of convenient packaging formats, catering to modern lifestyles and consumer preferences. Key players like Dabur India Ltd, Patanjali Ayurved Limited, and McCormick & Company Inc are leveraging innovative product development and strategic marketing to capture significant market share. Growth is expected across various segments, including organic honey, flavored honey, and specialized honey products targeting specific health concerns. While logistical challenges and fluctuating honey prices present certain restraints, the overall market outlook remains optimistic, supported by consistent consumer preference and a strong trajectory for growth.
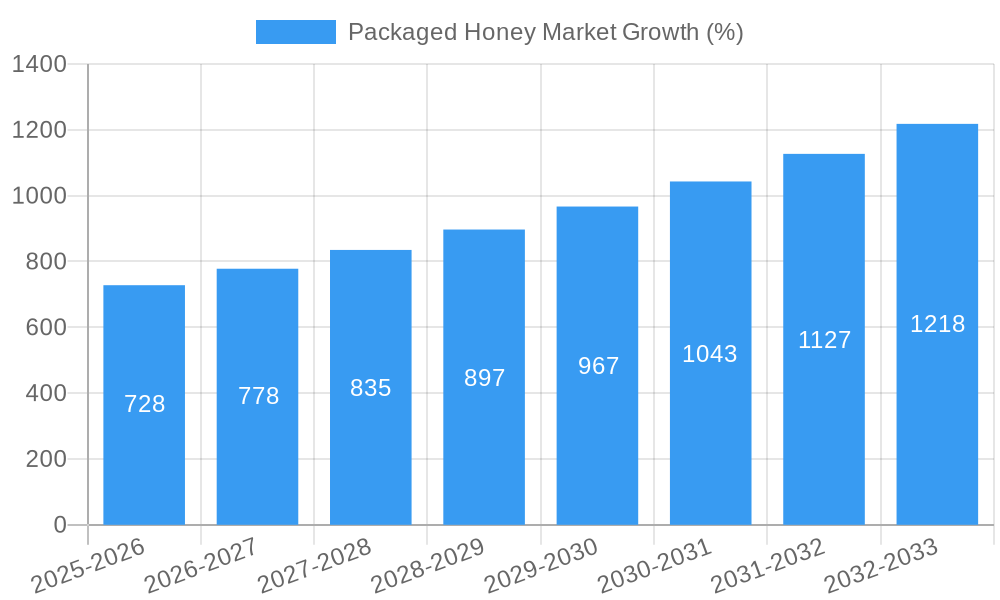
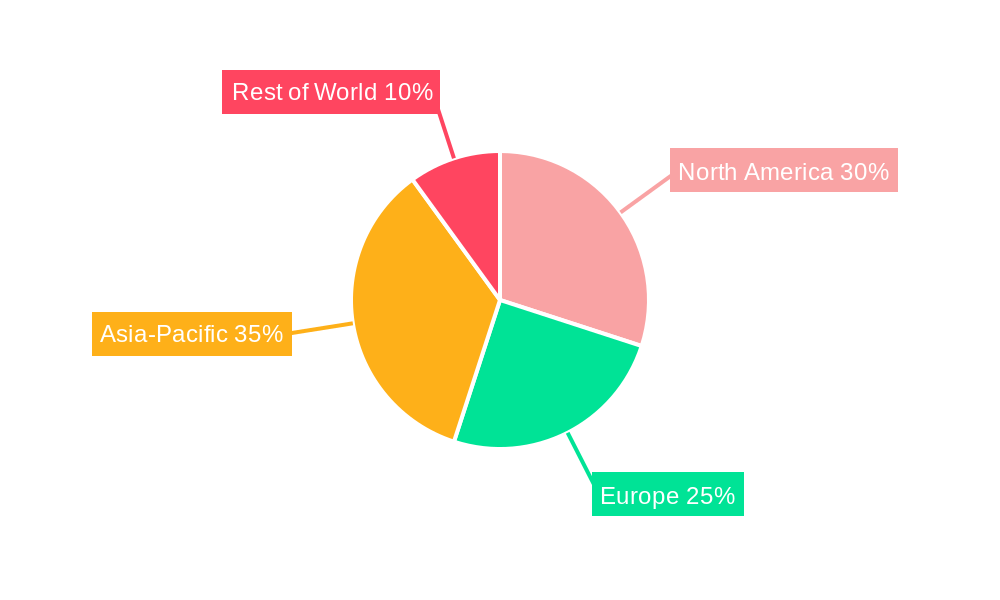
The projected Compound Annual Growth Rate (CAGR) of 6.43% from 2025 to 2033 indicates a substantial market expansion. This growth is likely to be distributed across different regions, with developed markets exhibiting steady growth and emerging economies showing higher growth potential due to rising disposable incomes and expanding middle classes. Competition is expected to intensify with both established players and new entrants focusing on product diversification, brand building, and strategic partnerships to gain a competitive edge. The market's future success hinges on maintaining sustainable honey production practices, ensuring product quality and authenticity, and effectively addressing consumer concerns regarding adulteration and traceability. Furthermore, focusing on innovative packaging solutions to enhance shelf life and appeal will be critical for continued growth.
Packaged Honey Market: A Comprehensive Report (2019-2033)
This in-depth report provides a comprehensive analysis of the Packaged Honey Market, offering invaluable insights for industry professionals, investors, and strategic decision-makers. Covering the period from 2019 to 2033, with a base year of 2025 and a forecast period of 2025-2033, this report leverages extensive data and expert analysis to illuminate current market dynamics and future growth trajectories. The report’s key findings are presented in an accessible format, enabling rapid comprehension and effective application. The market size is predicted to reach xx Million by 2033.
Packaged Honey Market Market Structure & Innovation Trends
This section analyzes the Packaged Honey Market's structure, highlighting key players, their market shares, and the influence of mergers and acquisitions (M&A) activities. We examine the innovative forces shaping the market, including technological advancements, regulatory changes, and the emergence of substitutes.
Market Concentration: The market exhibits a moderately concentrated structure, with the top 10 players, including Dabur India Ltd, Sweet Harvest Foods, Sioux Honey Association Co-op, Barkman Honey LLC, Hive & Wellness Australia Pty Ltd, Patanjali Ayurved Limited, Bright Food Group co Ltd, McCormick & Company Inc, The J M Smucker Company, and Apis Group, holding an estimated xx% of the market share in 2024. However, a significant number of smaller regional and niche players also contribute to the overall market volume.
Innovation Drivers: Consumer demand for organic, raw, and specialized honey varieties fuels innovation. Technological advancements in honey processing, packaging, and quality control are also major drivers. The rising popularity of honey-based functional foods and beverages presents significant opportunities for product diversification.
Regulatory Frameworks: Government regulations concerning food safety, labeling, and traceability significantly influence market practices. Variations in these regulations across different geographical regions impact market dynamics.
Product Substitutes: While honey has unique properties, some consumers consider alternatives like agave nectar, maple syrup, and artificial sweeteners. These substitutes pose a moderate competitive threat, particularly within specific market segments.
End-User Demographics: The primary end-users are consumers seeking natural sweeteners, health-conscious individuals, and food and beverage manufacturers. Growing awareness of honey's health benefits expands the market's end-user base.
M&A Activities: The past five years have seen a moderate level of M&A activity in the packaged honey market, with deal values ranging from xx Million to xx Million. These activities largely reflect efforts by larger players to expand their market share and product portfolios.
Packaged Honey Market Market Dynamics & Trends
This section delves into the market's growth drivers, technological disruptions, evolving consumer preferences, and the competitive landscape. We explore factors influencing market growth and provide a detailed analysis of market penetration and Compound Annual Growth Rate (CAGR). The global packaged honey market is expected to witness a CAGR of xx% during the forecast period (2025-2033).
(Paragraph detailing market growth drivers, technological disruptions, consumer preferences, and competitive dynamics with specific metrics like CAGR and market penetration will be inserted here. This section will be approximately 600 words.)
Dominant Regions & Segments in Packaged Honey Market
This section identifies the leading regions and market segments within the packaged honey market. We analyze the key drivers contributing to their dominance, including economic factors, infrastructure, and consumer behavior.
(Paragraph detailing the dominant region/country/segment analysis will be inserted here. This section will be approximately 600 words and will include bullet points for key drivers.)
Packaged Honey Market Product Innovations
Recent product innovations focus on enhancing convenience, catering to specific dietary needs, and improving shelf life. This includes the introduction of single-serve packs, organic honey varieties, and honey-based functional foods. Technological advancements in packaging, such as airtight containers and innovative dispensing mechanisms, are also impacting the market. The growing demand for specialty honeys, such as Manuka honey, and the rise of vegan honey alternatives are shaping product development strategies.
Report Scope & Segmentation Analysis
This report segments the Packaged Honey Market based on several parameters, including product type (e.g., raw honey, processed honey, flavored honey), packaging type (e.g., jars, squeeze bottles, pouches), distribution channel (e.g., supermarkets, online retailers, specialty stores), and geographic region. Growth projections, market sizes, and competitive dynamics are analyzed for each segment.
(Paragraph detailing the market segmentation, growth projections, market sizes, and competitive dynamics for each segment will be inserted here. This section will be approximately 150 words.)
Key Drivers of Packaged Honey Market Growth
The growth of the packaged honey market is propelled by several factors:
Rising Consumer Demand: Growing awareness of honey's health benefits and its use as a natural sweetener drives market growth.
Technological Advancements: Improved honey processing techniques and packaging innovations enhance product quality and shelf life.
Expanding Distribution Channels: Online retail and e-commerce platforms expand market reach and access.
Favorable Regulatory Environment: Supportive government policies related to food safety and labeling create a positive business environment.
Challenges in the Packaged Honey Market Sector
Several challenges hinder the market's growth:
Fluctuating Honey Prices: The price volatility of honey affects manufacturers' profitability and market stability.
Supply Chain Disruptions: Weather conditions, pest infestations, and geopolitical events can cause disruptions in the honey supply chain.
Intense Competition: The market's competitive landscape requires strategies to maintain market share and profitability.
Counterfeit Products: The presence of adulterated or counterfeit honey poses a challenge to consumer trust and market integrity.
Emerging Opportunities in Packaged Honey Market
The market presents several exciting opportunities:
Growth in Emerging Markets: Expanding into developing economies with rising consumer incomes and changing dietary patterns presents significant growth opportunities.
Innovation in Honey-Based Products: Developing new products utilizing honey's unique properties in various applications opens up new market segments.
Sustainable and Ethical Sourcing: Consumers are increasingly focused on the sustainability and ethical practices of honey production, creating an opportunity for companies to highlight sustainable sourcing methods.
Premiumization: Demand for premium honey varieties, such as organic, raw, and single-origin honeys, is driving market growth and profitability.
Leading Players in the Packaged Honey Market Market
- Dabur India Ltd
- Sweet Harvest Foods
- Sioux Honey Association Co-op
- Barkman Honey LLC
- Hive & Wellness Australia Pty Ltd
- Patanjali Ayurved Limited
- Bright Food Group co Ltd
- McCormick & Company Inc
- The J M Smucker Company
- Apis Group
- *List Not Exhaustive
Key Developments in Packaged Honey Market Industry
January 2024: Dabur India Ltd invested approximately INR 135 crore (approximately xx Million USD) in expanding its manufacturing facility in South India to boost production capacity for its honey and other products. This signifies a significant commitment to expanding its honey operations.
January 2024: APIS Honey launched Apis Organic Honey sourced from Kashmir, expanding its product portfolio and tapping into the growing demand for organic products.
December 2023: Better Foodie launched its vegan honey alternative in partnership with MeliBio, showcasing a significant innovation that addresses a niche market segment and potential consumer needs.
Future Outlook for Packaged Honey Market Market
The Packaged Honey Market is poised for continued growth, driven by increasing consumer demand, product innovation, and expanding distribution channels. Strategic opportunities exist in exploring niche market segments, developing sustainable sourcing practices, and enhancing product offerings to align with evolving consumer preferences. The market’s future growth trajectory is expected to be significantly influenced by technological advancements, changing dietary habits, and global economic trends.
Packaged Honey Market Segmentation
-
1. Product Category
- 1.1. Conventional
- 1.2. Organic
-
2. Packaging Type
- 2.1. Pet Bottles
- 2.2. Glass Jars
- 2.3. Other Packaging Types
Packaged Honey Market Segmentation By Geography
-
1. North America
- 1.1. United States
- 1.2. Canada
- 1.3. Mexico
- 1.4. Rest of North America
-
2. Europe
- 2.1. Germany
- 2.2. France
- 2.3. Russia
- 2.4. Spain
- 2.5. United Kingdom
- 2.6. Italy
- 2.7. Rest of Europe
-
3. Asia Pacific
- 3.1. India
- 3.2. China
- 3.3. Japan
- 3.4. Australia
- 3.5. Rest of Asia pacific
-
4. South America
- 4.1. Brazil
- 4.2. Argentina
- 4.3. Rest of South America
-
5. Middle East and Africa
- 5.1. United Arab Emirates
- 5.2. South Africa
- 5.3. Rest of Middle East
Packaged Honey Market REPORT HIGHLIGHTS
| Aspects | Details |
|---|---|
| Study Period | 2019-2033 |
| Base Year | 2024 |
| Estimated Year | 2025 |
| Forecast Period | 2025-2033 |
| Historical Period | 2019-2024 |
| Growth Rate | CAGR of 6.43% from 2019-2033 |
| Segmentation |
|
Table of Contents
- 1. Introduction
- 1.1. Research Scope
- 1.2. Market Segmentation
- 1.3. Research Methodology
- 1.4. Definitions and Assumptions
- 2. Executive Summary
- 2.1. Introduction
- 3. Market Dynamics
- 3.1. Introduction
- 3.2. Market Drivers
- 3.2.1. Increasing Demand for Natural Sweeteners; Government Initiatives Boost Honey Production and Beekeeping
- 3.3. Market Restrains
- 3.3.1. Increasing Demand for Natural Sweeteners; Government Initiatives Boost Honey Production and Beekeeping
- 3.4. Market Trends
- 3.4.1. Conventional Honey Is Consumed Globally
- 4. Market Factor Analysis
- 4.1. Porters Five Forces
- 4.2. Supply/Value Chain
- 4.3. PESTEL analysis
- 4.4. Market Entropy
- 4.5. Patent/Trademark Analysis
- 5. Global Packaged Honey Market Analysis, Insights and Forecast, 2019-2031
- 5.1. Market Analysis, Insights and Forecast - by Product Category
- 5.1.1. Conventional
- 5.1.2. Organic
- 5.2. Market Analysis, Insights and Forecast - by Packaging Type
- 5.2.1. Pet Bottles
- 5.2.2. Glass Jars
- 5.2.3. Other Packaging Types
- 5.3. Market Analysis, Insights and Forecast - by Region
- 5.3.1. North America
- 5.3.2. Europe
- 5.3.3. Asia Pacific
- 5.3.4. South America
- 5.3.5. Middle East and Africa
- 5.1. Market Analysis, Insights and Forecast - by Product Category
- 6. North America Packaged Honey Market Analysis, Insights and Forecast, 2019-2031
- 6.1. Market Analysis, Insights and Forecast - by Product Category
- 6.1.1. Conventional
- 6.1.2. Organic
- 6.2. Market Analysis, Insights and Forecast - by Packaging Type
- 6.2.1. Pet Bottles
- 6.2.2. Glass Jars
- 6.2.3. Other Packaging Types
- 6.1. Market Analysis, Insights and Forecast - by Product Category
- 7. Europe Packaged Honey Market Analysis, Insights and Forecast, 2019-2031
- 7.1. Market Analysis, Insights and Forecast - by Product Category
- 7.1.1. Conventional
- 7.1.2. Organic
- 7.2. Market Analysis, Insights and Forecast - by Packaging Type
- 7.2.1. Pet Bottles
- 7.2.2. Glass Jars
- 7.2.3. Other Packaging Types
- 7.1. Market Analysis, Insights and Forecast - by Product Category
- 8. Asia Pacific Packaged Honey Market Analysis, Insights and Forecast, 2019-2031
- 8.1. Market Analysis, Insights and Forecast - by Product Category
- 8.1.1. Conventional
- 8.1.2. Organic
- 8.2. Market Analysis, Insights and Forecast - by Packaging Type
- 8.2.1. Pet Bottles
- 8.2.2. Glass Jars
- 8.2.3. Other Packaging Types
- 8.1. Market Analysis, Insights and Forecast - by Product Category
- 9. South America Packaged Honey Market Analysis, Insights and Forecast, 2019-2031
- 9.1. Market Analysis, Insights and Forecast - by Product Category
- 9.1.1. Conventional
- 9.1.2. Organic
- 9.2. Market Analysis, Insights and Forecast - by Packaging Type
- 9.2.1. Pet Bottles
- 9.2.2. Glass Jars
- 9.2.3. Other Packaging Types
- 9.1. Market Analysis, Insights and Forecast - by Product Category
- 10. Middle East and Africa Packaged Honey Market Analysis, Insights and Forecast, 2019-2031
- 10.1. Market Analysis, Insights and Forecast - by Product Category
- 10.1.1. Conventional
- 10.1.2. Organic
- 10.2. Market Analysis, Insights and Forecast - by Packaging Type
- 10.2.1. Pet Bottles
- 10.2.2. Glass Jars
- 10.2.3. Other Packaging Types
- 10.1. Market Analysis, Insights and Forecast - by Product Category
- 11. Competitive Analysis
- 11.1. Global Market Share Analysis 2024
- 11.2. Company Profiles
- 11.2.1 Dabur India Ltd
- 11.2.1.1. Overview
- 11.2.1.2. Products
- 11.2.1.3. SWOT Analysis
- 11.2.1.4. Recent Developments
- 11.2.1.5. Financials (Based on Availability)
- 11.2.2 Sweet Harvest Foods
- 11.2.2.1. Overview
- 11.2.2.2. Products
- 11.2.2.3. SWOT Analysis
- 11.2.2.4. Recent Developments
- 11.2.2.5. Financials (Based on Availability)
- 11.2.3 Sioux Honey Association Co-op
- 11.2.3.1. Overview
- 11.2.3.2. Products
- 11.2.3.3. SWOT Analysis
- 11.2.3.4. Recent Developments
- 11.2.3.5. Financials (Based on Availability)
- 11.2.4 Barkman Honey LLC
- 11.2.4.1. Overview
- 11.2.4.2. Products
- 11.2.4.3. SWOT Analysis
- 11.2.4.4. Recent Developments
- 11.2.4.5. Financials (Based on Availability)
- 11.2.5 Hive & Wellness Australia Pty Ltd
- 11.2.5.1. Overview
- 11.2.5.2. Products
- 11.2.5.3. SWOT Analysis
- 11.2.5.4. Recent Developments
- 11.2.5.5. Financials (Based on Availability)
- 11.2.6 Patanjali Ayurved Limited
- 11.2.6.1. Overview
- 11.2.6.2. Products
- 11.2.6.3. SWOT Analysis
- 11.2.6.4. Recent Developments
- 11.2.6.5. Financials (Based on Availability)
- 11.2.7 Bright Food Group co Ltd
- 11.2.7.1. Overview
- 11.2.7.2. Products
- 11.2.7.3. SWOT Analysis
- 11.2.7.4. Recent Developments
- 11.2.7.5. Financials (Based on Availability)
- 11.2.8 Mccormick & Company Inc
- 11.2.8.1. Overview
- 11.2.8.2. Products
- 11.2.8.3. SWOT Analysis
- 11.2.8.4. Recent Developments
- 11.2.8.5. Financials (Based on Availability)
- 11.2.9 The J M Smucker Company
- 11.2.9.1. Overview
- 11.2.9.2. Products
- 11.2.9.3. SWOT Analysis
- 11.2.9.4. Recent Developments
- 11.2.9.5. Financials (Based on Availability)
- 11.2.10 Apis Group*List Not Exhaustive
- 11.2.10.1. Overview
- 11.2.10.2. Products
- 11.2.10.3. SWOT Analysis
- 11.2.10.4. Recent Developments
- 11.2.10.5. Financials (Based on Availability)
- 11.2.1 Dabur India Ltd
List of Figures
- Figure 1: Global Packaged Honey Market Revenue Breakdown (Million, %) by Region 2024 & 2032
- Figure 2: Global Packaged Honey Market Volume Breakdown (Billion, %) by Region 2024 & 2032
- Figure 3: North America Packaged Honey Market Revenue (Million), by Product Category 2024 & 2032
- Figure 4: North America Packaged Honey Market Volume (Billion), by Product Category 2024 & 2032
- Figure 5: North America Packaged Honey Market Revenue Share (%), by Product Category 2024 & 2032
- Figure 6: North America Packaged Honey Market Volume Share (%), by Product Category 2024 & 2032
- Figure 7: North America Packaged Honey Market Revenue (Million), by Packaging Type 2024 & 2032
- Figure 8: North America Packaged Honey Market Volume (Billion), by Packaging Type 2024 & 2032
- Figure 9: North America Packaged Honey Market Revenue Share (%), by Packaging Type 2024 & 2032
- Figure 10: North America Packaged Honey Market Volume Share (%), by Packaging Type 2024 & 2032
- Figure 11: North America Packaged Honey Market Revenue (Million), by Country 2024 & 2032
- Figure 12: North America Packaged Honey Market Volume (Billion), by Country 2024 & 2032
- Figure 13: North America Packaged Honey Market Revenue Share (%), by Country 2024 & 2032
- Figure 14: North America Packaged Honey Market Volume Share (%), by Country 2024 & 2032
- Figure 15: Europe Packaged Honey Market Revenue (Million), by Product Category 2024 & 2032
- Figure 16: Europe Packaged Honey Market Volume (Billion), by Product Category 2024 & 2032
- Figure 17: Europe Packaged Honey Market Revenue Share (%), by Product Category 2024 & 2032
- Figure 18: Europe Packaged Honey Market Volume Share (%), by Product Category 2024 & 2032
- Figure 19: Europe Packaged Honey Market Revenue (Million), by Packaging Type 2024 & 2032
- Figure 20: Europe Packaged Honey Market Volume (Billion), by Packaging Type 2024 & 2032
- Figure 21: Europe Packaged Honey Market Revenue Share (%), by Packaging Type 2024 & 2032
- Figure 22: Europe Packaged Honey Market Volume Share (%), by Packaging Type 2024 & 2032
- Figure 23: Europe Packaged Honey Market Revenue (Million), by Country 2024 & 2032
- Figure 24: Europe Packaged Honey Market Volume (Billion), by Country 2024 & 2032
- Figure 25: Europe Packaged Honey Market Revenue Share (%), by Country 2024 & 2032
- Figure 26: Europe Packaged Honey Market Volume Share (%), by Country 2024 & 2032
- Figure 27: Asia Pacific Packaged Honey Market Revenue (Million), by Product Category 2024 & 2032
- Figure 28: Asia Pacific Packaged Honey Market Volume (Billion), by Product Category 2024 & 2032
- Figure 29: Asia Pacific Packaged Honey Market Revenue Share (%), by Product Category 2024 & 2032
- Figure 30: Asia Pacific Packaged Honey Market Volume Share (%), by Product Category 2024 & 2032
- Figure 31: Asia Pacific Packaged Honey Market Revenue (Million), by Packaging Type 2024 & 2032
- Figure 32: Asia Pacific Packaged Honey Market Volume (Billion), by Packaging Type 2024 & 2032
- Figure 33: Asia Pacific Packaged Honey Market Revenue Share (%), by Packaging Type 2024 & 2032
- Figure 34: Asia Pacific Packaged Honey Market Volume Share (%), by Packaging Type 2024 & 2032
- Figure 35: Asia Pacific Packaged Honey Market Revenue (Million), by Country 2024 & 2032
- Figure 36: Asia Pacific Packaged Honey Market Volume (Billion), by Country 2024 & 2032
- Figure 37: Asia Pacific Packaged Honey Market Revenue Share (%), by Country 2024 & 2032
- Figure 38: Asia Pacific Packaged Honey Market Volume Share (%), by Country 2024 & 2032
- Figure 39: South America Packaged Honey Market Revenue (Million), by Product Category 2024 & 2032
- Figure 40: South America Packaged Honey Market Volume (Billion), by Product Category 2024 & 2032
- Figure 41: South America Packaged Honey Market Revenue Share (%), by Product Category 2024 & 2032
- Figure 42: South America Packaged Honey Market Volume Share (%), by Product Category 2024 & 2032
- Figure 43: South America Packaged Honey Market Revenue (Million), by Packaging Type 2024 & 2032
- Figure 44: South America Packaged Honey Market Volume (Billion), by Packaging Type 2024 & 2032
- Figure 45: South America Packaged Honey Market Revenue Share (%), by Packaging Type 2024 & 2032
- Figure 46: South America Packaged Honey Market Volume Share (%), by Packaging Type 2024 & 2032
- Figure 47: South America Packaged Honey Market Revenue (Million), by Country 2024 & 2032
- Figure 48: South America Packaged Honey Market Volume (Billion), by Country 2024 & 2032
- Figure 49: South America Packaged Honey Market Revenue Share (%), by Country 2024 & 2032
- Figure 50: South America Packaged Honey Market Volume Share (%), by Country 2024 & 2032
- Figure 51: Middle East and Africa Packaged Honey Market Revenue (Million), by Product Category 2024 & 2032
- Figure 52: Middle East and Africa Packaged Honey Market Volume (Billion), by Product Category 2024 & 2032
- Figure 53: Middle East and Africa Packaged Honey Market Revenue Share (%), by Product Category 2024 & 2032
- Figure 54: Middle East and Africa Packaged Honey Market Volume Share (%), by Product Category 2024 & 2032
- Figure 55: Middle East and Africa Packaged Honey Market Revenue (Million), by Packaging Type 2024 & 2032
- Figure 56: Middle East and Africa Packaged Honey Market Volume (Billion), by Packaging Type 2024 & 2032
- Figure 57: Middle East and Africa Packaged Honey Market Revenue Share (%), by Packaging Type 2024 & 2032
- Figure 58: Middle East and Africa Packaged Honey Market Volume Share (%), by Packaging Type 2024 & 2032
- Figure 59: Middle East and Africa Packaged Honey Market Revenue (Million), by Country 2024 & 2032
- Figure 60: Middle East and Africa Packaged Honey Market Volume (Billion), by Country 2024 & 2032
- Figure 61: Middle East and Africa Packaged Honey Market Revenue Share (%), by Country 2024 & 2032
- Figure 62: Middle East and Africa Packaged Honey Market Volume Share (%), by Country 2024 & 2032
List of Tables
- Table 1: Global Packaged Honey Market Revenue Million Forecast, by Region 2019 & 2032
- Table 2: Global Packaged Honey Market Volume Billion Forecast, by Region 2019 & 2032
- Table 3: Global Packaged Honey Market Revenue Million Forecast, by Product Category 2019 & 2032
- Table 4: Global Packaged Honey Market Volume Billion Forecast, by Product Category 2019 & 2032
- Table 5: Global Packaged Honey Market Revenue Million Forecast, by Packaging Type 2019 & 2032
- Table 6: Global Packaged Honey Market Volume Billion Forecast, by Packaging Type 2019 & 2032
- Table 7: Global Packaged Honey Market Revenue Million Forecast, by Region 2019 & 2032
- Table 8: Global Packaged Honey Market Volume Billion Forecast, by Region 2019 & 2032
- Table 9: Global Packaged Honey Market Revenue Million Forecast, by Product Category 2019 & 2032
- Table 10: Global Packaged Honey Market Volume Billion Forecast, by Product Category 2019 & 2032
- Table 11: Global Packaged Honey Market Revenue Million Forecast, by Packaging Type 2019 & 2032
- Table 12: Global Packaged Honey Market Volume Billion Forecast, by Packaging Type 2019 & 2032
- Table 13: Global Packaged Honey Market Revenue Million Forecast, by Country 2019 & 2032
- Table 14: Global Packaged Honey Market Volume Billion Forecast, by Country 2019 & 2032
- Table 15: United States Packaged Honey Market Revenue (Million) Forecast, by Application 2019 & 2032
- Table 16: United States Packaged Honey Market Volume (Billion) Forecast, by Application 2019 & 2032
- Table 17: Canada Packaged Honey Market Revenue (Million) Forecast, by Application 2019 & 2032
- Table 18: Canada Packaged Honey Market Volume (Billion) Forecast, by Application 2019 & 2032
- Table 19: Mexico Packaged Honey Market Revenue (Million) Forecast, by Application 2019 & 2032
- Table 20: Mexico Packaged Honey Market Volume (Billion) Forecast, by Application 2019 & 2032
- Table 21: Rest of North America Packaged Honey Market Revenue (Million) Forecast, by Application 2019 & 2032
- Table 22: Rest of North America Packaged Honey Market Volume (Billion) Forecast, by Application 2019 & 2032
- Table 23: Global Packaged Honey Market Revenue Million Forecast, by Product Category 2019 & 2032
- Table 24: Global Packaged Honey Market Volume Billion Forecast, by Product Category 2019 & 2032
- Table 25: Global Packaged Honey Market Revenue Million Forecast, by Packaging Type 2019 & 2032
- Table 26: Global Packaged Honey Market Volume Billion Forecast, by Packaging Type 2019 & 2032
- Table 27: Global Packaged Honey Market Revenue Million Forecast, by Country 2019 & 2032
- Table 28: Global Packaged Honey Market Volume Billion Forecast, by Country 2019 & 2032
- Table 29: Germany Packaged Honey Market Revenue (Million) Forecast, by Application 2019 & 2032
- Table 30: Germany Packaged Honey Market Volume (Billion) Forecast, by Application 2019 & 2032
- Table 31: France Packaged Honey Market Revenue (Million) Forecast, by Application 2019 & 2032
- Table 32: France Packaged Honey Market Volume (Billion) Forecast, by Application 2019 & 2032
- Table 33: Russia Packaged Honey Market Revenue (Million) Forecast, by Application 2019 & 2032
- Table 34: Russia Packaged Honey Market Volume (Billion) Forecast, by Application 2019 & 2032
- Table 35: Spain Packaged Honey Market Revenue (Million) Forecast, by Application 2019 & 2032
- Table 36: Spain Packaged Honey Market Volume (Billion) Forecast, by Application 2019 & 2032
- Table 37: United Kingdom Packaged Honey Market Revenue (Million) Forecast, by Application 2019 & 2032
- Table 38: United Kingdom Packaged Honey Market Volume (Billion) Forecast, by Application 2019 & 2032
- Table 39: Italy Packaged Honey Market Revenue (Million) Forecast, by Application 2019 & 2032
- Table 40: Italy Packaged Honey Market Volume (Billion) Forecast, by Application 2019 & 2032
- Table 41: Rest of Europe Packaged Honey Market Revenue (Million) Forecast, by Application 2019 & 2032
- Table 42: Rest of Europe Packaged Honey Market Volume (Billion) Forecast, by Application 2019 & 2032
- Table 43: Global Packaged Honey Market Revenue Million Forecast, by Product Category 2019 & 2032
- Table 44: Global Packaged Honey Market Volume Billion Forecast, by Product Category 2019 & 2032
- Table 45: Global Packaged Honey Market Revenue Million Forecast, by Packaging Type 2019 & 2032
- Table 46: Global Packaged Honey Market Volume Billion Forecast, by Packaging Type 2019 & 2032
- Table 47: Global Packaged Honey Market Revenue Million Forecast, by Country 2019 & 2032
- Table 48: Global Packaged Honey Market Volume Billion Forecast, by Country 2019 & 2032
- Table 49: India Packaged Honey Market Revenue (Million) Forecast, by Application 2019 & 2032
- Table 50: India Packaged Honey Market Volume (Billion) Forecast, by Application 2019 & 2032
- Table 51: China Packaged Honey Market Revenue (Million) Forecast, by Application 2019 & 2032
- Table 52: China Packaged Honey Market Volume (Billion) Forecast, by Application 2019 & 2032
- Table 53: Japan Packaged Honey Market Revenue (Million) Forecast, by Application 2019 & 2032
- Table 54: Japan Packaged Honey Market Volume (Billion) Forecast, by Application 2019 & 2032
- Table 55: Australia Packaged Honey Market Revenue (Million) Forecast, by Application 2019 & 2032
- Table 56: Australia Packaged Honey Market Volume (Billion) Forecast, by Application 2019 & 2032
- Table 57: Rest of Asia pacific Packaged Honey Market Revenue (Million) Forecast, by Application 2019 & 2032
- Table 58: Rest of Asia pacific Packaged Honey Market Volume (Billion) Forecast, by Application 2019 & 2032
- Table 59: Global Packaged Honey Market Revenue Million Forecast, by Product Category 2019 & 2032
- Table 60: Global Packaged Honey Market Volume Billion Forecast, by Product Category 2019 & 2032
- Table 61: Global Packaged Honey Market Revenue Million Forecast, by Packaging Type 2019 & 2032
- Table 62: Global Packaged Honey Market Volume Billion Forecast, by Packaging Type 2019 & 2032
- Table 63: Global Packaged Honey Market Revenue Million Forecast, by Country 2019 & 2032
- Table 64: Global Packaged Honey Market Volume Billion Forecast, by Country 2019 & 2032
- Table 65: Brazil Packaged Honey Market Revenue (Million) Forecast, by Application 2019 & 2032
- Table 66: Brazil Packaged Honey Market Volume (Billion) Forecast, by Application 2019 & 2032
- Table 67: Argentina Packaged Honey Market Revenue (Million) Forecast, by Application 2019 & 2032
- Table 68: Argentina Packaged Honey Market Volume (Billion) Forecast, by Application 2019 & 2032
- Table 69: Rest of South America Packaged Honey Market Revenue (Million) Forecast, by Application 2019 & 2032
- Table 70: Rest of South America Packaged Honey Market Volume (Billion) Forecast, by Application 2019 & 2032
- Table 71: Global Packaged Honey Market Revenue Million Forecast, by Product Category 2019 & 2032
- Table 72: Global Packaged Honey Market Volume Billion Forecast, by Product Category 2019 & 2032
- Table 73: Global Packaged Honey Market Revenue Million Forecast, by Packaging Type 2019 & 2032
- Table 74: Global Packaged Honey Market Volume Billion Forecast, by Packaging Type 2019 & 2032
- Table 75: Global Packaged Honey Market Revenue Million Forecast, by Country 2019 & 2032
- Table 76: Global Packaged Honey Market Volume Billion Forecast, by Country 2019 & 2032
- Table 77: United Arab Emirates Packaged Honey Market Revenue (Million) Forecast, by Application 2019 & 2032
- Table 78: United Arab Emirates Packaged Honey Market Volume (Billion) Forecast, by Application 2019 & 2032
- Table 79: South Africa Packaged Honey Market Revenue (Million) Forecast, by Application 2019 & 2032
- Table 80: South Africa Packaged Honey Market Volume (Billion) Forecast, by Application 2019 & 2032
- Table 81: Rest of Middle East Packaged Honey Market Revenue (Million) Forecast, by Application 2019 & 2032
- Table 82: Rest of Middle East Packaged Honey Market Volume (Billion) Forecast, by Application 2019 & 2032
Frequently Asked Questions
1. What is the projected Compound Annual Growth Rate (CAGR) of the Packaged Honey Market?
The projected CAGR is approximately 6.43%.
2. Which companies are prominent players in the Packaged Honey Market?
Key companies in the market include Dabur India Ltd, Sweet Harvest Foods, Sioux Honey Association Co-op, Barkman Honey LLC, Hive & Wellness Australia Pty Ltd, Patanjali Ayurved Limited, Bright Food Group co Ltd, Mccormick & Company Inc, The J M Smucker Company, Apis Group*List Not Exhaustive.
3. What are the main segments of the Packaged Honey Market?
The market segments include Product Category, Packaging Type.
4. Can you provide details about the market size?
The market size is estimated to be USD 10.92 Million as of 2022.
5. What are some drivers contributing to market growth?
Increasing Demand for Natural Sweeteners; Government Initiatives Boost Honey Production and Beekeeping.
6. What are the notable trends driving market growth?
Conventional Honey Is Consumed Globally.
7. Are there any restraints impacting market growth?
Increasing Demand for Natural Sweeteners; Government Initiatives Boost Honey Production and Beekeeping.
8. Can you provide examples of recent developments in the market?
January 2024: Dabur, one of the leading firms in the Ayurvedic and personal care space, recently invested approximately INR 135 crore in expanding its manufacturing facility in South India. This move is geared toward bolstering the production capacity of its flagship products, including Dabur Honey, Dabur Red Paste, and Odonil air fresheners.
9. What pricing options are available for accessing the report?
Pricing options include single-user, multi-user, and enterprise licenses priced at USD 4750, USD 5250, and USD 8750 respectively.
10. Is the market size provided in terms of value or volume?
The market size is provided in terms of value, measured in Million and volume, measured in Billion.
11. Are there any specific market keywords associated with the report?
Yes, the market keyword associated with the report is "Packaged Honey Market," which aids in identifying and referencing the specific market segment covered.
12. How do I determine which pricing option suits my needs best?
The pricing options vary based on user requirements and access needs. Individual users may opt for single-user licenses, while businesses requiring broader access may choose multi-user or enterprise licenses for cost-effective access to the report.
13. Are there any additional resources or data provided in the Packaged Honey Market report?
While the report offers comprehensive insights, it's advisable to review the specific contents or supplementary materials provided to ascertain if additional resources or data are available.
14. How can I stay updated on further developments or reports in the Packaged Honey Market?
To stay informed about further developments, trends, and reports in the Packaged Honey Market, consider subscribing to industry newsletters, following relevant companies and organizations, or regularly checking reputable industry news sources and publications.
Methodology
Step 1 - Identification of Relevant Samples Size from Population Database


Step 2 - Approaches for Defining Global Market Size (Value, Volume* & Price*)

Note*: In applicable scenarios
Step 3 - Data Sources
Primary Research
- Web Analytics
- Survey Reports
- Research Institute
- Latest Research Reports
- Opinion Leaders
Secondary Research
- Annual Reports
- White Paper
- Latest Press Release
- Industry Association
- Paid Database
- Investor Presentations

Step 4 - Data Triangulation
Involves using different sources of information in order to increase the validity of a study
These sources are likely to be stakeholders in a program - participants, other researchers, program staff, other community members, and so on.
Then we put all data in single framework & apply various statistical tools to find out the dynamic on the market.
During the analysis stage, feedback from the stakeholder groups would be compared to determine areas of agreement as well as areas of divergence


