
Key Insights
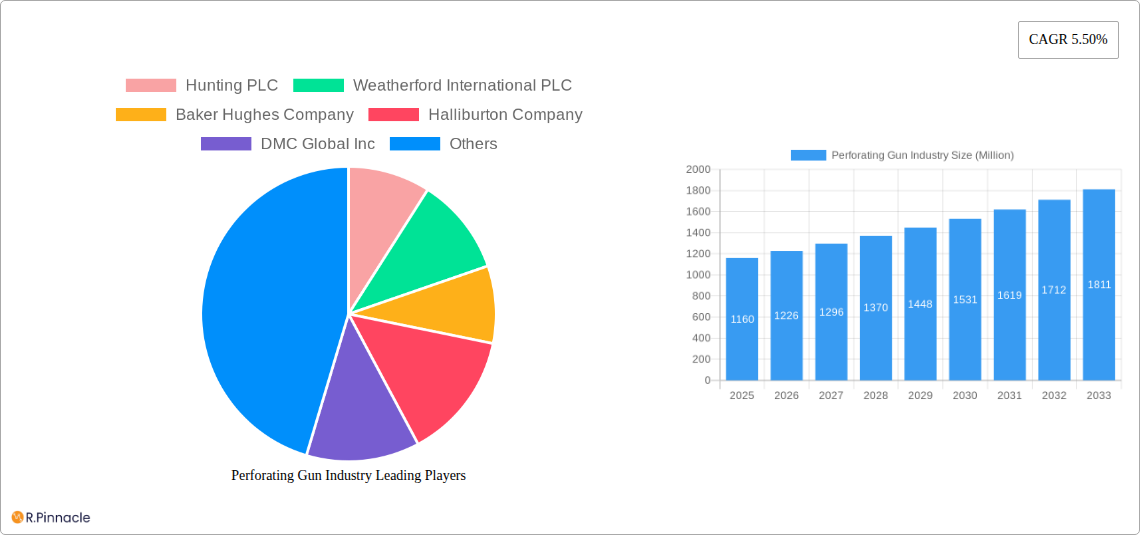
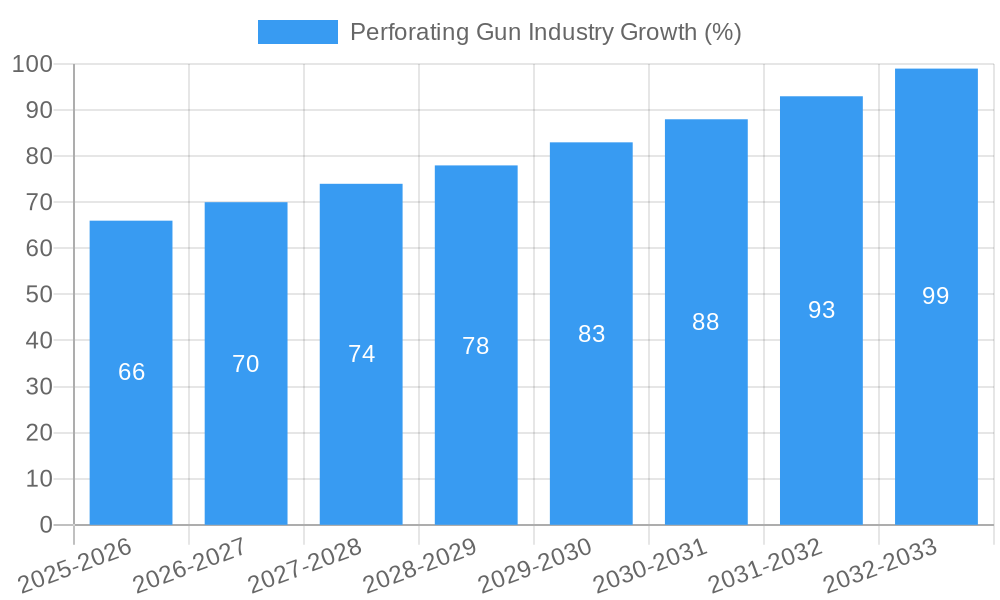
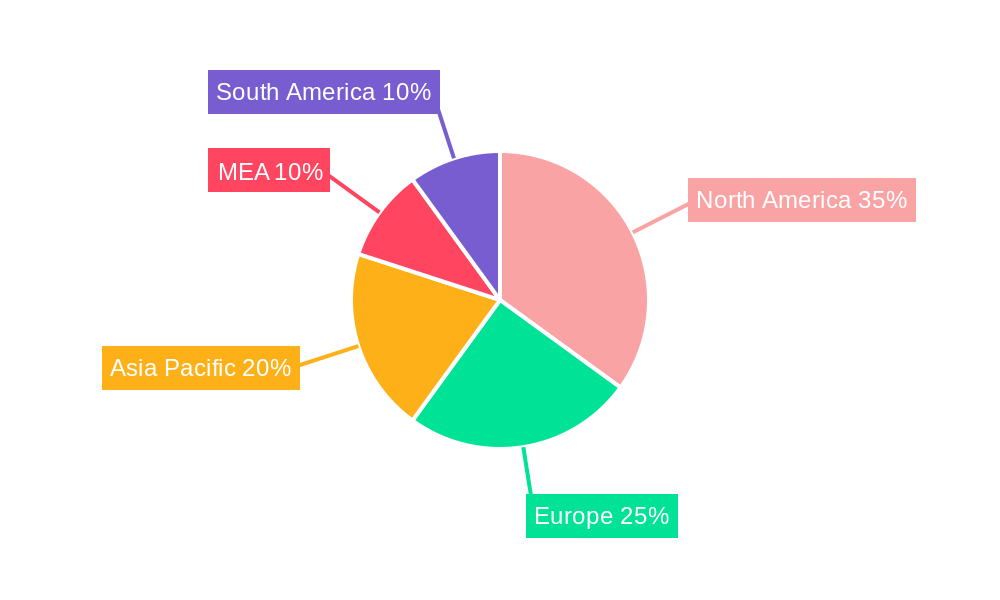
The global perforating gun market, valued at $1.16 billion in 2025, is projected to experience robust growth, driven by increasing oil and gas exploration and production activities worldwide. A Compound Annual Growth Rate (CAGR) of 5.50% from 2025 to 2033 indicates a significant expansion of this market. Several factors contribute to this growth. The ongoing shift towards horizontal and deviated well drilling techniques necessitates advanced perforating gun technologies for optimal reservoir access. The demand for higher efficiency and precision in perforating operations is driving innovation in carrier types, including expandable shaped charged guns, which offer superior performance compared to traditional hollow carriers. Furthermore, advancements in explosive types like RDX, HMX, and HNS, are leading to improved perforation quality and reduced environmental impact. However, fluctuating oil and gas prices, stringent environmental regulations, and the inherent risks associated with well completion operations pose challenges to market growth. The market is segmented by carrier type, explosive type, and well type, with North America, Europe, and Asia Pacific representing the key regional markets, reflecting significant oil and gas production activities in these areas. Major players like Halliburton, Schlumberger, and Baker Hughes dominate the market, competing based on technological advancements, service offerings, and global reach. The market's future trajectory is tied to global energy demands, technological breakthroughs in well completion technologies, and the evolving regulatory landscape.
The competitive landscape is characterized by the presence of both large multinational corporations and specialized smaller companies. These companies engage in continuous research and development efforts to improve the performance, efficiency, and safety of perforating guns. This includes advancements in explosive formulations, carrier designs, and deployment techniques. The market's geographical distribution is influenced by the location of oil and gas reserves and the level of exploration and production activity in different regions. North America and the Middle East & Africa regions, known for substantial oil and gas reserves and a high level of activity in the sector, are expected to dominate market share, while the Asia-Pacific region shows promising growth potential driven by increasing energy demand and exploration efforts. The market’s growth is further influenced by government policies and regulations concerning environmental protection and safety standards in oil and gas operations.
Perforating Gun Industry: A Comprehensive Market Report (2019-2033)
This comprehensive report provides an in-depth analysis of the Perforating Gun Industry, offering invaluable insights for industry professionals, investors, and strategic decision-makers. With a study period spanning 2019-2033 (base year 2025, forecast period 2025-2033), this report unveils the market's dynamics, key players, and future growth potential. The global market size is projected to reach xx Million by 2033, exhibiting a CAGR of xx% during the forecast period.
Perforating Gun Industry Market Structure & Innovation Trends
The Perforating Gun market is moderately concentrated, with key players holding significant market share. Hunting PLC, Weatherford International PLC, Baker Hughes Company, Halliburton Company, DMC Global Inc, Schlumberger Limited, DynaEnergetics GmbH & Co KG, NOV Inc, Core Laboratories NV, and China Shaanxi FYPE Rigid Machinery Co Ltd are some of the major players, though the market is not exhaustive. Market share analysis indicates that the top 6 players collectively hold approximately 64% of the market. Innovation is driven by the need for enhanced efficiency, reduced operational costs, and improved well performance in challenging environments. Regulatory frameworks, including environmental regulations and safety standards, play a significant role in shaping market dynamics. Product substitutes are limited, primarily focusing on alternative well completion techniques. M&A activities have been relatively moderate in recent years, with deal values totaling approximately xx Million in the past five years. End-user demographics include oil and gas exploration and production companies globally, with a concentration in North America, the Middle East, and Asia-Pacific.
- Market Concentration: Moderately concentrated, top 6 players hold ~64% market share.
- Innovation Drivers: Enhanced efficiency, reduced costs, improved well performance.
- Regulatory Framework: Environmental regulations and safety standards are key.
- M&A Activity: Moderate activity, with total deal values of approximately xx Million over the past five years.
Perforating Gun Industry Market Dynamics & Trends
The Perforating Gun market is experiencing steady growth, driven primarily by increasing global oil and gas exploration and production activities, particularly in unconventional resources like shale gas and tight oil. Technological advancements, such as the development of more efficient and versatile perforating guns, contribute significantly to market expansion. Consumer preference leans towards higher performance, reliability, and cost-effectiveness. Competitive dynamics are intense, with companies focusing on product differentiation, technological innovation, and strategic partnerships. The market is witnessing increasing penetration of advanced technologies, such as expandable shaped charge guns and sophisticated well completion techniques. Specific metrics indicate a strong positive correlation between global oil and gas production and the demand for perforating guns.
Dominant Regions & Segments in Perforating Gun Industry
North America currently holds the largest market share in the Perforating Gun industry, driven by robust oil and gas exploration and production activities in the region, particularly in the United States and Canada. The strong presence of major oilfield service companies and supportive government policies contribute to its dominance. Within segments, the Expandable Shaped Charge Gun type holds the largest market share, followed by Hollow Carrier. Horizontal and deviated wells represent the largest share of well type applications.
- Key Drivers in North America:
- Robust oil and gas exploration and production activities.
- Strong presence of major oilfield service companies.
- Supportive government policies.
- Dominant Segments:
- Carrier Type: Expandable Shaped Charge Guns > Hollow Carrier > Other Carrier Types
- Explosive Type: Cyclotrimethylene Trinitramine (RDX) > Cyclotetramethylene Trinitramine (HMX) > Hexanitrosilbene (HNS)
- Well Type: Horizontal and Deviated Wells > Vertical Wells
Perforating Gun Industry Product Innovations
Recent innovations focus on enhancing perforation efficiency, reducing operational costs, and improving well productivity. The development of more compact and self-orienting perforating guns, like DynaEnergetics' DS Gravity 2.0, showcases this trend. These innovations address industry needs for improved accuracy, reduced non-productive time, and increased profitability. The market is also seeing increased focus on environmentally friendly and safer explosives.
Report Scope & Segmentation Analysis
This report comprehensively analyzes the Perforating Gun market across various segments:
- Carrier Type: Hollow Carrier, Expandable Shaped Charged Gun, Other Carrier Types (Growth projections vary significantly based on technological advancements and market demand).
- Explosive Type: Cyclotrimethylene Trinitramine (RDX), Cyclotetramethylene Trinitramine (HMX), Hexanitrosilbene (HNS) (Market size and growth are closely linked to the types of wells being perforated and regulatory standards)
- Well Type: Horizontal and Deviated Well, Vertical Well (Horizontal and deviated well segment is showing faster growth than the vertical well segment, driven by increasing unconventional resource exploration)
Key Drivers of Perforating Gun Industry Growth
Growth is primarily driven by the increasing demand for oil and gas globally. Technological advancements, such as the development of more efficient and versatile perforating guns, further fuel market expansion. Government policies supporting oil and gas exploration and production in various regions also contribute. The exploration and development of unconventional resources, like shale gas and tight oil, create a significant demand for advanced perforating gun technologies.
Challenges in the Perforating Gun Industry Sector
Challenges include fluctuating oil and gas prices, impacting investment decisions and demand. Stringent environmental regulations and safety standards present compliance challenges. Supply chain disruptions can affect the availability of raw materials and components, potentially leading to increased production costs and delays. Intense competition among major players necessitates continuous innovation and cost optimization.
Emerging Opportunities in Perforating Gun Industry
Emerging opportunities lie in the development of more sustainable and environmentally friendly perforating technologies. Expanding into new markets, particularly in developing economies with growing energy demands, presents significant growth potential. The increasing adoption of digital technologies, such as advanced data analytics and remote operations, offers opportunities for enhanced efficiency and cost optimization.
Leading Players in the Perforating Gun Industry Market
- Hunting PLC
- Weatherford International PLC
- Baker Hughes Company
- Halliburton Company
- DMC Global Inc
- Schlumberger Limited
- DynaEnergetics GmbH & Co KG
- NOV Inc
- Core Laboratories NV
- China Shaanxi FYPE Rigid Machinery Co Ltd
Key Developments in Perforating Gun Industry
- July 2023: DynaEnergetics unveils DS Gravity 2.0, a compact, self-orienting perforating gun enhancing efficiency and profitability.
- April 2023: VIGOR ships a new batch of perforating guns to Southeast Asia for deployment in Malaysia, Indonesia, Vietnam, Laos, and other locations.
Future Outlook for Perforating Gun Industry Market
The Perforating Gun market is poised for continued growth, driven by sustained demand for oil and gas, technological advancements, and exploration in unconventional resources. Strategic partnerships and collaborations among companies will be crucial for capturing market share and developing innovative solutions. The focus on sustainability and environmental responsibility will also shape future market trends.
Perforating Gun Industry Segmentation
-
1. Carrier Type
- 1.1. Hollow Carrier
- 1.2. Expandable Shaped Charged Gun
- 1.3. Other Carrier Types
-
2. Explosive Type
- 2.1. Cyclotrimethylene Trinitramine (RDX)
- 2.2. Cyclotetramethylene Trinitramine (HMX)
- 2.3. Hexanitrosilbene (HNS)
-
3. Well Type
- 3.1. Horizontal and Deviated Well
- 3.2. Vertical Well
Perforating Gun Industry Segmentation By Geography
-
1. North America
- 1.1. United States
- 1.2. Canada
- 1.3. Rest of North America
-
2. Europe
- 2.1. Norway
- 2.2. United Kingdom
- 2.3. Russia
- 2.4. Rest of Europe
-
3. Asia Pacific
- 3.1. China
- 3.2. India
- 3.3. Indoensia
- 3.4. Malaysia
- 3.5. Rest of Asia Pacific
-
4. South America
- 4.1. Chile
- 4.2. Brazil
- 4.3. Argentina
- 4.4. Rest of South Africa
- 5. Middle East
-
6. United Arab Emirates
- 6.1. Saudi Arabia
- 6.2. South Afica
- 6.3. Egypt
- 6.4. Nigeria
- 6.5. Rest of Middle East
Perforating Gun Industry REPORT HIGHLIGHTS
| Aspects | Details |
|---|---|
| Study Period | 2019-2033 |
| Base Year | 2024 |
| Estimated Year | 2025 |
| Forecast Period | 2025-2033 |
| Historical Period | 2019-2024 |
| Growth Rate | CAGR of 5.50% from 2019-2033 |
| Segmentation |
|
Table of Contents
- 1. Introduction
- 1.1. Research Scope
- 1.2. Market Segmentation
- 1.3. Research Methodology
- 1.4. Definitions and Assumptions
- 2. Executive Summary
- 2.1. Introduction
- 3. Market Dynamics
- 3.1. Introduction
- 3.2. Market Drivers
- 3.2.1. 4.; Rise In Oil And Gas Drilling Activities And Associated Investments4.; Technological Developments In Perforating Gun Systems
- 3.3. Market Restrains
- 3.3.1. 4.; Increased Focus On Renewable Energy Technologies To Fulfill Rising Energy Demand
- 3.4. Market Trends
- 3.4.1. Horizontal and Deviated Well Segment to Dominate the Market
- 4. Market Factor Analysis
- 4.1. Porters Five Forces
- 4.2. Supply/Value Chain
- 4.3. PESTEL analysis
- 4.4. Market Entropy
- 4.5. Patent/Trademark Analysis
- 5. Global Perforating Gun Industry Analysis, Insights and Forecast, 2019-2031
- 5.1. Market Analysis, Insights and Forecast - by Carrier Type
- 5.1.1. Hollow Carrier
- 5.1.2. Expandable Shaped Charged Gun
- 5.1.3. Other Carrier Types
- 5.2. Market Analysis, Insights and Forecast - by Explosive Type
- 5.2.1. Cyclotrimethylene Trinitramine (RDX)
- 5.2.2. Cyclotetramethylene Trinitramine (HMX)
- 5.2.3. Hexanitrosilbene (HNS)
- 5.3. Market Analysis, Insights and Forecast - by Well Type
- 5.3.1. Horizontal and Deviated Well
- 5.3.2. Vertical Well
- 5.4. Market Analysis, Insights and Forecast - by Region
- 5.4.1. North America
- 5.4.2. Europe
- 5.4.3. Asia Pacific
- 5.4.4. South America
- 5.4.5. Middle East
- 5.4.6. United Arab Emirates
- 5.1. Market Analysis, Insights and Forecast - by Carrier Type
- 6. North America Perforating Gun Industry Analysis, Insights and Forecast, 2019-2031
- 6.1. Market Analysis, Insights and Forecast - by Carrier Type
- 6.1.1. Hollow Carrier
- 6.1.2. Expandable Shaped Charged Gun
- 6.1.3. Other Carrier Types
- 6.2. Market Analysis, Insights and Forecast - by Explosive Type
- 6.2.1. Cyclotrimethylene Trinitramine (RDX)
- 6.2.2. Cyclotetramethylene Trinitramine (HMX)
- 6.2.3. Hexanitrosilbene (HNS)
- 6.3. Market Analysis, Insights and Forecast - by Well Type
- 6.3.1. Horizontal and Deviated Well
- 6.3.2. Vertical Well
- 6.1. Market Analysis, Insights and Forecast - by Carrier Type
- 7. Europe Perforating Gun Industry Analysis, Insights and Forecast, 2019-2031
- 7.1. Market Analysis, Insights and Forecast - by Carrier Type
- 7.1.1. Hollow Carrier
- 7.1.2. Expandable Shaped Charged Gun
- 7.1.3. Other Carrier Types
- 7.2. Market Analysis, Insights and Forecast - by Explosive Type
- 7.2.1. Cyclotrimethylene Trinitramine (RDX)
- 7.2.2. Cyclotetramethylene Trinitramine (HMX)
- 7.2.3. Hexanitrosilbene (HNS)
- 7.3. Market Analysis, Insights and Forecast - by Well Type
- 7.3.1. Horizontal and Deviated Well
- 7.3.2. Vertical Well
- 7.1. Market Analysis, Insights and Forecast - by Carrier Type
- 8. Asia Pacific Perforating Gun Industry Analysis, Insights and Forecast, 2019-2031
- 8.1. Market Analysis, Insights and Forecast - by Carrier Type
- 8.1.1. Hollow Carrier
- 8.1.2. Expandable Shaped Charged Gun
- 8.1.3. Other Carrier Types
- 8.2. Market Analysis, Insights and Forecast - by Explosive Type
- 8.2.1. Cyclotrimethylene Trinitramine (RDX)
- 8.2.2. Cyclotetramethylene Trinitramine (HMX)
- 8.2.3. Hexanitrosilbene (HNS)
- 8.3. Market Analysis, Insights and Forecast - by Well Type
- 8.3.1. Horizontal and Deviated Well
- 8.3.2. Vertical Well
- 8.1. Market Analysis, Insights and Forecast - by Carrier Type
- 9. South America Perforating Gun Industry Analysis, Insights and Forecast, 2019-2031
- 9.1. Market Analysis, Insights and Forecast - by Carrier Type
- 9.1.1. Hollow Carrier
- 9.1.2. Expandable Shaped Charged Gun
- 9.1.3. Other Carrier Types
- 9.2. Market Analysis, Insights and Forecast - by Explosive Type
- 9.2.1. Cyclotrimethylene Trinitramine (RDX)
- 9.2.2. Cyclotetramethylene Trinitramine (HMX)
- 9.2.3. Hexanitrosilbene (HNS)
- 9.3. Market Analysis, Insights and Forecast - by Well Type
- 9.3.1. Horizontal and Deviated Well
- 9.3.2. Vertical Well
- 9.1. Market Analysis, Insights and Forecast - by Carrier Type
- 10. Middle East Perforating Gun Industry Analysis, Insights and Forecast, 2019-2031
- 10.1. Market Analysis, Insights and Forecast - by Carrier Type
- 10.1.1. Hollow Carrier
- 10.1.2. Expandable Shaped Charged Gun
- 10.1.3. Other Carrier Types
- 10.2. Market Analysis, Insights and Forecast - by Explosive Type
- 10.2.1. Cyclotrimethylene Trinitramine (RDX)
- 10.2.2. Cyclotetramethylene Trinitramine (HMX)
- 10.2.3. Hexanitrosilbene (HNS)
- 10.3. Market Analysis, Insights and Forecast - by Well Type
- 10.3.1. Horizontal and Deviated Well
- 10.3.2. Vertical Well
- 10.1. Market Analysis, Insights and Forecast - by Carrier Type
- 11. United Arab Emirates Perforating Gun Industry Analysis, Insights and Forecast, 2019-2031
- 11.1. Market Analysis, Insights and Forecast - by Carrier Type
- 11.1.1. Hollow Carrier
- 11.1.2. Expandable Shaped Charged Gun
- 11.1.3. Other Carrier Types
- 11.2. Market Analysis, Insights and Forecast - by Explosive Type
- 11.2.1. Cyclotrimethylene Trinitramine (RDX)
- 11.2.2. Cyclotetramethylene Trinitramine (HMX)
- 11.2.3. Hexanitrosilbene (HNS)
- 11.3. Market Analysis, Insights and Forecast - by Well Type
- 11.3.1. Horizontal and Deviated Well
- 11.3.2. Vertical Well
- 11.1. Market Analysis, Insights and Forecast - by Carrier Type
- 12. North America Perforating Gun Industry Analysis, Insights and Forecast, 2019-2031
- 12.1. Market Analysis, Insights and Forecast - By Country/Sub-region
- 12.1.1 United States
- 12.1.2 Canada
- 12.1.3 Mexico
- 13. Europe Perforating Gun Industry Analysis, Insights and Forecast, 2019-2031
- 13.1. Market Analysis, Insights and Forecast - By Country/Sub-region
- 13.1.1 Germany
- 13.1.2 United Kingdom
- 13.1.3 France
- 13.1.4 Spain
- 13.1.5 Italy
- 13.1.6 Spain
- 13.1.7 Belgium
- 13.1.8 Netherland
- 13.1.9 Nordics
- 13.1.10 Rest of Europe
- 14. Asia Pacific Perforating Gun Industry Analysis, Insights and Forecast, 2019-2031
- 14.1. Market Analysis, Insights and Forecast - By Country/Sub-region
- 14.1.1 China
- 14.1.2 Japan
- 14.1.3 India
- 14.1.4 South Korea
- 14.1.5 Southeast Asia
- 14.1.6 Australia
- 14.1.7 Indonesia
- 14.1.8 Phillipes
- 14.1.9 Singapore
- 14.1.10 Thailandc
- 14.1.11 Rest of Asia Pacific
- 15. South America Perforating Gun Industry Analysis, Insights and Forecast, 2019-2031
- 15.1. Market Analysis, Insights and Forecast - By Country/Sub-region
- 15.1.1 Brazil
- 15.1.2 Argentina
- 15.1.3 Peru
- 15.1.4 Chile
- 15.1.5 Colombia
- 15.1.6 Ecuador
- 15.1.7 Venezuela
- 15.1.8 Rest of South America
- 16. North America Perforating Gun Industry Analysis, Insights and Forecast, 2019-2031
- 16.1. Market Analysis, Insights and Forecast - By Country/Sub-region
- 16.1.1 United States
- 16.1.2 Canada
- 16.1.3 Mexico
- 17. MEA Perforating Gun Industry Analysis, Insights and Forecast, 2019-2031
- 17.1. Market Analysis, Insights and Forecast - By Country/Sub-region
- 17.1.1 United Arab Emirates
- 17.1.2 Saudi Arabia
- 17.1.3 South Africa
- 17.1.4 Rest of Middle East and Africa
- 18. Competitive Analysis
- 18.1. Global Market Share Analysis 2024
- 18.2. Company Profiles
- 18.2.1 Hunting PLC
- 18.2.1.1. Overview
- 18.2.1.2. Products
- 18.2.1.3. SWOT Analysis
- 18.2.1.4. Recent Developments
- 18.2.1.5. Financials (Based on Availability)
- 18.2.2 Weatherford International PLC
- 18.2.2.1. Overview
- 18.2.2.2. Products
- 18.2.2.3. SWOT Analysis
- 18.2.2.4. Recent Developments
- 18.2.2.5. Financials (Based on Availability)
- 18.2.3 Baker Hughes Company
- 18.2.3.1. Overview
- 18.2.3.2. Products
- 18.2.3.3. SWOT Analysis
- 18.2.3.4. Recent Developments
- 18.2.3.5. Financials (Based on Availability)
- 18.2.4 Halliburton Company
- 18.2.4.1. Overview
- 18.2.4.2. Products
- 18.2.4.3. SWOT Analysis
- 18.2.4.4. Recent Developments
- 18.2.4.5. Financials (Based on Availability)
- 18.2.5 DMC Global Inc
- 18.2.5.1. Overview
- 18.2.5.2. Products
- 18.2.5.3. SWOT Analysis
- 18.2.5.4. Recent Developments
- 18.2.5.5. Financials (Based on Availability)
- 18.2.6 Schlumberger Limited
- 18.2.6.1. Overview
- 18.2.6.2. Products
- 18.2.6.3. SWOT Analysis
- 18.2.6.4. Recent Developments
- 18.2.6.5. Financials (Based on Availability)
- 18.2.7 DynaEnergetics GmbH & Co KG
- 18.2.7.1. Overview
- 18.2.7.2. Products
- 18.2.7.3. SWOT Analysis
- 18.2.7.4. Recent Developments
- 18.2.7.5. Financials (Based on Availability)
- 18.2.8 NOV Inc
- 18.2.8.1. Overview
- 18.2.8.2. Products
- 18.2.8.3. SWOT Analysis
- 18.2.8.4. Recent Developments
- 18.2.8.5. Financials (Based on Availability)
- 18.2.9 Core Laboratories NV*List Not Exhaustive 6 4 Market Ranking/Share (%) Analysi
- 18.2.9.1. Overview
- 18.2.9.2. Products
- 18.2.9.3. SWOT Analysis
- 18.2.9.4. Recent Developments
- 18.2.9.5. Financials (Based on Availability)
- 18.2.10 China Shaanxi FYPE Rigid Machinery Co Ltd
- 18.2.10.1. Overview
- 18.2.10.2. Products
- 18.2.10.3. SWOT Analysis
- 18.2.10.4. Recent Developments
- 18.2.10.5. Financials (Based on Availability)
- 18.2.1 Hunting PLC
List of Figures
- Figure 1: Global Perforating Gun Industry Revenue Breakdown (Million, %) by Region 2024 & 2032
- Figure 2: Global Perforating Gun Industry Volume Breakdown (K Unit, %) by Region 2024 & 2032
- Figure 3: North America Perforating Gun Industry Revenue (Million), by Country 2024 & 2032
- Figure 4: North America Perforating Gun Industry Volume (K Unit), by Country 2024 & 2032
- Figure 5: North America Perforating Gun Industry Revenue Share (%), by Country 2024 & 2032
- Figure 6: North America Perforating Gun Industry Volume Share (%), by Country 2024 & 2032
- Figure 7: Europe Perforating Gun Industry Revenue (Million), by Country 2024 & 2032
- Figure 8: Europe Perforating Gun Industry Volume (K Unit), by Country 2024 & 2032
- Figure 9: Europe Perforating Gun Industry Revenue Share (%), by Country 2024 & 2032
- Figure 10: Europe Perforating Gun Industry Volume Share (%), by Country 2024 & 2032
- Figure 11: Asia Pacific Perforating Gun Industry Revenue (Million), by Country 2024 & 2032
- Figure 12: Asia Pacific Perforating Gun Industry Volume (K Unit), by Country 2024 & 2032
- Figure 13: Asia Pacific Perforating Gun Industry Revenue Share (%), by Country 2024 & 2032
- Figure 14: Asia Pacific Perforating Gun Industry Volume Share (%), by Country 2024 & 2032
- Figure 15: South America Perforating Gun Industry Revenue (Million), by Country 2024 & 2032
- Figure 16: South America Perforating Gun Industry Volume (K Unit), by Country 2024 & 2032
- Figure 17: South America Perforating Gun Industry Revenue Share (%), by Country 2024 & 2032
- Figure 18: South America Perforating Gun Industry Volume Share (%), by Country 2024 & 2032
- Figure 19: North America Perforating Gun Industry Revenue (Million), by Country 2024 & 2032
- Figure 20: North America Perforating Gun Industry Volume (K Unit), by Country 2024 & 2032
- Figure 21: North America Perforating Gun Industry Revenue Share (%), by Country 2024 & 2032
- Figure 22: North America Perforating Gun Industry Volume Share (%), by Country 2024 & 2032
- Figure 23: MEA Perforating Gun Industry Revenue (Million), by Country 2024 & 2032
- Figure 24: MEA Perforating Gun Industry Volume (K Unit), by Country 2024 & 2032
- Figure 25: MEA Perforating Gun Industry Revenue Share (%), by Country 2024 & 2032
- Figure 26: MEA Perforating Gun Industry Volume Share (%), by Country 2024 & 2032
- Figure 27: North America Perforating Gun Industry Revenue (Million), by Carrier Type 2024 & 2032
- Figure 28: North America Perforating Gun Industry Volume (K Unit), by Carrier Type 2024 & 2032
- Figure 29: North America Perforating Gun Industry Revenue Share (%), by Carrier Type 2024 & 2032
- Figure 30: North America Perforating Gun Industry Volume Share (%), by Carrier Type 2024 & 2032
- Figure 31: North America Perforating Gun Industry Revenue (Million), by Explosive Type 2024 & 2032
- Figure 32: North America Perforating Gun Industry Volume (K Unit), by Explosive Type 2024 & 2032
- Figure 33: North America Perforating Gun Industry Revenue Share (%), by Explosive Type 2024 & 2032
- Figure 34: North America Perforating Gun Industry Volume Share (%), by Explosive Type 2024 & 2032
- Figure 35: North America Perforating Gun Industry Revenue (Million), by Well Type 2024 & 2032
- Figure 36: North America Perforating Gun Industry Volume (K Unit), by Well Type 2024 & 2032
- Figure 37: North America Perforating Gun Industry Revenue Share (%), by Well Type 2024 & 2032
- Figure 38: North America Perforating Gun Industry Volume Share (%), by Well Type 2024 & 2032
- Figure 39: North America Perforating Gun Industry Revenue (Million), by Country 2024 & 2032
- Figure 40: North America Perforating Gun Industry Volume (K Unit), by Country 2024 & 2032
- Figure 41: North America Perforating Gun Industry Revenue Share (%), by Country 2024 & 2032
- Figure 42: North America Perforating Gun Industry Volume Share (%), by Country 2024 & 2032
- Figure 43: Europe Perforating Gun Industry Revenue (Million), by Carrier Type 2024 & 2032
- Figure 44: Europe Perforating Gun Industry Volume (K Unit), by Carrier Type 2024 & 2032
- Figure 45: Europe Perforating Gun Industry Revenue Share (%), by Carrier Type 2024 & 2032
- Figure 46: Europe Perforating Gun Industry Volume Share (%), by Carrier Type 2024 & 2032
- Figure 47: Europe Perforating Gun Industry Revenue (Million), by Explosive Type 2024 & 2032
- Figure 48: Europe Perforating Gun Industry Volume (K Unit), by Explosive Type 2024 & 2032
- Figure 49: Europe Perforating Gun Industry Revenue Share (%), by Explosive Type 2024 & 2032
- Figure 50: Europe Perforating Gun Industry Volume Share (%), by Explosive Type 2024 & 2032
- Figure 51: Europe Perforating Gun Industry Revenue (Million), by Well Type 2024 & 2032
- Figure 52: Europe Perforating Gun Industry Volume (K Unit), by Well Type 2024 & 2032
- Figure 53: Europe Perforating Gun Industry Revenue Share (%), by Well Type 2024 & 2032
- Figure 54: Europe Perforating Gun Industry Volume Share (%), by Well Type 2024 & 2032
- Figure 55: Europe Perforating Gun Industry Revenue (Million), by Country 2024 & 2032
- Figure 56: Europe Perforating Gun Industry Volume (K Unit), by Country 2024 & 2032
- Figure 57: Europe Perforating Gun Industry Revenue Share (%), by Country 2024 & 2032
- Figure 58: Europe Perforating Gun Industry Volume Share (%), by Country 2024 & 2032
- Figure 59: Asia Pacific Perforating Gun Industry Revenue (Million), by Carrier Type 2024 & 2032
- Figure 60: Asia Pacific Perforating Gun Industry Volume (K Unit), by Carrier Type 2024 & 2032
- Figure 61: Asia Pacific Perforating Gun Industry Revenue Share (%), by Carrier Type 2024 & 2032
- Figure 62: Asia Pacific Perforating Gun Industry Volume Share (%), by Carrier Type 2024 & 2032
- Figure 63: Asia Pacific Perforating Gun Industry Revenue (Million), by Explosive Type 2024 & 2032
- Figure 64: Asia Pacific Perforating Gun Industry Volume (K Unit), by Explosive Type 2024 & 2032
- Figure 65: Asia Pacific Perforating Gun Industry Revenue Share (%), by Explosive Type 2024 & 2032
- Figure 66: Asia Pacific Perforating Gun Industry Volume Share (%), by Explosive Type 2024 & 2032
- Figure 67: Asia Pacific Perforating Gun Industry Revenue (Million), by Well Type 2024 & 2032
- Figure 68: Asia Pacific Perforating Gun Industry Volume (K Unit), by Well Type 2024 & 2032
- Figure 69: Asia Pacific Perforating Gun Industry Revenue Share (%), by Well Type 2024 & 2032
- Figure 70: Asia Pacific Perforating Gun Industry Volume Share (%), by Well Type 2024 & 2032
- Figure 71: Asia Pacific Perforating Gun Industry Revenue (Million), by Country 2024 & 2032
- Figure 72: Asia Pacific Perforating Gun Industry Volume (K Unit), by Country 2024 & 2032
- Figure 73: Asia Pacific Perforating Gun Industry Revenue Share (%), by Country 2024 & 2032
- Figure 74: Asia Pacific Perforating Gun Industry Volume Share (%), by Country 2024 & 2032
- Figure 75: South America Perforating Gun Industry Revenue (Million), by Carrier Type 2024 & 2032
- Figure 76: South America Perforating Gun Industry Volume (K Unit), by Carrier Type 2024 & 2032
- Figure 77: South America Perforating Gun Industry Revenue Share (%), by Carrier Type 2024 & 2032
- Figure 78: South America Perforating Gun Industry Volume Share (%), by Carrier Type 2024 & 2032
- Figure 79: South America Perforating Gun Industry Revenue (Million), by Explosive Type 2024 & 2032
- Figure 80: South America Perforating Gun Industry Volume (K Unit), by Explosive Type 2024 & 2032
- Figure 81: South America Perforating Gun Industry Revenue Share (%), by Explosive Type 2024 & 2032
- Figure 82: South America Perforating Gun Industry Volume Share (%), by Explosive Type 2024 & 2032
- Figure 83: South America Perforating Gun Industry Revenue (Million), by Well Type 2024 & 2032
- Figure 84: South America Perforating Gun Industry Volume (K Unit), by Well Type 2024 & 2032
- Figure 85: South America Perforating Gun Industry Revenue Share (%), by Well Type 2024 & 2032
- Figure 86: South America Perforating Gun Industry Volume Share (%), by Well Type 2024 & 2032
- Figure 87: South America Perforating Gun Industry Revenue (Million), by Country 2024 & 2032
- Figure 88: South America Perforating Gun Industry Volume (K Unit), by Country 2024 & 2032
- Figure 89: South America Perforating Gun Industry Revenue Share (%), by Country 2024 & 2032
- Figure 90: South America Perforating Gun Industry Volume Share (%), by Country 2024 & 2032
- Figure 91: Middle East Perforating Gun Industry Revenue (Million), by Carrier Type 2024 & 2032
- Figure 92: Middle East Perforating Gun Industry Volume (K Unit), by Carrier Type 2024 & 2032
- Figure 93: Middle East Perforating Gun Industry Revenue Share (%), by Carrier Type 2024 & 2032
- Figure 94: Middle East Perforating Gun Industry Volume Share (%), by Carrier Type 2024 & 2032
- Figure 95: Middle East Perforating Gun Industry Revenue (Million), by Explosive Type 2024 & 2032
- Figure 96: Middle East Perforating Gun Industry Volume (K Unit), by Explosive Type 2024 & 2032
- Figure 97: Middle East Perforating Gun Industry Revenue Share (%), by Explosive Type 2024 & 2032
- Figure 98: Middle East Perforating Gun Industry Volume Share (%), by Explosive Type 2024 & 2032
- Figure 99: Middle East Perforating Gun Industry Revenue (Million), by Well Type 2024 & 2032
- Figure 100: Middle East Perforating Gun Industry Volume (K Unit), by Well Type 2024 & 2032
- Figure 101: Middle East Perforating Gun Industry Revenue Share (%), by Well Type 2024 & 2032
- Figure 102: Middle East Perforating Gun Industry Volume Share (%), by Well Type 2024 & 2032
- Figure 103: Middle East Perforating Gun Industry Revenue (Million), by Country 2024 & 2032
- Figure 104: Middle East Perforating Gun Industry Volume (K Unit), by Country 2024 & 2032
- Figure 105: Middle East Perforating Gun Industry Revenue Share (%), by Country 2024 & 2032
- Figure 106: Middle East Perforating Gun Industry Volume Share (%), by Country 2024 & 2032
- Figure 107: United Arab Emirates Perforating Gun Industry Revenue (Million), by Carrier Type 2024 & 2032
- Figure 108: United Arab Emirates Perforating Gun Industry Volume (K Unit), by Carrier Type 2024 & 2032
- Figure 109: United Arab Emirates Perforating Gun Industry Revenue Share (%), by Carrier Type 2024 & 2032
- Figure 110: United Arab Emirates Perforating Gun Industry Volume Share (%), by Carrier Type 2024 & 2032
- Figure 111: United Arab Emirates Perforating Gun Industry Revenue (Million), by Explosive Type 2024 & 2032
- Figure 112: United Arab Emirates Perforating Gun Industry Volume (K Unit), by Explosive Type 2024 & 2032
- Figure 113: United Arab Emirates Perforating Gun Industry Revenue Share (%), by Explosive Type 2024 & 2032
- Figure 114: United Arab Emirates Perforating Gun Industry Volume Share (%), by Explosive Type 2024 & 2032
- Figure 115: United Arab Emirates Perforating Gun Industry Revenue (Million), by Well Type 2024 & 2032
- Figure 116: United Arab Emirates Perforating Gun Industry Volume (K Unit), by Well Type 2024 & 2032
- Figure 117: United Arab Emirates Perforating Gun Industry Revenue Share (%), by Well Type 2024 & 2032
- Figure 118: United Arab Emirates Perforating Gun Industry Volume Share (%), by Well Type 2024 & 2032
- Figure 119: United Arab Emirates Perforating Gun Industry Revenue (Million), by Country 2024 & 2032
- Figure 120: United Arab Emirates Perforating Gun Industry Volume (K Unit), by Country 2024 & 2032
- Figure 121: United Arab Emirates Perforating Gun Industry Revenue Share (%), by Country 2024 & 2032
- Figure 122: United Arab Emirates Perforating Gun Industry Volume Share (%), by Country 2024 & 2032
List of Tables
- Table 1: Global Perforating Gun Industry Revenue Million Forecast, by Region 2019 & 2032
- Table 2: Global Perforating Gun Industry Volume K Unit Forecast, by Region 2019 & 2032
- Table 3: Global Perforating Gun Industry Revenue Million Forecast, by Carrier Type 2019 & 2032
- Table 4: Global Perforating Gun Industry Volume K Unit Forecast, by Carrier Type 2019 & 2032
- Table 5: Global Perforating Gun Industry Revenue Million Forecast, by Explosive Type 2019 & 2032
- Table 6: Global Perforating Gun Industry Volume K Unit Forecast, by Explosive Type 2019 & 2032
- Table 7: Global Perforating Gun Industry Revenue Million Forecast, by Well Type 2019 & 2032
- Table 8: Global Perforating Gun Industry Volume K Unit Forecast, by Well Type 2019 & 2032
- Table 9: Global Perforating Gun Industry Revenue Million Forecast, by Region 2019 & 2032
- Table 10: Global Perforating Gun Industry Volume K Unit Forecast, by Region 2019 & 2032
- Table 11: Global Perforating Gun Industry Revenue Million Forecast, by Country 2019 & 2032
- Table 12: Global Perforating Gun Industry Volume K Unit Forecast, by Country 2019 & 2032
- Table 13: United States Perforating Gun Industry Revenue (Million) Forecast, by Application 2019 & 2032
- Table 14: United States Perforating Gun Industry Volume (K Unit) Forecast, by Application 2019 & 2032
- Table 15: Canada Perforating Gun Industry Revenue (Million) Forecast, by Application 2019 & 2032
- Table 16: Canada Perforating Gun Industry Volume (K Unit) Forecast, by Application 2019 & 2032
- Table 17: Mexico Perforating Gun Industry Revenue (Million) Forecast, by Application 2019 & 2032
- Table 18: Mexico Perforating Gun Industry Volume (K Unit) Forecast, by Application 2019 & 2032
- Table 19: Global Perforating Gun Industry Revenue Million Forecast, by Country 2019 & 2032
- Table 20: Global Perforating Gun Industry Volume K Unit Forecast, by Country 2019 & 2032
- Table 21: Germany Perforating Gun Industry Revenue (Million) Forecast, by Application 2019 & 2032
- Table 22: Germany Perforating Gun Industry Volume (K Unit) Forecast, by Application 2019 & 2032
- Table 23: United Kingdom Perforating Gun Industry Revenue (Million) Forecast, by Application 2019 & 2032
- Table 24: United Kingdom Perforating Gun Industry Volume (K Unit) Forecast, by Application 2019 & 2032
- Table 25: France Perforating Gun Industry Revenue (Million) Forecast, by Application 2019 & 2032
- Table 26: France Perforating Gun Industry Volume (K Unit) Forecast, by Application 2019 & 2032
- Table 27: Spain Perforating Gun Industry Revenue (Million) Forecast, by Application 2019 & 2032
- Table 28: Spain Perforating Gun Industry Volume (K Unit) Forecast, by Application 2019 & 2032
- Table 29: Italy Perforating Gun Industry Revenue (Million) Forecast, by Application 2019 & 2032
- Table 30: Italy Perforating Gun Industry Volume (K Unit) Forecast, by Application 2019 & 2032
- Table 31: Spain Perforating Gun Industry Revenue (Million) Forecast, by Application 2019 & 2032
- Table 32: Spain Perforating Gun Industry Volume (K Unit) Forecast, by Application 2019 & 2032
- Table 33: Belgium Perforating Gun Industry Revenue (Million) Forecast, by Application 2019 & 2032
- Table 34: Belgium Perforating Gun Industry Volume (K Unit) Forecast, by Application 2019 & 2032
- Table 35: Netherland Perforating Gun Industry Revenue (Million) Forecast, by Application 2019 & 2032
- Table 36: Netherland Perforating Gun Industry Volume (K Unit) Forecast, by Application 2019 & 2032
- Table 37: Nordics Perforating Gun Industry Revenue (Million) Forecast, by Application 2019 & 2032
- Table 38: Nordics Perforating Gun Industry Volume (K Unit) Forecast, by Application 2019 & 2032
- Table 39: Rest of Europe Perforating Gun Industry Revenue (Million) Forecast, by Application 2019 & 2032
- Table 40: Rest of Europe Perforating Gun Industry Volume (K Unit) Forecast, by Application 2019 & 2032
- Table 41: Global Perforating Gun Industry Revenue Million Forecast, by Country 2019 & 2032
- Table 42: Global Perforating Gun Industry Volume K Unit Forecast, by Country 2019 & 2032
- Table 43: China Perforating Gun Industry Revenue (Million) Forecast, by Application 2019 & 2032
- Table 44: China Perforating Gun Industry Volume (K Unit) Forecast, by Application 2019 & 2032
- Table 45: Japan Perforating Gun Industry Revenue (Million) Forecast, by Application 2019 & 2032
- Table 46: Japan Perforating Gun Industry Volume (K Unit) Forecast, by Application 2019 & 2032
- Table 47: India Perforating Gun Industry Revenue (Million) Forecast, by Application 2019 & 2032
- Table 48: India Perforating Gun Industry Volume (K Unit) Forecast, by Application 2019 & 2032
- Table 49: South Korea Perforating Gun Industry Revenue (Million) Forecast, by Application 2019 & 2032
- Table 50: South Korea Perforating Gun Industry Volume (K Unit) Forecast, by Application 2019 & 2032
- Table 51: Southeast Asia Perforating Gun Industry Revenue (Million) Forecast, by Application 2019 & 2032
- Table 52: Southeast Asia Perforating Gun Industry Volume (K Unit) Forecast, by Application 2019 & 2032
- Table 53: Australia Perforating Gun Industry Revenue (Million) Forecast, by Application 2019 & 2032
- Table 54: Australia Perforating Gun Industry Volume (K Unit) Forecast, by Application 2019 & 2032
- Table 55: Indonesia Perforating Gun Industry Revenue (Million) Forecast, by Application 2019 & 2032
- Table 56: Indonesia Perforating Gun Industry Volume (K Unit) Forecast, by Application 2019 & 2032
- Table 57: Phillipes Perforating Gun Industry Revenue (Million) Forecast, by Application 2019 & 2032
- Table 58: Phillipes Perforating Gun Industry Volume (K Unit) Forecast, by Application 2019 & 2032
- Table 59: Singapore Perforating Gun Industry Revenue (Million) Forecast, by Application 2019 & 2032
- Table 60: Singapore Perforating Gun Industry Volume (K Unit) Forecast, by Application 2019 & 2032
- Table 61: Thailandc Perforating Gun Industry Revenue (Million) Forecast, by Application 2019 & 2032
- Table 62: Thailandc Perforating Gun Industry Volume (K Unit) Forecast, by Application 2019 & 2032
- Table 63: Rest of Asia Pacific Perforating Gun Industry Revenue (Million) Forecast, by Application 2019 & 2032
- Table 64: Rest of Asia Pacific Perforating Gun Industry Volume (K Unit) Forecast, by Application 2019 & 2032
- Table 65: Global Perforating Gun Industry Revenue Million Forecast, by Country 2019 & 2032
- Table 66: Global Perforating Gun Industry Volume K Unit Forecast, by Country 2019 & 2032
- Table 67: Brazil Perforating Gun Industry Revenue (Million) Forecast, by Application 2019 & 2032
- Table 68: Brazil Perforating Gun Industry Volume (K Unit) Forecast, by Application 2019 & 2032
- Table 69: Argentina Perforating Gun Industry Revenue (Million) Forecast, by Application 2019 & 2032
- Table 70: Argentina Perforating Gun Industry Volume (K Unit) Forecast, by Application 2019 & 2032
- Table 71: Peru Perforating Gun Industry Revenue (Million) Forecast, by Application 2019 & 2032
- Table 72: Peru Perforating Gun Industry Volume (K Unit) Forecast, by Application 2019 & 2032
- Table 73: Chile Perforating Gun Industry Revenue (Million) Forecast, by Application 2019 & 2032
- Table 74: Chile Perforating Gun Industry Volume (K Unit) Forecast, by Application 2019 & 2032
- Table 75: Colombia Perforating Gun Industry Revenue (Million) Forecast, by Application 2019 & 2032
- Table 76: Colombia Perforating Gun Industry Volume (K Unit) Forecast, by Application 2019 & 2032
- Table 77: Ecuador Perforating Gun Industry Revenue (Million) Forecast, by Application 2019 & 2032
- Table 78: Ecuador Perforating Gun Industry Volume (K Unit) Forecast, by Application 2019 & 2032
- Table 79: Venezuela Perforating Gun Industry Revenue (Million) Forecast, by Application 2019 & 2032
- Table 80: Venezuela Perforating Gun Industry Volume (K Unit) Forecast, by Application 2019 & 2032
- Table 81: Rest of South America Perforating Gun Industry Revenue (Million) Forecast, by Application 2019 & 2032
- Table 82: Rest of South America Perforating Gun Industry Volume (K Unit) Forecast, by Application 2019 & 2032
- Table 83: Global Perforating Gun Industry Revenue Million Forecast, by Country 2019 & 2032
- Table 84: Global Perforating Gun Industry Volume K Unit Forecast, by Country 2019 & 2032
- Table 85: United States Perforating Gun Industry Revenue (Million) Forecast, by Application 2019 & 2032
- Table 86: United States Perforating Gun Industry Volume (K Unit) Forecast, by Application 2019 & 2032
- Table 87: Canada Perforating Gun Industry Revenue (Million) Forecast, by Application 2019 & 2032
- Table 88: Canada Perforating Gun Industry Volume (K Unit) Forecast, by Application 2019 & 2032
- Table 89: Mexico Perforating Gun Industry Revenue (Million) Forecast, by Application 2019 & 2032
- Table 90: Mexico Perforating Gun Industry Volume (K Unit) Forecast, by Application 2019 & 2032
- Table 91: Global Perforating Gun Industry Revenue Million Forecast, by Country 2019 & 2032
- Table 92: Global Perforating Gun Industry Volume K Unit Forecast, by Country 2019 & 2032
- Table 93: United Arab Emirates Perforating Gun Industry Revenue (Million) Forecast, by Application 2019 & 2032
- Table 94: United Arab Emirates Perforating Gun Industry Volume (K Unit) Forecast, by Application 2019 & 2032
- Table 95: Saudi Arabia Perforating Gun Industry Revenue (Million) Forecast, by Application 2019 & 2032
- Table 96: Saudi Arabia Perforating Gun Industry Volume (K Unit) Forecast, by Application 2019 & 2032
- Table 97: South Africa Perforating Gun Industry Revenue (Million) Forecast, by Application 2019 & 2032
- Table 98: South Africa Perforating Gun Industry Volume (K Unit) Forecast, by Application 2019 & 2032
- Table 99: Rest of Middle East and Africa Perforating Gun Industry Revenue (Million) Forecast, by Application 2019 & 2032
- Table 100: Rest of Middle East and Africa Perforating Gun Industry Volume (K Unit) Forecast, by Application 2019 & 2032
- Table 101: Global Perforating Gun Industry Revenue Million Forecast, by Carrier Type 2019 & 2032
- Table 102: Global Perforating Gun Industry Volume K Unit Forecast, by Carrier Type 2019 & 2032
- Table 103: Global Perforating Gun Industry Revenue Million Forecast, by Explosive Type 2019 & 2032
- Table 104: Global Perforating Gun Industry Volume K Unit Forecast, by Explosive Type 2019 & 2032
- Table 105: Global Perforating Gun Industry Revenue Million Forecast, by Well Type 2019 & 2032
- Table 106: Global Perforating Gun Industry Volume K Unit Forecast, by Well Type 2019 & 2032
- Table 107: Global Perforating Gun Industry Revenue Million Forecast, by Country 2019 & 2032
- Table 108: Global Perforating Gun Industry Volume K Unit Forecast, by Country 2019 & 2032
- Table 109: United States Perforating Gun Industry Revenue (Million) Forecast, by Application 2019 & 2032
- Table 110: United States Perforating Gun Industry Volume (K Unit) Forecast, by Application 2019 & 2032
- Table 111: Canada Perforating Gun Industry Revenue (Million) Forecast, by Application 2019 & 2032
- Table 112: Canada Perforating Gun Industry Volume (K Unit) Forecast, by Application 2019 & 2032
- Table 113: Rest of North America Perforating Gun Industry Revenue (Million) Forecast, by Application 2019 & 2032
- Table 114: Rest of North America Perforating Gun Industry Volume (K Unit) Forecast, by Application 2019 & 2032
- Table 115: Global Perforating Gun Industry Revenue Million Forecast, by Carrier Type 2019 & 2032
- Table 116: Global Perforating Gun Industry Volume K Unit Forecast, by Carrier Type 2019 & 2032
- Table 117: Global Perforating Gun Industry Revenue Million Forecast, by Explosive Type 2019 & 2032
- Table 118: Global Perforating Gun Industry Volume K Unit Forecast, by Explosive Type 2019 & 2032
- Table 119: Global Perforating Gun Industry Revenue Million Forecast, by Well Type 2019 & 2032
- Table 120: Global Perforating Gun Industry Volume K Unit Forecast, by Well Type 2019 & 2032
- Table 121: Global Perforating Gun Industry Revenue Million Forecast, by Country 2019 & 2032
- Table 122: Global Perforating Gun Industry Volume K Unit Forecast, by Country 2019 & 2032
- Table 123: Norway Perforating Gun Industry Revenue (Million) Forecast, by Application 2019 & 2032
- Table 124: Norway Perforating Gun Industry Volume (K Unit) Forecast, by Application 2019 & 2032
- Table 125: United Kingdom Perforating Gun Industry Revenue (Million) Forecast, by Application 2019 & 2032
- Table 126: United Kingdom Perforating Gun Industry Volume (K Unit) Forecast, by Application 2019 & 2032
- Table 127: Russia Perforating Gun Industry Revenue (Million) Forecast, by Application 2019 & 2032
- Table 128: Russia Perforating Gun Industry Volume (K Unit) Forecast, by Application 2019 & 2032
- Table 129: Rest of Europe Perforating Gun Industry Revenue (Million) Forecast, by Application 2019 & 2032
- Table 130: Rest of Europe Perforating Gun Industry Volume (K Unit) Forecast, by Application 2019 & 2032
- Table 131: Global Perforating Gun Industry Revenue Million Forecast, by Carrier Type 2019 & 2032
- Table 132: Global Perforating Gun Industry Volume K Unit Forecast, by Carrier Type 2019 & 2032
- Table 133: Global Perforating Gun Industry Revenue Million Forecast, by Explosive Type 2019 & 2032
- Table 134: Global Perforating Gun Industry Volume K Unit Forecast, by Explosive Type 2019 & 2032
- Table 135: Global Perforating Gun Industry Revenue Million Forecast, by Well Type 2019 & 2032
- Table 136: Global Perforating Gun Industry Volume K Unit Forecast, by Well Type 2019 & 2032
- Table 137: Global Perforating Gun Industry Revenue Million Forecast, by Country 2019 & 2032
- Table 138: Global Perforating Gun Industry Volume K Unit Forecast, by Country 2019 & 2032
- Table 139: China Perforating Gun Industry Revenue (Million) Forecast, by Application 2019 & 2032
- Table 140: China Perforating Gun Industry Volume (K Unit) Forecast, by Application 2019 & 2032
- Table 141: India Perforating Gun Industry Revenue (Million) Forecast, by Application 2019 & 2032
- Table 142: India Perforating Gun Industry Volume (K Unit) Forecast, by Application 2019 & 2032
- Table 143: Indoensia Perforating Gun Industry Revenue (Million) Forecast, by Application 2019 & 2032
- Table 144: Indoensia Perforating Gun Industry Volume (K Unit) Forecast, by Application 2019 & 2032
- Table 145: Malaysia Perforating Gun Industry Revenue (Million) Forecast, by Application 2019 & 2032
- Table 146: Malaysia Perforating Gun Industry Volume (K Unit) Forecast, by Application 2019 & 2032
- Table 147: Rest of Asia Pacific Perforating Gun Industry Revenue (Million) Forecast, by Application 2019 & 2032
- Table 148: Rest of Asia Pacific Perforating Gun Industry Volume (K Unit) Forecast, by Application 2019 & 2032
- Table 149: Global Perforating Gun Industry Revenue Million Forecast, by Carrier Type 2019 & 2032
- Table 150: Global Perforating Gun Industry Volume K Unit Forecast, by Carrier Type 2019 & 2032
- Table 151: Global Perforating Gun Industry Revenue Million Forecast, by Explosive Type 2019 & 2032
- Table 152: Global Perforating Gun Industry Volume K Unit Forecast, by Explosive Type 2019 & 2032
- Table 153: Global Perforating Gun Industry Revenue Million Forecast, by Well Type 2019 & 2032
- Table 154: Global Perforating Gun Industry Volume K Unit Forecast, by Well Type 2019 & 2032
- Table 155: Global Perforating Gun Industry Revenue Million Forecast, by Country 2019 & 2032
- Table 156: Global Perforating Gun Industry Volume K Unit Forecast, by Country 2019 & 2032
- Table 157: Chile Perforating Gun Industry Revenue (Million) Forecast, by Application 2019 & 2032
- Table 158: Chile Perforating Gun Industry Volume (K Unit) Forecast, by Application 2019 & 2032
- Table 159: Brazil Perforating Gun Industry Revenue (Million) Forecast, by Application 2019 & 2032
- Table 160: Brazil Perforating Gun Industry Volume (K Unit) Forecast, by Application 2019 & 2032
- Table 161: Argentina Perforating Gun Industry Revenue (Million) Forecast, by Application 2019 & 2032
- Table 162: Argentina Perforating Gun Industry Volume (K Unit) Forecast, by Application 2019 & 2032
- Table 163: Rest of South Africa Perforating Gun Industry Revenue (Million) Forecast, by Application 2019 & 2032
- Table 164: Rest of South Africa Perforating Gun Industry Volume (K Unit) Forecast, by Application 2019 & 2032
- Table 165: Global Perforating Gun Industry Revenue Million Forecast, by Carrier Type 2019 & 2032
- Table 166: Global Perforating Gun Industry Volume K Unit Forecast, by Carrier Type 2019 & 2032
- Table 167: Global Perforating Gun Industry Revenue Million Forecast, by Explosive Type 2019 & 2032
- Table 168: Global Perforating Gun Industry Volume K Unit Forecast, by Explosive Type 2019 & 2032
- Table 169: Global Perforating Gun Industry Revenue Million Forecast, by Well Type 2019 & 2032
- Table 170: Global Perforating Gun Industry Volume K Unit Forecast, by Well Type 2019 & 2032
- Table 171: Global Perforating Gun Industry Revenue Million Forecast, by Country 2019 & 2032
- Table 172: Global Perforating Gun Industry Volume K Unit Forecast, by Country 2019 & 2032
- Table 173: Global Perforating Gun Industry Revenue Million Forecast, by Carrier Type 2019 & 2032
- Table 174: Global Perforating Gun Industry Volume K Unit Forecast, by Carrier Type 2019 & 2032
- Table 175: Global Perforating Gun Industry Revenue Million Forecast, by Explosive Type 2019 & 2032
- Table 176: Global Perforating Gun Industry Volume K Unit Forecast, by Explosive Type 2019 & 2032
- Table 177: Global Perforating Gun Industry Revenue Million Forecast, by Well Type 2019 & 2032
- Table 178: Global Perforating Gun Industry Volume K Unit Forecast, by Well Type 2019 & 2032
- Table 179: Global Perforating Gun Industry Revenue Million Forecast, by Country 2019 & 2032
- Table 180: Global Perforating Gun Industry Volume K Unit Forecast, by Country 2019 & 2032
- Table 181: Saudi Arabia Perforating Gun Industry Revenue (Million) Forecast, by Application 2019 & 2032
- Table 182: Saudi Arabia Perforating Gun Industry Volume (K Unit) Forecast, by Application 2019 & 2032
- Table 183: South Afica Perforating Gun Industry Revenue (Million) Forecast, by Application 2019 & 2032
- Table 184: South Afica Perforating Gun Industry Volume (K Unit) Forecast, by Application 2019 & 2032
- Table 185: Egypt Perforating Gun Industry Revenue (Million) Forecast, by Application 2019 & 2032
- Table 186: Egypt Perforating Gun Industry Volume (K Unit) Forecast, by Application 2019 & 2032
- Table 187: Nigeria Perforating Gun Industry Revenue (Million) Forecast, by Application 2019 & 2032
- Table 188: Nigeria Perforating Gun Industry Volume (K Unit) Forecast, by Application 2019 & 2032
- Table 189: Rest of Middle East Perforating Gun Industry Revenue (Million) Forecast, by Application 2019 & 2032
- Table 190: Rest of Middle East Perforating Gun Industry Volume (K Unit) Forecast, by Application 2019 & 2032
Frequently Asked Questions
1. What is the projected Compound Annual Growth Rate (CAGR) of the Perforating Gun Industry?
The projected CAGR is approximately 5.50%.
2. Which companies are prominent players in the Perforating Gun Industry?
Key companies in the market include Hunting PLC, Weatherford International PLC, Baker Hughes Company, Halliburton Company, DMC Global Inc, Schlumberger Limited, DynaEnergetics GmbH & Co KG, NOV Inc, Core Laboratories NV*List Not Exhaustive 6 4 Market Ranking/Share (%) Analysi, China Shaanxi FYPE Rigid Machinery Co Ltd.
3. What are the main segments of the Perforating Gun Industry?
The market segments include Carrier Type, Explosive Type, Well Type.
4. Can you provide details about the market size?
The market size is estimated to be USD 1.16 Million as of 2022.
5. What are some drivers contributing to market growth?
4.; Rise In Oil And Gas Drilling Activities And Associated Investments4.; Technological Developments In Perforating Gun Systems.
6. What are the notable trends driving market growth?
Horizontal and Deviated Well Segment to Dominate the Market.
7. Are there any restraints impacting market growth?
4.; Increased Focus On Renewable Energy Technologies To Fulfill Rising Energy Demand.
8. Can you provide examples of recent developments in the market?
In July 2023, DynaEnergetics unveiled DS Gravity 2.0, marking a breakthrough as the most compact, self-orienting perforating gun in the oil and gas sector. This length-optimized system is crafted to enhance perforation efficiency, save time, and contribute to the profitability of wells. Its patented design leverages gravity for internal component orientation, eliminating the necessity for orienting subs, swivels, and eccentric weight bars. As the second generation of the DS Gravity system, it boasts the shortest gun body in the market, allowing customers to augment the total gun count in their perforating strings.
9. What pricing options are available for accessing the report?
Pricing options include single-user, multi-user, and enterprise licenses priced at USD 4750, USD 5250, and USD 8750 respectively.
10. Is the market size provided in terms of value or volume?
The market size is provided in terms of value, measured in Million and volume, measured in K Unit.
11. Are there any specific market keywords associated with the report?
Yes, the market keyword associated with the report is "Perforating Gun Industry," which aids in identifying and referencing the specific market segment covered.
12. How do I determine which pricing option suits my needs best?
The pricing options vary based on user requirements and access needs. Individual users may opt for single-user licenses, while businesses requiring broader access may choose multi-user or enterprise licenses for cost-effective access to the report.
13. Are there any additional resources or data provided in the Perforating Gun Industry report?
While the report offers comprehensive insights, it's advisable to review the specific contents or supplementary materials provided to ascertain if additional resources or data are available.
14. How can I stay updated on further developments or reports in the Perforating Gun Industry?
To stay informed about further developments, trends, and reports in the Perforating Gun Industry, consider subscribing to industry newsletters, following relevant companies and organizations, or regularly checking reputable industry news sources and publications.
Methodology
Step 1 - Identification of Relevant Samples Size from Population Database


Step 2 - Approaches for Defining Global Market Size (Value, Volume* & Price*)

Note*: In applicable scenarios
Step 3 - Data Sources
Primary Research
- Web Analytics
- Survey Reports
- Research Institute
- Latest Research Reports
- Opinion Leaders
Secondary Research
- Annual Reports
- White Paper
- Latest Press Release
- Industry Association
- Paid Database
- Investor Presentations

Step 4 - Data Triangulation
Involves using different sources of information in order to increase the validity of a study
These sources are likely to be stakeholders in a program - participants, other researchers, program staff, other community members, and so on.
Then we put all data in single framework & apply various statistical tools to find out the dynamic on the market.
During the analysis stage, feedback from the stakeholder groups would be compared to determine areas of agreement as well as areas of divergence


