
Key Insights
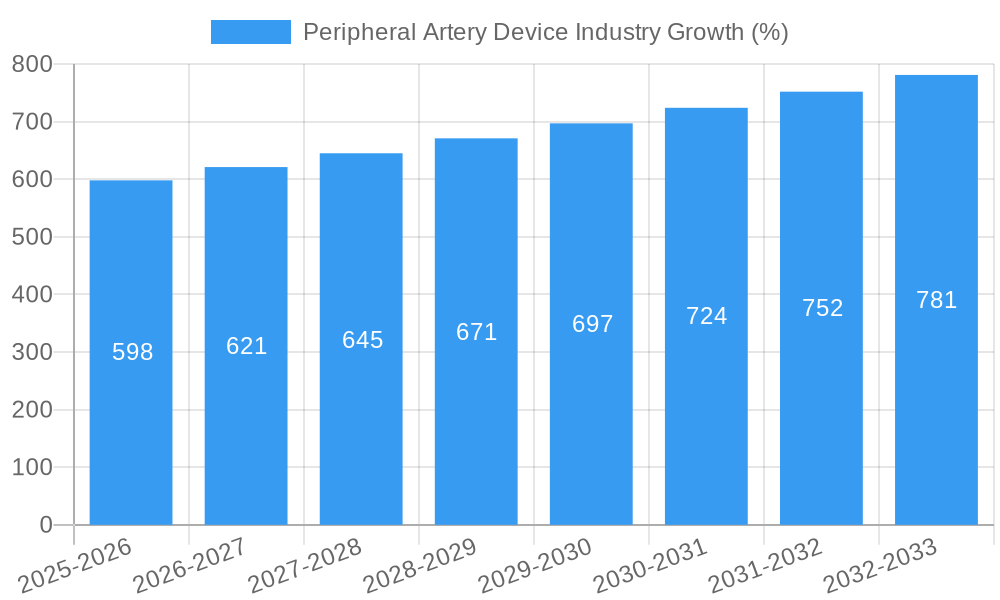
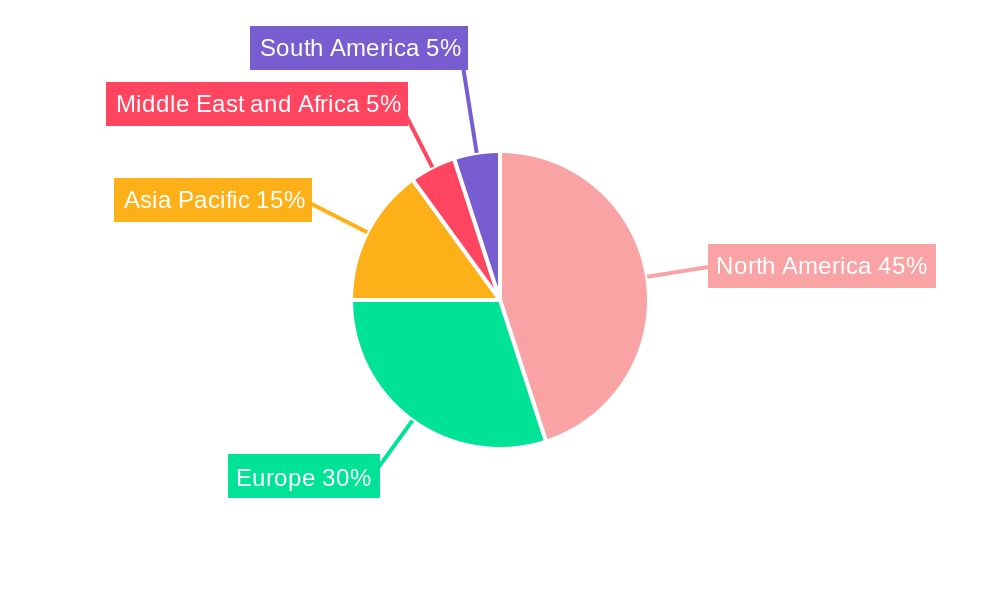
The Peripheral Artery Device (PAD) market, valued at $13.33 billion in 2025, is projected to experience robust growth, driven by increasing prevalence of peripheral artery disease (PAD), an aging global population, and advancements in minimally invasive procedures. The 4.43% CAGR from 2025 to 2033 indicates a significant expansion, fueled by the rising adoption of advanced devices like drug-eluting stents and atherectomy systems, offering improved patient outcomes and reduced re-intervention rates. Growth is further stimulated by increasing healthcare expenditure globally and growing awareness among healthcare professionals and patients regarding the debilitating effects of PAD. However, high treatment costs, particularly for advanced technologies, and the potential for adverse events associated with certain procedures could restrain market growth to some extent. Segment-wise, Peripheral Vascular Stents and PTA Balloon Catheters are anticipated to hold significant market share due to their wide applicability and established clinical efficacy. The competitive landscape is dominated by key players like Becton Dickinson, Medtronic, and Boston Scientific, who are continuously investing in research and development to enhance product offerings and expand their market presence. Geographic distribution sees North America and Europe as leading regions, driven by high healthcare infrastructure and advanced treatment protocols, while the Asia-Pacific region is poised for significant growth, fueled by rising disposable incomes and expanding healthcare access.
The forecast period of 2025-2033 will see continuous innovation within the PAD device sector, likely leading to the introduction of more sophisticated and effective devices. This includes a focus on personalized medicine approaches, enabling targeted treatments tailored to individual patient needs. Furthermore, a growing emphasis on improving patient outcomes, reducing complications, and optimizing cost-effectiveness will shape future market dynamics. The industry will likely witness strategic partnerships and collaborations between device manufacturers, healthcare providers, and research institutions to drive further advancements. Regulatory approvals, reimbursement policies, and healthcare reforms in different regions will also significantly influence the market trajectory. The projected growth necessitates a proactive approach by market players, focusing on product diversification, strategic acquisitions, and international expansion to capitalize on the expanding global opportunity.
Peripheral Artery Device Industry Report: 2019-2033
This comprehensive report provides a detailed analysis of the Peripheral Artery Device (PAD) industry, offering actionable insights for industry professionals, investors, and strategic decision-makers. The report covers the period 2019-2033, with a focus on the 2025-2033 forecast period. The study analyzes market size (in Millions), growth drivers, competitive dynamics, and emerging trends across various segments, including key device types and geographic regions.

Peripheral Artery Device Industry Market Structure & Innovation Trends
The peripheral artery device market is moderately consolidated, with key players like Becton Dickinson and Company, Medtronic, Abbott Laboratories, Boston Scientific Corporation, and Cook Medical holding significant market share. The exact market share for each company in 2025 is estimated at xx% respectively, while the overall market size is estimated at $XX Million. Innovation is driven by the need for less invasive procedures, improved device efficacy, and enhanced patient outcomes. Stringent regulatory frameworks, such as those enforced by the FDA, influence product development and market access. The industry sees substantial M&A activity, with deal values reaching $XX Million in recent years, driven by the pursuit of technological advancements and market expansion. Product substitutes, such as surgical interventions, exist but are often less preferred due to higher invasiveness and recovery times. The end-user demographic is primarily comprised of aging populations with cardiovascular diseases, resulting in a large target market.
- Market Concentration: Moderately consolidated, with top players controlling xx% of the market in 2025.
- Innovation Drivers: Minimally invasive procedures, improved efficacy, enhanced patient outcomes.
- Regulatory Frameworks: Stringent FDA regulations impact product development and market access.
- M&A Activity: Significant M&A activity with deal values reaching $XX Million annually.
- Product Substitutes: Surgical interventions, but less preferred due to higher invasiveness.
Peripheral Artery Device Industry Market Dynamics & Trends
The global peripheral artery device market is experiencing robust growth, with a CAGR of xx% projected from 2025 to 2033. This growth is fueled by increasing prevalence of peripheral artery disease (PAD), an aging global population, technological advancements leading to less invasive procedures, and rising healthcare expenditure. Technological disruptions, such as the development of drug-eluting stents and improved imaging techniques, are enhancing treatment efficacy and expanding market opportunities. Consumer preferences are shifting towards minimally invasive procedures with faster recovery times and reduced hospital stays. The competitive landscape is characterized by intense rivalry among established players and emerging companies, driving innovation and price competition. Market penetration of advanced devices like drug-eluting stents is steadily increasing, particularly in developed regions.
Dominant Regions & Segments in Peripheral Artery Device Industry
North America currently holds the largest market share in the peripheral artery device industry, driven by high healthcare expenditure, advanced medical infrastructure, and a large aging population. Within device types, Peripheral Vascular Stents and Peripheral Transluminal Angioplasty (PTA) Balloon Catheters represent the largest segments.
Key Drivers for North America Dominance:
- High healthcare expenditure
- Advanced medical infrastructure
- Large aging population with high prevalence of PAD
Dominant Device Types:
- Peripheral Vascular Stents: Largest segment due to high efficacy and adoption.
- Peripheral Transluminal Angioplasty (PTA) Balloon Catheters: High volume and consistent demand.
Other Significant Segments: Atherectomy Devices, Embolic Protection Devices are showing strong growth potential due to increasing demand for minimally invasive procedures. Inferior Vena Cava Filters maintain a stable market share, and “Other Device Types” present opportunities for niche players with innovative offerings.
Peripheral Artery Device Industry Product Innovations
Recent innovations focus on drug-eluting stents, bioabsorbable scaffolds, and improved guidewire technologies. These advancements aim to reduce restenosis rates, improve patient outcomes, and minimize procedural complications. The market fit for these innovations is strong, driven by the increasing demand for less invasive and more effective treatments for PAD. Technological trends highlight the movement toward personalized medicine and improved imaging techniques to enhance treatment precision and efficacy.
Report Scope & Segmentation Analysis
This report segments the peripheral artery device market by device type (Peripheral Vascular Stents, Peripheral Transluminal Angioplasty (PTA) Balloon Catheters, Peripheral Transluminal Angioplasty (PTA) Guidewires, Atherectomy Devices, Embolic Protection Devices, Inferior Vena Cava Filters, Other Device Types) and by geography. Each segment's growth projections, market sizes, and competitive dynamics are analyzed, providing a detailed overview of market opportunities and challenges. For instance, the Peripheral Vascular Stents segment is expected to experience significant growth due to its high efficacy and increasing adoption rates. Each segment shows a projected CAGR of xx%, with specific values detailed within the full report.
Key Drivers of Peripheral Artery Device Industry Growth
The industry's growth is propelled by the rising prevalence of PAD, particularly in aging populations globally. Technological advancements, such as drug-eluting stents and improved imaging techniques, enhance treatment efficacy, contributing to market expansion. Favorable regulatory environments in key markets and increasing healthcare expenditure further fuel market growth.
Challenges in the Peripheral Artery Device Industry Sector
The industry faces challenges such as stringent regulatory approvals, potential supply chain disruptions impacting device availability, and intense competition among established players and emerging companies. These factors can lead to fluctuating prices and potential delays in product launches, impacting market growth. The exact quantifiable impact of these challenges is detailed within the full report.
Emerging Opportunities in Peripheral Artery Device Industry
Emerging opportunities lie in the development of novel biocompatible materials, minimally invasive devices, and personalized medicine approaches. Expanding into emerging markets with growing healthcare infrastructure also presents significant opportunities for market expansion. Furthermore, telehealth applications and remote patient monitoring can improve patient care and contribute to market growth.
Leading Players in the Peripheral Artery Device Industry Market
- Becton Dickinson and Company
- Volcano Corporation
- Medtronic
- Abbott Laboratories
- Edward Lifesciences
- Cook
- Boston Scientific Corporation
- Cordis Corporation
Key Developments in Peripheral Artery Device Industry
- June 2022: Cardio Flow, Inc. received FDA approval for its FreedomFlow Peripheral Guidewire.
- January 2022: Cook Medical received breakthrough device designation from the FDA for a new drug-eluting stent for below-the-knee treatment.
Future Outlook for Peripheral Artery Device Industry Market
The peripheral artery device market is poised for continued growth, driven by technological advancements, increasing prevalence of PAD, and rising healthcare expenditure. Strategic partnerships, product diversification, and expansion into emerging markets will be crucial for companies to capitalize on future market potential and maintain a competitive edge. The projected market size in 2033 is estimated at $XX Million.
Peripheral Artery Device Industry Segmentation
-
1. Device Type
- 1.1. Peripheral Vascular Stents
- 1.2. Peripher
- 1.3. Peripher
- 1.4. Atherectomy Devices
- 1.5. Embolic Protection Devices
- 1.6. Inferior Vena Cava Filters
- 1.7. Other Device Types
Peripheral Artery Device Industry Segmentation By Geography
-
1. North America
- 1.1. United States
- 1.2. Canada
- 1.3. Mexico
-
2. Europe
- 2.1. Germany
- 2.2. United Kingdom
- 2.3. France
- 2.4. Italy
- 2.5. Spain
- 2.6. Rest of Europe
-
3. Asia Pacific
- 3.1. China
- 3.2. Japan
- 3.3. India
- 3.4. Australia
- 3.5. South Korea
- 3.6. Rest of Asia Pacific
-
4. Middle East and Africa
- 4.1. GCC
- 4.2. South Africa
- 4.3. Rest of Middle East and Africa
-
5. South America
- 5.1. Brazil
- 5.2. Argentina
- 5.3. Rest of South America
Peripheral Artery Device Industry REPORT HIGHLIGHTS
| Aspects | Details |
|---|---|
| Study Period | 2019-2033 |
| Base Year | 2024 |
| Estimated Year | 2025 |
| Forecast Period | 2025-2033 |
| Historical Period | 2019-2024 |
| Growth Rate | CAGR of 4.43% from 2019-2033 |
| Segmentation |
|
Table of Contents
- 1. Introduction
- 1.1. Research Scope
- 1.2. Market Segmentation
- 1.3. Research Methodology
- 1.4. Definitions and Assumptions
- 2. Executive Summary
- 2.1. Introduction
- 3. Market Dynamics
- 3.1. Introduction
- 3.2. Market Drivers
- 3.2.1. Rising Demand for Minimally-invasive Procedures; Increase in Incidence of Peripheral Arterial Disease (PAD)
- 3.3. Market Restrains
- 3.3.1. Stringent Regulation Related to Peripheral Vascular Devices
- 3.4. Market Trends
- 3.4.1. Peripheral Vascular Stents are expected to witness growth over the forecast period
- 4. Market Factor Analysis
- 4.1. Porters Five Forces
- 4.2. Supply/Value Chain
- 4.3. PESTEL analysis
- 4.4. Market Entropy
- 4.5. Patent/Trademark Analysis
- 5. Global Peripheral Artery Device Industry Analysis, Insights and Forecast, 2019-2031
- 5.1. Market Analysis, Insights and Forecast - by Device Type
- 5.1.1. Peripheral Vascular Stents
- 5.1.2. Peripher
- 5.1.3. Peripher
- 5.1.4. Atherectomy Devices
- 5.1.5. Embolic Protection Devices
- 5.1.6. Inferior Vena Cava Filters
- 5.1.7. Other Device Types
- 5.2. Market Analysis, Insights and Forecast - by Region
- 5.2.1. North America
- 5.2.2. Europe
- 5.2.3. Asia Pacific
- 5.2.4. Middle East and Africa
- 5.2.5. South America
- 5.1. Market Analysis, Insights and Forecast - by Device Type
- 6. North America Peripheral Artery Device Industry Analysis, Insights and Forecast, 2019-2031
- 6.1. Market Analysis, Insights and Forecast - by Device Type
- 6.1.1. Peripheral Vascular Stents
- 6.1.2. Peripher
- 6.1.3. Peripher
- 6.1.4. Atherectomy Devices
- 6.1.5. Embolic Protection Devices
- 6.1.6. Inferior Vena Cava Filters
- 6.1.7. Other Device Types
- 6.1. Market Analysis, Insights and Forecast - by Device Type
- 7. Europe Peripheral Artery Device Industry Analysis, Insights and Forecast, 2019-2031
- 7.1. Market Analysis, Insights and Forecast - by Device Type
- 7.1.1. Peripheral Vascular Stents
- 7.1.2. Peripher
- 7.1.3. Peripher
- 7.1.4. Atherectomy Devices
- 7.1.5. Embolic Protection Devices
- 7.1.6. Inferior Vena Cava Filters
- 7.1.7. Other Device Types
- 7.1. Market Analysis, Insights and Forecast - by Device Type
- 8. Asia Pacific Peripheral Artery Device Industry Analysis, Insights and Forecast, 2019-2031
- 8.1. Market Analysis, Insights and Forecast - by Device Type
- 8.1.1. Peripheral Vascular Stents
- 8.1.2. Peripher
- 8.1.3. Peripher
- 8.1.4. Atherectomy Devices
- 8.1.5. Embolic Protection Devices
- 8.1.6. Inferior Vena Cava Filters
- 8.1.7. Other Device Types
- 8.1. Market Analysis, Insights and Forecast - by Device Type
- 9. Middle East and Africa Peripheral Artery Device Industry Analysis, Insights and Forecast, 2019-2031
- 9.1. Market Analysis, Insights and Forecast - by Device Type
- 9.1.1. Peripheral Vascular Stents
- 9.1.2. Peripher
- 9.1.3. Peripher
- 9.1.4. Atherectomy Devices
- 9.1.5. Embolic Protection Devices
- 9.1.6. Inferior Vena Cava Filters
- 9.1.7. Other Device Types
- 9.1. Market Analysis, Insights and Forecast - by Device Type
- 10. South America Peripheral Artery Device Industry Analysis, Insights and Forecast, 2019-2031
- 10.1. Market Analysis, Insights and Forecast - by Device Type
- 10.1.1. Peripheral Vascular Stents
- 10.1.2. Peripher
- 10.1.3. Peripher
- 10.1.4. Atherectomy Devices
- 10.1.5. Embolic Protection Devices
- 10.1.6. Inferior Vena Cava Filters
- 10.1.7. Other Device Types
- 10.1. Market Analysis, Insights and Forecast - by Device Type
- 11. North America Peripheral Artery Device Industry Analysis, Insights and Forecast, 2019-2031
- 11.1. Market Analysis, Insights and Forecast - By Country/Sub-region
- 11.1.1 United States
- 11.1.2 Canada
- 11.1.3 Mexico
- 12. Europe Peripheral Artery Device Industry Analysis, Insights and Forecast, 2019-2031
- 12.1. Market Analysis, Insights and Forecast - By Country/Sub-region
- 12.1.1 Germany
- 12.1.2 United Kingdom
- 12.1.3 France
- 12.1.4 Italy
- 12.1.5 Spain
- 12.1.6 Rest of Europe
- 13. Asia Pacific Peripheral Artery Device Industry Analysis, Insights and Forecast, 2019-2031
- 13.1. Market Analysis, Insights and Forecast - By Country/Sub-region
- 13.1.1 China
- 13.1.2 Japan
- 13.1.3 India
- 13.1.4 Australia
- 13.1.5 South Korea
- 13.1.6 Rest of Asia Pacific
- 14. Middle East and Africa Peripheral Artery Device Industry Analysis, Insights and Forecast, 2019-2031
- 14.1. Market Analysis, Insights and Forecast - By Country/Sub-region
- 14.1.1 GCC
- 14.1.2 South Africa
- 14.1.3 Rest of Middle East and Africa
- 15. South America Peripheral Artery Device Industry Analysis, Insights and Forecast, 2019-2031
- 15.1. Market Analysis, Insights and Forecast - By Country/Sub-region
- 15.1.1 Brazil
- 15.1.2 Argentina
- 15.1.3 Rest of South America
- 16. Competitive Analysis
- 16.1. Global Market Share Analysis 2024
- 16.2. Company Profiles
- 16.2.1 Becton Dickinson and Company
- 16.2.1.1. Overview
- 16.2.1.2. Products
- 16.2.1.3. SWOT Analysis
- 16.2.1.4. Recent Developments
- 16.2.1.5. Financials (Based on Availability)
- 16.2.2 Volcano Corporation
- 16.2.2.1. Overview
- 16.2.2.2. Products
- 16.2.2.3. SWOT Analysis
- 16.2.2.4. Recent Developments
- 16.2.2.5. Financials (Based on Availability)
- 16.2.3 Medtronic
- 16.2.3.1. Overview
- 16.2.3.2. Products
- 16.2.3.3. SWOT Analysis
- 16.2.3.4. Recent Developments
- 16.2.3.5. Financials (Based on Availability)
- 16.2.4 Abbott Laboratories
- 16.2.4.1. Overview
- 16.2.4.2. Products
- 16.2.4.3. SWOT Analysis
- 16.2.4.4. Recent Developments
- 16.2.4.5. Financials (Based on Availability)
- 16.2.5 Edward Lifesciences
- 16.2.5.1. Overview
- 16.2.5.2. Products
- 16.2.5.3. SWOT Analysis
- 16.2.5.4. Recent Developments
- 16.2.5.5. Financials (Based on Availability)
- 16.2.6 Cook
- 16.2.6.1. Overview
- 16.2.6.2. Products
- 16.2.6.3. SWOT Analysis
- 16.2.6.4. Recent Developments
- 16.2.6.5. Financials (Based on Availability)
- 16.2.7 Boston Scientific Corporation
- 16.2.7.1. Overview
- 16.2.7.2. Products
- 16.2.7.3. SWOT Analysis
- 16.2.7.4. Recent Developments
- 16.2.7.5. Financials (Based on Availability)
- 16.2.8 Cordis Corporation
- 16.2.8.1. Overview
- 16.2.8.2. Products
- 16.2.8.3. SWOT Analysis
- 16.2.8.4. Recent Developments
- 16.2.8.5. Financials (Based on Availability)
- 16.2.1 Becton Dickinson and Company
List of Figures
- Figure 1: Global Peripheral Artery Device Industry Revenue Breakdown (Million, %) by Region 2024 & 2032
- Figure 2: Global Peripheral Artery Device Industry Volume Breakdown (K Units, %) by Region 2024 & 2032
- Figure 3: North America Peripheral Artery Device Industry Revenue (Million), by Country 2024 & 2032
- Figure 4: North America Peripheral Artery Device Industry Volume (K Units), by Country 2024 & 2032
- Figure 5: North America Peripheral Artery Device Industry Revenue Share (%), by Country 2024 & 2032
- Figure 6: North America Peripheral Artery Device Industry Volume Share (%), by Country 2024 & 2032
- Figure 7: Europe Peripheral Artery Device Industry Revenue (Million), by Country 2024 & 2032
- Figure 8: Europe Peripheral Artery Device Industry Volume (K Units), by Country 2024 & 2032
- Figure 9: Europe Peripheral Artery Device Industry Revenue Share (%), by Country 2024 & 2032
- Figure 10: Europe Peripheral Artery Device Industry Volume Share (%), by Country 2024 & 2032
- Figure 11: Asia Pacific Peripheral Artery Device Industry Revenue (Million), by Country 2024 & 2032
- Figure 12: Asia Pacific Peripheral Artery Device Industry Volume (K Units), by Country 2024 & 2032
- Figure 13: Asia Pacific Peripheral Artery Device Industry Revenue Share (%), by Country 2024 & 2032
- Figure 14: Asia Pacific Peripheral Artery Device Industry Volume Share (%), by Country 2024 & 2032
- Figure 15: Middle East and Africa Peripheral Artery Device Industry Revenue (Million), by Country 2024 & 2032
- Figure 16: Middle East and Africa Peripheral Artery Device Industry Volume (K Units), by Country 2024 & 2032
- Figure 17: Middle East and Africa Peripheral Artery Device Industry Revenue Share (%), by Country 2024 & 2032
- Figure 18: Middle East and Africa Peripheral Artery Device Industry Volume Share (%), by Country 2024 & 2032
- Figure 19: South America Peripheral Artery Device Industry Revenue (Million), by Country 2024 & 2032
- Figure 20: South America Peripheral Artery Device Industry Volume (K Units), by Country 2024 & 2032
- Figure 21: South America Peripheral Artery Device Industry Revenue Share (%), by Country 2024 & 2032
- Figure 22: South America Peripheral Artery Device Industry Volume Share (%), by Country 2024 & 2032
- Figure 23: North America Peripheral Artery Device Industry Revenue (Million), by Device Type 2024 & 2032
- Figure 24: North America Peripheral Artery Device Industry Volume (K Units), by Device Type 2024 & 2032
- Figure 25: North America Peripheral Artery Device Industry Revenue Share (%), by Device Type 2024 & 2032
- Figure 26: North America Peripheral Artery Device Industry Volume Share (%), by Device Type 2024 & 2032
- Figure 27: North America Peripheral Artery Device Industry Revenue (Million), by Country 2024 & 2032
- Figure 28: North America Peripheral Artery Device Industry Volume (K Units), by Country 2024 & 2032
- Figure 29: North America Peripheral Artery Device Industry Revenue Share (%), by Country 2024 & 2032
- Figure 30: North America Peripheral Artery Device Industry Volume Share (%), by Country 2024 & 2032
- Figure 31: Europe Peripheral Artery Device Industry Revenue (Million), by Device Type 2024 & 2032
- Figure 32: Europe Peripheral Artery Device Industry Volume (K Units), by Device Type 2024 & 2032
- Figure 33: Europe Peripheral Artery Device Industry Revenue Share (%), by Device Type 2024 & 2032
- Figure 34: Europe Peripheral Artery Device Industry Volume Share (%), by Device Type 2024 & 2032
- Figure 35: Europe Peripheral Artery Device Industry Revenue (Million), by Country 2024 & 2032
- Figure 36: Europe Peripheral Artery Device Industry Volume (K Units), by Country 2024 & 2032
- Figure 37: Europe Peripheral Artery Device Industry Revenue Share (%), by Country 2024 & 2032
- Figure 38: Europe Peripheral Artery Device Industry Volume Share (%), by Country 2024 & 2032
- Figure 39: Asia Pacific Peripheral Artery Device Industry Revenue (Million), by Device Type 2024 & 2032
- Figure 40: Asia Pacific Peripheral Artery Device Industry Volume (K Units), by Device Type 2024 & 2032
- Figure 41: Asia Pacific Peripheral Artery Device Industry Revenue Share (%), by Device Type 2024 & 2032
- Figure 42: Asia Pacific Peripheral Artery Device Industry Volume Share (%), by Device Type 2024 & 2032
- Figure 43: Asia Pacific Peripheral Artery Device Industry Revenue (Million), by Country 2024 & 2032
- Figure 44: Asia Pacific Peripheral Artery Device Industry Volume (K Units), by Country 2024 & 2032
- Figure 45: Asia Pacific Peripheral Artery Device Industry Revenue Share (%), by Country 2024 & 2032
- Figure 46: Asia Pacific Peripheral Artery Device Industry Volume Share (%), by Country 2024 & 2032
- Figure 47: Middle East and Africa Peripheral Artery Device Industry Revenue (Million), by Device Type 2024 & 2032
- Figure 48: Middle East and Africa Peripheral Artery Device Industry Volume (K Units), by Device Type 2024 & 2032
- Figure 49: Middle East and Africa Peripheral Artery Device Industry Revenue Share (%), by Device Type 2024 & 2032
- Figure 50: Middle East and Africa Peripheral Artery Device Industry Volume Share (%), by Device Type 2024 & 2032
- Figure 51: Middle East and Africa Peripheral Artery Device Industry Revenue (Million), by Country 2024 & 2032
- Figure 52: Middle East and Africa Peripheral Artery Device Industry Volume (K Units), by Country 2024 & 2032
- Figure 53: Middle East and Africa Peripheral Artery Device Industry Revenue Share (%), by Country 2024 & 2032
- Figure 54: Middle East and Africa Peripheral Artery Device Industry Volume Share (%), by Country 2024 & 2032
- Figure 55: South America Peripheral Artery Device Industry Revenue (Million), by Device Type 2024 & 2032
- Figure 56: South America Peripheral Artery Device Industry Volume (K Units), by Device Type 2024 & 2032
- Figure 57: South America Peripheral Artery Device Industry Revenue Share (%), by Device Type 2024 & 2032
- Figure 58: South America Peripheral Artery Device Industry Volume Share (%), by Device Type 2024 & 2032
- Figure 59: South America Peripheral Artery Device Industry Revenue (Million), by Country 2024 & 2032
- Figure 60: South America Peripheral Artery Device Industry Volume (K Units), by Country 2024 & 2032
- Figure 61: South America Peripheral Artery Device Industry Revenue Share (%), by Country 2024 & 2032
- Figure 62: South America Peripheral Artery Device Industry Volume Share (%), by Country 2024 & 2032
List of Tables
- Table 1: Global Peripheral Artery Device Industry Revenue Million Forecast, by Region 2019 & 2032
- Table 2: Global Peripheral Artery Device Industry Volume K Units Forecast, by Region 2019 & 2032
- Table 3: Global Peripheral Artery Device Industry Revenue Million Forecast, by Device Type 2019 & 2032
- Table 4: Global Peripheral Artery Device Industry Volume K Units Forecast, by Device Type 2019 & 2032
- Table 5: Global Peripheral Artery Device Industry Revenue Million Forecast, by Region 2019 & 2032
- Table 6: Global Peripheral Artery Device Industry Volume K Units Forecast, by Region 2019 & 2032
- Table 7: Global Peripheral Artery Device Industry Revenue Million Forecast, by Country 2019 & 2032
- Table 8: Global Peripheral Artery Device Industry Volume K Units Forecast, by Country 2019 & 2032
- Table 9: United States Peripheral Artery Device Industry Revenue (Million) Forecast, by Application 2019 & 2032
- Table 10: United States Peripheral Artery Device Industry Volume (K Units) Forecast, by Application 2019 & 2032
- Table 11: Canada Peripheral Artery Device Industry Revenue (Million) Forecast, by Application 2019 & 2032
- Table 12: Canada Peripheral Artery Device Industry Volume (K Units) Forecast, by Application 2019 & 2032
- Table 13: Mexico Peripheral Artery Device Industry Revenue (Million) Forecast, by Application 2019 & 2032
- Table 14: Mexico Peripheral Artery Device Industry Volume (K Units) Forecast, by Application 2019 & 2032
- Table 15: Global Peripheral Artery Device Industry Revenue Million Forecast, by Country 2019 & 2032
- Table 16: Global Peripheral Artery Device Industry Volume K Units Forecast, by Country 2019 & 2032
- Table 17: Germany Peripheral Artery Device Industry Revenue (Million) Forecast, by Application 2019 & 2032
- Table 18: Germany Peripheral Artery Device Industry Volume (K Units) Forecast, by Application 2019 & 2032
- Table 19: United Kingdom Peripheral Artery Device Industry Revenue (Million) Forecast, by Application 2019 & 2032
- Table 20: United Kingdom Peripheral Artery Device Industry Volume (K Units) Forecast, by Application 2019 & 2032
- Table 21: France Peripheral Artery Device Industry Revenue (Million) Forecast, by Application 2019 & 2032
- Table 22: France Peripheral Artery Device Industry Volume (K Units) Forecast, by Application 2019 & 2032
- Table 23: Italy Peripheral Artery Device Industry Revenue (Million) Forecast, by Application 2019 & 2032
- Table 24: Italy Peripheral Artery Device Industry Volume (K Units) Forecast, by Application 2019 & 2032
- Table 25: Spain Peripheral Artery Device Industry Revenue (Million) Forecast, by Application 2019 & 2032
- Table 26: Spain Peripheral Artery Device Industry Volume (K Units) Forecast, by Application 2019 & 2032
- Table 27: Rest of Europe Peripheral Artery Device Industry Revenue (Million) Forecast, by Application 2019 & 2032
- Table 28: Rest of Europe Peripheral Artery Device Industry Volume (K Units) Forecast, by Application 2019 & 2032
- Table 29: Global Peripheral Artery Device Industry Revenue Million Forecast, by Country 2019 & 2032
- Table 30: Global Peripheral Artery Device Industry Volume K Units Forecast, by Country 2019 & 2032
- Table 31: China Peripheral Artery Device Industry Revenue (Million) Forecast, by Application 2019 & 2032
- Table 32: China Peripheral Artery Device Industry Volume (K Units) Forecast, by Application 2019 & 2032
- Table 33: Japan Peripheral Artery Device Industry Revenue (Million) Forecast, by Application 2019 & 2032
- Table 34: Japan Peripheral Artery Device Industry Volume (K Units) Forecast, by Application 2019 & 2032
- Table 35: India Peripheral Artery Device Industry Revenue (Million) Forecast, by Application 2019 & 2032
- Table 36: India Peripheral Artery Device Industry Volume (K Units) Forecast, by Application 2019 & 2032
- Table 37: Australia Peripheral Artery Device Industry Revenue (Million) Forecast, by Application 2019 & 2032
- Table 38: Australia Peripheral Artery Device Industry Volume (K Units) Forecast, by Application 2019 & 2032
- Table 39: South Korea Peripheral Artery Device Industry Revenue (Million) Forecast, by Application 2019 & 2032
- Table 40: South Korea Peripheral Artery Device Industry Volume (K Units) Forecast, by Application 2019 & 2032
- Table 41: Rest of Asia Pacific Peripheral Artery Device Industry Revenue (Million) Forecast, by Application 2019 & 2032
- Table 42: Rest of Asia Pacific Peripheral Artery Device Industry Volume (K Units) Forecast, by Application 2019 & 2032
- Table 43: Global Peripheral Artery Device Industry Revenue Million Forecast, by Country 2019 & 2032
- Table 44: Global Peripheral Artery Device Industry Volume K Units Forecast, by Country 2019 & 2032
- Table 45: GCC Peripheral Artery Device Industry Revenue (Million) Forecast, by Application 2019 & 2032
- Table 46: GCC Peripheral Artery Device Industry Volume (K Units) Forecast, by Application 2019 & 2032
- Table 47: South Africa Peripheral Artery Device Industry Revenue (Million) Forecast, by Application 2019 & 2032
- Table 48: South Africa Peripheral Artery Device Industry Volume (K Units) Forecast, by Application 2019 & 2032
- Table 49: Rest of Middle East and Africa Peripheral Artery Device Industry Revenue (Million) Forecast, by Application 2019 & 2032
- Table 50: Rest of Middle East and Africa Peripheral Artery Device Industry Volume (K Units) Forecast, by Application 2019 & 2032
- Table 51: Global Peripheral Artery Device Industry Revenue Million Forecast, by Country 2019 & 2032
- Table 52: Global Peripheral Artery Device Industry Volume K Units Forecast, by Country 2019 & 2032
- Table 53: Brazil Peripheral Artery Device Industry Revenue (Million) Forecast, by Application 2019 & 2032
- Table 54: Brazil Peripheral Artery Device Industry Volume (K Units) Forecast, by Application 2019 & 2032
- Table 55: Argentina Peripheral Artery Device Industry Revenue (Million) Forecast, by Application 2019 & 2032
- Table 56: Argentina Peripheral Artery Device Industry Volume (K Units) Forecast, by Application 2019 & 2032
- Table 57: Rest of South America Peripheral Artery Device Industry Revenue (Million) Forecast, by Application 2019 & 2032
- Table 58: Rest of South America Peripheral Artery Device Industry Volume (K Units) Forecast, by Application 2019 & 2032
- Table 59: Global Peripheral Artery Device Industry Revenue Million Forecast, by Device Type 2019 & 2032
- Table 60: Global Peripheral Artery Device Industry Volume K Units Forecast, by Device Type 2019 & 2032
- Table 61: Global Peripheral Artery Device Industry Revenue Million Forecast, by Country 2019 & 2032
- Table 62: Global Peripheral Artery Device Industry Volume K Units Forecast, by Country 2019 & 2032
- Table 63: United States Peripheral Artery Device Industry Revenue (Million) Forecast, by Application 2019 & 2032
- Table 64: United States Peripheral Artery Device Industry Volume (K Units) Forecast, by Application 2019 & 2032
- Table 65: Canada Peripheral Artery Device Industry Revenue (Million) Forecast, by Application 2019 & 2032
- Table 66: Canada Peripheral Artery Device Industry Volume (K Units) Forecast, by Application 2019 & 2032
- Table 67: Mexico Peripheral Artery Device Industry Revenue (Million) Forecast, by Application 2019 & 2032
- Table 68: Mexico Peripheral Artery Device Industry Volume (K Units) Forecast, by Application 2019 & 2032
- Table 69: Global Peripheral Artery Device Industry Revenue Million Forecast, by Device Type 2019 & 2032
- Table 70: Global Peripheral Artery Device Industry Volume K Units Forecast, by Device Type 2019 & 2032
- Table 71: Global Peripheral Artery Device Industry Revenue Million Forecast, by Country 2019 & 2032
- Table 72: Global Peripheral Artery Device Industry Volume K Units Forecast, by Country 2019 & 2032
- Table 73: Germany Peripheral Artery Device Industry Revenue (Million) Forecast, by Application 2019 & 2032
- Table 74: Germany Peripheral Artery Device Industry Volume (K Units) Forecast, by Application 2019 & 2032
- Table 75: United Kingdom Peripheral Artery Device Industry Revenue (Million) Forecast, by Application 2019 & 2032
- Table 76: United Kingdom Peripheral Artery Device Industry Volume (K Units) Forecast, by Application 2019 & 2032
- Table 77: France Peripheral Artery Device Industry Revenue (Million) Forecast, by Application 2019 & 2032
- Table 78: France Peripheral Artery Device Industry Volume (K Units) Forecast, by Application 2019 & 2032
- Table 79: Italy Peripheral Artery Device Industry Revenue (Million) Forecast, by Application 2019 & 2032
- Table 80: Italy Peripheral Artery Device Industry Volume (K Units) Forecast, by Application 2019 & 2032
- Table 81: Spain Peripheral Artery Device Industry Revenue (Million) Forecast, by Application 2019 & 2032
- Table 82: Spain Peripheral Artery Device Industry Volume (K Units) Forecast, by Application 2019 & 2032
- Table 83: Rest of Europe Peripheral Artery Device Industry Revenue (Million) Forecast, by Application 2019 & 2032
- Table 84: Rest of Europe Peripheral Artery Device Industry Volume (K Units) Forecast, by Application 2019 & 2032
- Table 85: Global Peripheral Artery Device Industry Revenue Million Forecast, by Device Type 2019 & 2032
- Table 86: Global Peripheral Artery Device Industry Volume K Units Forecast, by Device Type 2019 & 2032
- Table 87: Global Peripheral Artery Device Industry Revenue Million Forecast, by Country 2019 & 2032
- Table 88: Global Peripheral Artery Device Industry Volume K Units Forecast, by Country 2019 & 2032
- Table 89: China Peripheral Artery Device Industry Revenue (Million) Forecast, by Application 2019 & 2032
- Table 90: China Peripheral Artery Device Industry Volume (K Units) Forecast, by Application 2019 & 2032
- Table 91: Japan Peripheral Artery Device Industry Revenue (Million) Forecast, by Application 2019 & 2032
- Table 92: Japan Peripheral Artery Device Industry Volume (K Units) Forecast, by Application 2019 & 2032
- Table 93: India Peripheral Artery Device Industry Revenue (Million) Forecast, by Application 2019 & 2032
- Table 94: India Peripheral Artery Device Industry Volume (K Units) Forecast, by Application 2019 & 2032
- Table 95: Australia Peripheral Artery Device Industry Revenue (Million) Forecast, by Application 2019 & 2032
- Table 96: Australia Peripheral Artery Device Industry Volume (K Units) Forecast, by Application 2019 & 2032
- Table 97: South Korea Peripheral Artery Device Industry Revenue (Million) Forecast, by Application 2019 & 2032
- Table 98: South Korea Peripheral Artery Device Industry Volume (K Units) Forecast, by Application 2019 & 2032
- Table 99: Rest of Asia Pacific Peripheral Artery Device Industry Revenue (Million) Forecast, by Application 2019 & 2032
- Table 100: Rest of Asia Pacific Peripheral Artery Device Industry Volume (K Units) Forecast, by Application 2019 & 2032
- Table 101: Global Peripheral Artery Device Industry Revenue Million Forecast, by Device Type 2019 & 2032
- Table 102: Global Peripheral Artery Device Industry Volume K Units Forecast, by Device Type 2019 & 2032
- Table 103: Global Peripheral Artery Device Industry Revenue Million Forecast, by Country 2019 & 2032
- Table 104: Global Peripheral Artery Device Industry Volume K Units Forecast, by Country 2019 & 2032
- Table 105: GCC Peripheral Artery Device Industry Revenue (Million) Forecast, by Application 2019 & 2032
- Table 106: GCC Peripheral Artery Device Industry Volume (K Units) Forecast, by Application 2019 & 2032
- Table 107: South Africa Peripheral Artery Device Industry Revenue (Million) Forecast, by Application 2019 & 2032
- Table 108: South Africa Peripheral Artery Device Industry Volume (K Units) Forecast, by Application 2019 & 2032
- Table 109: Rest of Middle East and Africa Peripheral Artery Device Industry Revenue (Million) Forecast, by Application 2019 & 2032
- Table 110: Rest of Middle East and Africa Peripheral Artery Device Industry Volume (K Units) Forecast, by Application 2019 & 2032
- Table 111: Global Peripheral Artery Device Industry Revenue Million Forecast, by Device Type 2019 & 2032
- Table 112: Global Peripheral Artery Device Industry Volume K Units Forecast, by Device Type 2019 & 2032
- Table 113: Global Peripheral Artery Device Industry Revenue Million Forecast, by Country 2019 & 2032
- Table 114: Global Peripheral Artery Device Industry Volume K Units Forecast, by Country 2019 & 2032
- Table 115: Brazil Peripheral Artery Device Industry Revenue (Million) Forecast, by Application 2019 & 2032
- Table 116: Brazil Peripheral Artery Device Industry Volume (K Units) Forecast, by Application 2019 & 2032
- Table 117: Argentina Peripheral Artery Device Industry Revenue (Million) Forecast, by Application 2019 & 2032
- Table 118: Argentina Peripheral Artery Device Industry Volume (K Units) Forecast, by Application 2019 & 2032
- Table 119: Rest of South America Peripheral Artery Device Industry Revenue (Million) Forecast, by Application 2019 & 2032
- Table 120: Rest of South America Peripheral Artery Device Industry Volume (K Units) Forecast, by Application 2019 & 2032
Frequently Asked Questions
1. What is the projected Compound Annual Growth Rate (CAGR) of the Peripheral Artery Device Industry?
The projected CAGR is approximately 4.43%.
2. Which companies are prominent players in the Peripheral Artery Device Industry?
Key companies in the market include Becton Dickinson and Company, Volcano Corporation, Medtronic, Abbott Laboratories, Edward Lifesciences, Cook, Boston Scientific Corporation, Cordis Corporation.
3. What are the main segments of the Peripheral Artery Device Industry?
The market segments include Device Type.
4. Can you provide details about the market size?
The market size is estimated to be USD 13.33 Million as of 2022.
5. What are some drivers contributing to market growth?
Rising Demand for Minimally-invasive Procedures; Increase in Incidence of Peripheral Arterial Disease (PAD).
6. What are the notable trends driving market growth?
Peripheral Vascular Stents are expected to witness growth over the forecast period.
7. Are there any restraints impacting market growth?
Stringent Regulation Related to Peripheral Vascular Devices.
8. Can you provide examples of recent developments in the market?
In June 2022, Cardio Flow, Inc., a medical device company and manufacturer of minimally invasive peripheral vascular devices to treat peripheral artery disease (PAD), announced United States Food and Drug Administration (FDA) approval for the company's FreedomFlow Peripheral Guidewire.
9. What pricing options are available for accessing the report?
Pricing options include single-user, multi-user, and enterprise licenses priced at USD 4750, USD 5250, and USD 8750 respectively.
10. Is the market size provided in terms of value or volume?
The market size is provided in terms of value, measured in Million and volume, measured in K Units.
11. Are there any specific market keywords associated with the report?
Yes, the market keyword associated with the report is "Peripheral Artery Device Industry," which aids in identifying and referencing the specific market segment covered.
12. How do I determine which pricing option suits my needs best?
The pricing options vary based on user requirements and access needs. Individual users may opt for single-user licenses, while businesses requiring broader access may choose multi-user or enterprise licenses for cost-effective access to the report.
13. Are there any additional resources or data provided in the Peripheral Artery Device Industry report?
While the report offers comprehensive insights, it's advisable to review the specific contents or supplementary materials provided to ascertain if additional resources or data are available.
14. How can I stay updated on further developments or reports in the Peripheral Artery Device Industry?
To stay informed about further developments, trends, and reports in the Peripheral Artery Device Industry, consider subscribing to industry newsletters, following relevant companies and organizations, or regularly checking reputable industry news sources and publications.
Methodology
Step 1 - Identification of Relevant Samples Size from Population Database


Step 2 - Approaches for Defining Global Market Size (Value, Volume* & Price*)

Note*: In applicable scenarios
Step 3 - Data Sources
Primary Research
- Web Analytics
- Survey Reports
- Research Institute
- Latest Research Reports
- Opinion Leaders
Secondary Research
- Annual Reports
- White Paper
- Latest Press Release
- Industry Association
- Paid Database
- Investor Presentations

Step 4 - Data Triangulation
Involves using different sources of information in order to increase the validity of a study
These sources are likely to be stakeholders in a program - participants, other researchers, program staff, other community members, and so on.
Then we put all data in single framework & apply various statistical tools to find out the dynamic on the market.
During the analysis stage, feedback from the stakeholder groups would be compared to determine areas of agreement as well as areas of divergence


