
Key Insights
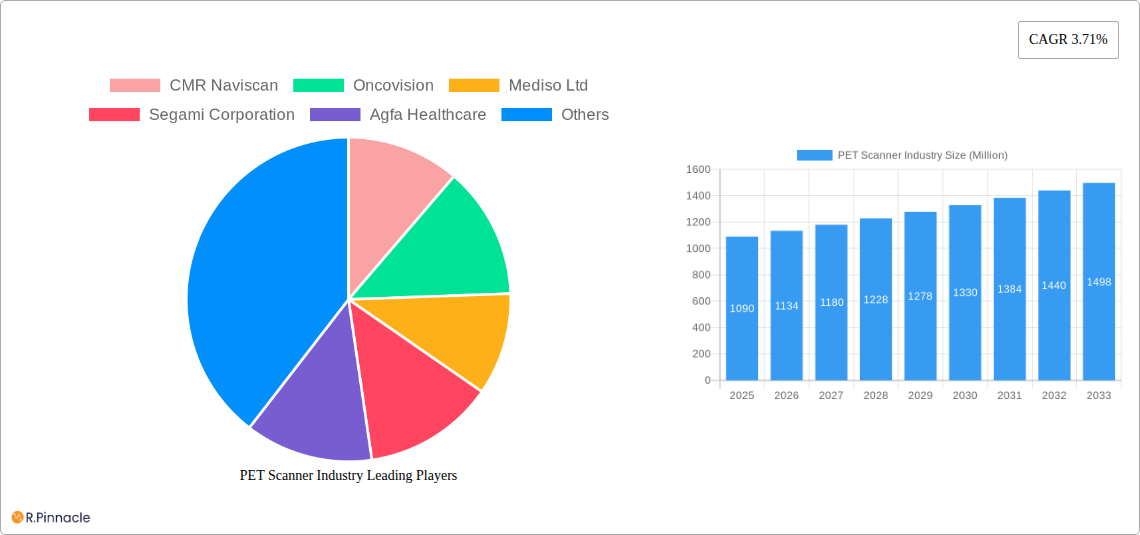
The global PET scanner market, valued at $1.09 billion in 2025, is projected to experience steady growth, driven by several key factors. Technological advancements leading to improved image quality, faster scan times, and reduced radiation exposure are significantly boosting adoption. The increasing prevalence of cancer and cardiovascular diseases, necessitating accurate and timely diagnosis, is another major driver. Furthermore, the rising geriatric population, which is more susceptible to these diseases, is fueling demand for advanced imaging technologies like PET scanners. Growth is also being propelled by the expansion of healthcare infrastructure, particularly in developing economies, coupled with increasing government initiatives promoting early disease detection and improved healthcare access. The market segmentation reveals a strong preference for full-ring PET scanners due to their superior image resolution, although partial-ring scanners retain a significant presence due to cost-effectiveness. Oncology currently dominates application-based segmentation, reflecting the critical role of PET scans in cancer diagnosis and treatment monitoring. Hospitals and diagnostic centers represent the largest end-user segments. Competition is intense, with established players like Siemens Healthineers, GE Healthcare, and Philips alongside smaller, specialized companies vying for market share through innovation and strategic partnerships.
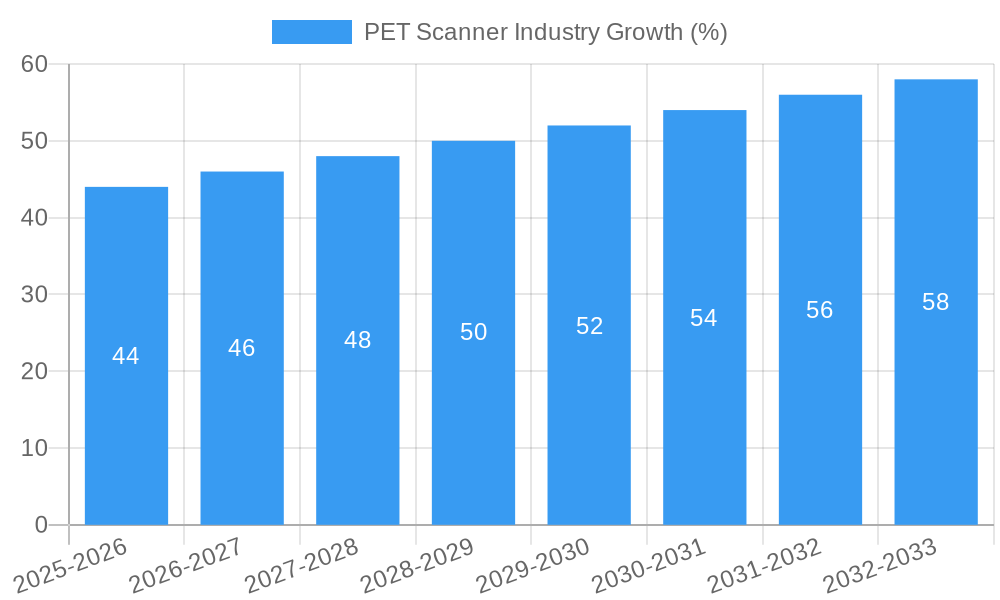
However, the market faces certain challenges. High initial investment costs associated with purchasing and maintaining PET scanners can be a barrier for smaller healthcare providers, particularly in resource-constrained settings. The need for skilled technicians and radiologists to operate and interpret scans also represents a significant constraint. Furthermore, regulatory hurdles and reimbursement policies in various regions can impact market penetration. Despite these restraints, the long-term outlook remains positive, fueled by continuous technological advancements, expanding healthcare infrastructure, and the growing need for accurate and efficient diagnostic tools. The market is expected to witness consistent growth through 2033, with the CAGR of 3.71% indicating a healthy and sustained expansion. Regional growth will vary, with North America and Europe likely maintaining significant market shares due to their well-established healthcare systems and high adoption rates, while Asia Pacific is poised for substantial growth driven by increasing healthcare expenditure and rising prevalence of target diseases.
PET Scanner Industry Report: 2019-2033 Market Analysis & Forecast
This comprehensive report provides a detailed analysis of the PET Scanner industry, offering valuable insights for industry professionals, investors, and strategic decision-makers. The report covers the period 2019-2033, with a focus on the forecast period 2025-2033 and a base year of 2025. The report's data-driven approach provides actionable intelligence on market size (in Millions), growth drivers, challenges, and future opportunities across various segments.
PET Scanner Industry Market Structure & Innovation Trends
The PET scanner market is characterized by a moderate level of concentration, with key players like Siemens Healthineers AG, GE Healthcare, and Philips holding significant market share. However, smaller companies like Positron Corporation and Mediso Ltd are contributing to innovation and market dynamism. The industry is driven by technological advancements, including improved image resolution, faster scan times, and the development of hybrid PET/CT and PET/MRI systems. Regulatory frameworks, particularly those related to radiation safety and medical device approvals, significantly influence market dynamics. Product substitutes, such as SPECT and MRI, compete for market share, especially in certain applications. The end-user demographics are largely driven by the prevalence of cancer and other diseases requiring PET scans.
Key Metrics & Trends:
- Market Concentration: Moderate, with top 5 players holding approximately xx% market share in 2025.
- M&A Activity: A moderate level of M&A activity is observed, with deal values averaging xx Million in the past 5 years (2019-2024). Examples include the acquisition of xx by xx in 2022 for xx Million.
- Innovation Drivers: Advanced imaging technology, hybrid systems, and AI integration.
- Regulatory Landscape: Stringent regulations regarding radiation safety and medical device approval influence market access.
PET Scanner Industry Market Dynamics & Trends
The PET scanner market is experiencing robust growth, driven by increasing prevalence of cancer, growing demand for early and accurate diagnosis, technological advancements offering improved image quality and speed, and rising healthcare expenditure globally. The market exhibits a strong correlation with advancements in radiotracer technology. Competitive dynamics are intense, with major players focusing on innovation, strategic partnerships, and geographical expansion. The CAGR for the forecast period (2025-2033) is estimated at xx%, indicating substantial market expansion. Market penetration in developing economies remains relatively low, representing a significant opportunity for growth.
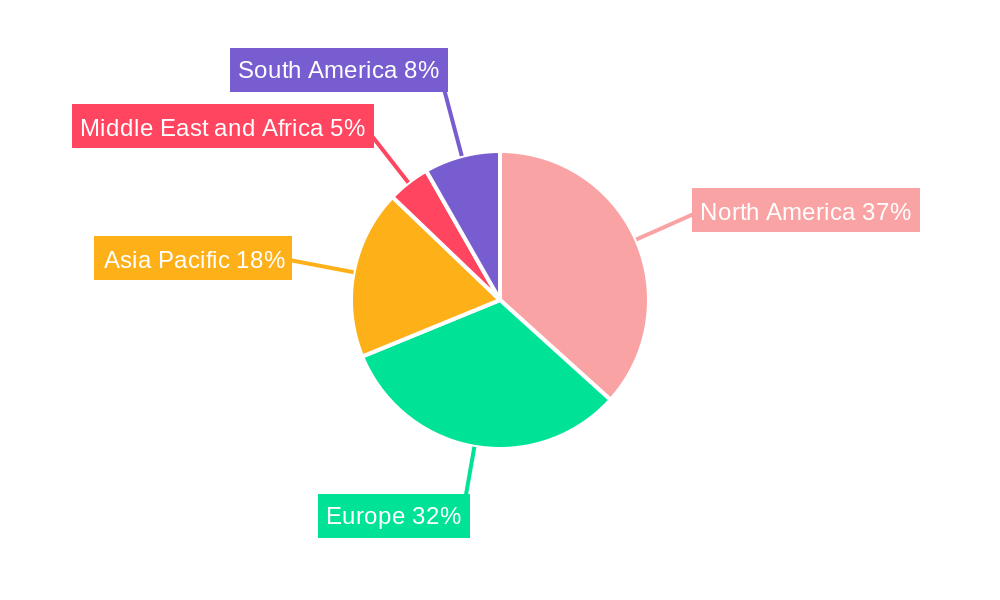
Dominant Regions & Segments in PET Scanner Industry
North America currently dominates the PET scanner market, driven by high healthcare expenditure, advanced infrastructure, and early adoption of new technologies. However, Asia-Pacific is experiencing rapid growth due to increasing healthcare investment and rising prevalence of target diseases.
Dominant Segments:
- Product Type: Full-ring PET scanners currently hold the largest market share due to their superior image quality and versatility. However, partial-ring scanners are gaining traction due to their cost-effectiveness.
- Application: Oncology accounts for the largest share of PET scanner applications, followed by cardiology and neurology.
- End-User: Hospitals are the primary end-users, followed by diagnostic centers.
Key Drivers by Region:
- North America: High healthcare spending, robust regulatory framework, and early adoption of new technologies.
- Europe: Well-established healthcare infrastructure and high adoption rates in developed countries.
- Asia-Pacific: Rapid economic growth, increasing healthcare investment, and rising prevalence of chronic diseases.
PET Scanner Industry Product Innovations
Recent years have witnessed significant advancements in PET scanner technology, including the development of higher-resolution detectors, improved image reconstruction algorithms, and the integration of AI for automated image analysis. Hybrid PET/CT and PET/MRI systems are gaining popularity due to their ability to provide comprehensive diagnostic information. The market is also witnessing increased focus on organ-targeted PET imaging systems like the Radialis PET Imager, offering enhanced sensitivity and spatial resolution. These innovations are addressing unmet clinical needs, improving diagnostic accuracy, and ultimately enhancing patient care.
Report Scope & Segmentation Analysis
This report segments the PET scanner market by product type (full-ring and partial-ring scanners), application (cardiology, neurology, oncology, and other applications), and end-user (hospitals, diagnostic centers, and other end-users). Each segment is analyzed in detail, providing insights into market size, growth projections, and competitive dynamics. The full-ring segment is projected to maintain its dominance, while the partial-ring segment is expected to witness significant growth driven by cost-effectiveness. The oncology application segment remains the largest, with significant growth expected in other applications, such as cardiology and neurology. The hospital segment holds the largest end-user market share.
Key Drivers of PET Scanner Industry Growth
Several key factors drive PET scanner industry growth. These include the rising prevalence of cancer and other diseases requiring PET scans, increasing demand for accurate and timely diagnosis, advancements in imaging technology resulting in improved image quality and faster scan times, and increased healthcare spending globally. The development of new radiotracers and the growing adoption of hybrid imaging systems also contribute significantly to market expansion.
Challenges in the PET Scanner Industry Sector
Challenges facing the PET scanner industry include the high cost of equipment and radiopharmaceuticals, stringent regulatory requirements for medical devices and radioactive materials, complexities in the supply chain, and intense competition from established players and emerging market entrants. These factors can limit market accessibility, especially in resource-constrained settings. The industry is also facing challenges from evolving reimbursement policies in some regions, which impact market adoption.
Emerging Opportunities in PET Scanner Industry
Emerging opportunities include expanding into developing markets with unmet medical needs, developing new radiotracers for improved diagnostic accuracy, leveraging AI and machine learning for enhanced image analysis, and integrating PET scanners with other imaging modalities. There's also the potential for growth in personalized medicine applications, leveraging PET scans for targeted therapies.
Leading Players in the PET Scanner Industry Market
- CMR Naviscan
- Oncovision
- Mediso Ltd
- Segami Corporation
- Agfa Healthcare
- Siemens Healthineers AG
- Cardinal Health
- General Electric Company (GE Healthcare)
- Koninklijke Philips NV
- Neusoft Corporation
- Biosensors International (Spectrum Dynamics Ltd)
- Positron Corporation
Key Developments in PET Scanner Industry
- July 2022: Radialis Inc. received clearance to market the Radialis PET Imager in the United States.
- August 2022: Positron Corporation purchased its first PET-CT system from Neusoft Medical Systems.
Future Outlook for PET Scanner Industry Market
The PET scanner market is poised for continued growth, driven by technological advancements, increasing prevalence of chronic diseases, and expanding healthcare infrastructure globally. Strategic opportunities exist in developing innovative products, expanding into new markets, and forging strategic partnerships. The market is expected to witness significant consolidation and further technological innovations in the coming years.
PET Scanner Industry Segmentation
-
1. Product Type
- 1.1. Full Ring PET Scanners
- 1.2. Partial Ring PET Scanners
-
2. Application
- 2.1. Cardiology
- 2.2. Neurology
- 2.3. Oncology
- 2.4. Other Applications
-
3. End-User
- 3.1. Hospitals
- 3.2. Diagnostic Centers
- 3.3. Other End-Users
PET Scanner Industry Segmentation By Geography
-
1. North America
- 1.1. United States
- 1.2. Canada
- 1.3. Mexico
-
2. Europe
- 2.1. Germany
- 2.2. United Kingdom
- 2.3. France
- 2.4. Italy
- 2.5. Spain
- 2.6. Rest of Europe
-
3. Asia Pacific
- 3.1. China
- 3.2. Japan
- 3.3. India
- 3.4. Australia
- 3.5. South Korea
- 3.6. Rest of Asia Pacific
-
4. Middle East and Africa
- 4.1. GCC
- 4.2. South Africa
- 4.3. Rest of Middle East and Africa
-
5. South America
- 5.1. Brazil
- 5.2. Argentina
- 5.3. Rest of South America
PET Scanner Industry REPORT HIGHLIGHTS
| Aspects | Details |
|---|---|
| Study Period | 2019-2033 |
| Base Year | 2024 |
| Estimated Year | 2025 |
| Forecast Period | 2025-2033 |
| Historical Period | 2019-2024 |
| Growth Rate | CAGR of 3.71% from 2019-2033 |
| Segmentation |
|
Table of Contents
- 1. Introduction
- 1.1. Research Scope
- 1.2. Market Segmentation
- 1.3. Research Methodology
- 1.4. Definitions and Assumptions
- 2. Executive Summary
- 2.1. Introduction
- 3. Market Dynamics
- 3.1. Introduction
- 3.2. Market Drivers
- 3.2.1. Increasing Demand for PET Analysis in Radio Pharmaceuticals; Technological Advancements in PET Imaging for Oncology and Advanced Diagnostics Applications; Integration of X-ray Tomography (CT) into PET
- 3.3. Market Restrains
- 3.3.1. Shorter Half-life of Radioisotopes; Stringent Regulatory Guidelines
- 3.4. Market Trends
- 3.4.1. The Oncology Segment is Expected to Hold a Significant Market Share Over the Forecast Period
- 4. Market Factor Analysis
- 4.1. Porters Five Forces
- 4.2. Supply/Value Chain
- 4.3. PESTEL analysis
- 4.4. Market Entropy
- 4.5. Patent/Trademark Analysis
- 5. Global PET Scanner Industry Analysis, Insights and Forecast, 2019-2031
- 5.1. Market Analysis, Insights and Forecast - by Product Type
- 5.1.1. Full Ring PET Scanners
- 5.1.2. Partial Ring PET Scanners
- 5.2. Market Analysis, Insights and Forecast - by Application
- 5.2.1. Cardiology
- 5.2.2. Neurology
- 5.2.3. Oncology
- 5.2.4. Other Applications
- 5.3. Market Analysis, Insights and Forecast - by End-User
- 5.3.1. Hospitals
- 5.3.2. Diagnostic Centers
- 5.3.3. Other End-Users
- 5.4. Market Analysis, Insights and Forecast - by Region
- 5.4.1. North America
- 5.4.2. Europe
- 5.4.3. Asia Pacific
- 5.4.4. Middle East and Africa
- 5.4.5. South America
- 5.1. Market Analysis, Insights and Forecast - by Product Type
- 6. North America PET Scanner Industry Analysis, Insights and Forecast, 2019-2031
- 6.1. Market Analysis, Insights and Forecast - by Product Type
- 6.1.1. Full Ring PET Scanners
- 6.1.2. Partial Ring PET Scanners
- 6.2. Market Analysis, Insights and Forecast - by Application
- 6.2.1. Cardiology
- 6.2.2. Neurology
- 6.2.3. Oncology
- 6.2.4. Other Applications
- 6.3. Market Analysis, Insights and Forecast - by End-User
- 6.3.1. Hospitals
- 6.3.2. Diagnostic Centers
- 6.3.3. Other End-Users
- 6.1. Market Analysis, Insights and Forecast - by Product Type
- 7. Europe PET Scanner Industry Analysis, Insights and Forecast, 2019-2031
- 7.1. Market Analysis, Insights and Forecast - by Product Type
- 7.1.1. Full Ring PET Scanners
- 7.1.2. Partial Ring PET Scanners
- 7.2. Market Analysis, Insights and Forecast - by Application
- 7.2.1. Cardiology
- 7.2.2. Neurology
- 7.2.3. Oncology
- 7.2.4. Other Applications
- 7.3. Market Analysis, Insights and Forecast - by End-User
- 7.3.1. Hospitals
- 7.3.2. Diagnostic Centers
- 7.3.3. Other End-Users
- 7.1. Market Analysis, Insights and Forecast - by Product Type
- 8. Asia Pacific PET Scanner Industry Analysis, Insights and Forecast, 2019-2031
- 8.1. Market Analysis, Insights and Forecast - by Product Type
- 8.1.1. Full Ring PET Scanners
- 8.1.2. Partial Ring PET Scanners
- 8.2. Market Analysis, Insights and Forecast - by Application
- 8.2.1. Cardiology
- 8.2.2. Neurology
- 8.2.3. Oncology
- 8.2.4. Other Applications
- 8.3. Market Analysis, Insights and Forecast - by End-User
- 8.3.1. Hospitals
- 8.3.2. Diagnostic Centers
- 8.3.3. Other End-Users
- 8.1. Market Analysis, Insights and Forecast - by Product Type
- 9. Middle East and Africa PET Scanner Industry Analysis, Insights and Forecast, 2019-2031
- 9.1. Market Analysis, Insights and Forecast - by Product Type
- 9.1.1. Full Ring PET Scanners
- 9.1.2. Partial Ring PET Scanners
- 9.2. Market Analysis, Insights and Forecast - by Application
- 9.2.1. Cardiology
- 9.2.2. Neurology
- 9.2.3. Oncology
- 9.2.4. Other Applications
- 9.3. Market Analysis, Insights and Forecast - by End-User
- 9.3.1. Hospitals
- 9.3.2. Diagnostic Centers
- 9.3.3. Other End-Users
- 9.1. Market Analysis, Insights and Forecast - by Product Type
- 10. South America PET Scanner Industry Analysis, Insights and Forecast, 2019-2031
- 10.1. Market Analysis, Insights and Forecast - by Product Type
- 10.1.1. Full Ring PET Scanners
- 10.1.2. Partial Ring PET Scanners
- 10.2. Market Analysis, Insights and Forecast - by Application
- 10.2.1. Cardiology
- 10.2.2. Neurology
- 10.2.3. Oncology
- 10.2.4. Other Applications
- 10.3. Market Analysis, Insights and Forecast - by End-User
- 10.3.1. Hospitals
- 10.3.2. Diagnostic Centers
- 10.3.3. Other End-Users
- 10.1. Market Analysis, Insights and Forecast - by Product Type
- 11. North America PET Scanner Industry Analysis, Insights and Forecast, 2019-2031
- 11.1. Market Analysis, Insights and Forecast - By Country/Sub-region
- 11.1.1 United States
- 11.1.2 Canada
- 11.1.3 Mexico
- 12. Europe PET Scanner Industry Analysis, Insights and Forecast, 2019-2031
- 12.1. Market Analysis, Insights and Forecast - By Country/Sub-region
- 12.1.1 Germany
- 12.1.2 United Kingdom
- 12.1.3 France
- 12.1.4 Italy
- 12.1.5 Spain
- 12.1.6 Rest of Europe
- 13. Asia Pacific PET Scanner Industry Analysis, Insights and Forecast, 2019-2031
- 13.1. Market Analysis, Insights and Forecast - By Country/Sub-region
- 13.1.1 China
- 13.1.2 Japan
- 13.1.3 India
- 13.1.4 Australia
- 13.1.5 South Korea
- 13.1.6 Rest of Asia Pacific
- 14. Middle East and Africa PET Scanner Industry Analysis, Insights and Forecast, 2019-2031
- 14.1. Market Analysis, Insights and Forecast - By Country/Sub-region
- 14.1.1 GCC
- 14.1.2 South Africa
- 14.1.3 Rest of Middle East and Africa
- 15. South America PET Scanner Industry Analysis, Insights and Forecast, 2019-2031
- 15.1. Market Analysis, Insights and Forecast - By Country/Sub-region
- 15.1.1 Brazil
- 15.1.2 Argentina
- 15.1.3 Rest of South America
- 16. Competitive Analysis
- 16.1. Global Market Share Analysis 2024
- 16.2. Company Profiles
- 16.2.1 CMR Naviscan
- 16.2.1.1. Overview
- 16.2.1.2. Products
- 16.2.1.3. SWOT Analysis
- 16.2.1.4. Recent Developments
- 16.2.1.5. Financials (Based on Availability)
- 16.2.2 Oncovision
- 16.2.2.1. Overview
- 16.2.2.2. Products
- 16.2.2.3. SWOT Analysis
- 16.2.2.4. Recent Developments
- 16.2.2.5. Financials (Based on Availability)
- 16.2.3 Mediso Ltd
- 16.2.3.1. Overview
- 16.2.3.2. Products
- 16.2.3.3. SWOT Analysis
- 16.2.3.4. Recent Developments
- 16.2.3.5. Financials (Based on Availability)
- 16.2.4 Segami Corporation
- 16.2.4.1. Overview
- 16.2.4.2. Products
- 16.2.4.3. SWOT Analysis
- 16.2.4.4. Recent Developments
- 16.2.4.5. Financials (Based on Availability)
- 16.2.5 Agfa Healthcare
- 16.2.5.1. Overview
- 16.2.5.2. Products
- 16.2.5.3. SWOT Analysis
- 16.2.5.4. Recent Developments
- 16.2.5.5. Financials (Based on Availability)
- 16.2.6 Siemens Healthineers AG
- 16.2.6.1. Overview
- 16.2.6.2. Products
- 16.2.6.3. SWOT Analysis
- 16.2.6.4. Recent Developments
- 16.2.6.5. Financials (Based on Availability)
- 16.2.7 Cardinal Health
- 16.2.7.1. Overview
- 16.2.7.2. Products
- 16.2.7.3. SWOT Analysis
- 16.2.7.4. Recent Developments
- 16.2.7.5. Financials (Based on Availability)
- 16.2.8 General Electric Company (GE Healthcare)
- 16.2.8.1. Overview
- 16.2.8.2. Products
- 16.2.8.3. SWOT Analysis
- 16.2.8.4. Recent Developments
- 16.2.8.5. Financials (Based on Availability)
- 16.2.9 Koninklijke Philips NV
- 16.2.9.1. Overview
- 16.2.9.2. Products
- 16.2.9.3. SWOT Analysis
- 16.2.9.4. Recent Developments
- 16.2.9.5. Financials (Based on Availability)
- 16.2.10 Neusoft Corporation
- 16.2.10.1. Overview
- 16.2.10.2. Products
- 16.2.10.3. SWOT Analysis
- 16.2.10.4. Recent Developments
- 16.2.10.5. Financials (Based on Availability)
- 16.2.11 Biosensors International (Spectrum Dynamics Ltd)
- 16.2.11.1. Overview
- 16.2.11.2. Products
- 16.2.11.3. SWOT Analysis
- 16.2.11.4. Recent Developments
- 16.2.11.5. Financials (Based on Availability)
- 16.2.12 Positron Corporation
- 16.2.12.1. Overview
- 16.2.12.2. Products
- 16.2.12.3. SWOT Analysis
- 16.2.12.4. Recent Developments
- 16.2.12.5. Financials (Based on Availability)
- 16.2.1 CMR Naviscan
List of Figures
- Figure 1: Global PET Scanner Industry Revenue Breakdown (Million, %) by Region 2024 & 2032
- Figure 2: Global PET Scanner Industry Volume Breakdown (K Unit, %) by Region 2024 & 2032
- Figure 3: North America PET Scanner Industry Revenue (Million), by Country 2024 & 2032
- Figure 4: North America PET Scanner Industry Volume (K Unit), by Country 2024 & 2032
- Figure 5: North America PET Scanner Industry Revenue Share (%), by Country 2024 & 2032
- Figure 6: North America PET Scanner Industry Volume Share (%), by Country 2024 & 2032
- Figure 7: Europe PET Scanner Industry Revenue (Million), by Country 2024 & 2032
- Figure 8: Europe PET Scanner Industry Volume (K Unit), by Country 2024 & 2032
- Figure 9: Europe PET Scanner Industry Revenue Share (%), by Country 2024 & 2032
- Figure 10: Europe PET Scanner Industry Volume Share (%), by Country 2024 & 2032
- Figure 11: Asia Pacific PET Scanner Industry Revenue (Million), by Country 2024 & 2032
- Figure 12: Asia Pacific PET Scanner Industry Volume (K Unit), by Country 2024 & 2032
- Figure 13: Asia Pacific PET Scanner Industry Revenue Share (%), by Country 2024 & 2032
- Figure 14: Asia Pacific PET Scanner Industry Volume Share (%), by Country 2024 & 2032
- Figure 15: Middle East and Africa PET Scanner Industry Revenue (Million), by Country 2024 & 2032
- Figure 16: Middle East and Africa PET Scanner Industry Volume (K Unit), by Country 2024 & 2032
- Figure 17: Middle East and Africa PET Scanner Industry Revenue Share (%), by Country 2024 & 2032
- Figure 18: Middle East and Africa PET Scanner Industry Volume Share (%), by Country 2024 & 2032
- Figure 19: South America PET Scanner Industry Revenue (Million), by Country 2024 & 2032
- Figure 20: South America PET Scanner Industry Volume (K Unit), by Country 2024 & 2032
- Figure 21: South America PET Scanner Industry Revenue Share (%), by Country 2024 & 2032
- Figure 22: South America PET Scanner Industry Volume Share (%), by Country 2024 & 2032
- Figure 23: North America PET Scanner Industry Revenue (Million), by Product Type 2024 & 2032
- Figure 24: North America PET Scanner Industry Volume (K Unit), by Product Type 2024 & 2032
- Figure 25: North America PET Scanner Industry Revenue Share (%), by Product Type 2024 & 2032
- Figure 26: North America PET Scanner Industry Volume Share (%), by Product Type 2024 & 2032
- Figure 27: North America PET Scanner Industry Revenue (Million), by Application 2024 & 2032
- Figure 28: North America PET Scanner Industry Volume (K Unit), by Application 2024 & 2032
- Figure 29: North America PET Scanner Industry Revenue Share (%), by Application 2024 & 2032
- Figure 30: North America PET Scanner Industry Volume Share (%), by Application 2024 & 2032
- Figure 31: North America PET Scanner Industry Revenue (Million), by End-User 2024 & 2032
- Figure 32: North America PET Scanner Industry Volume (K Unit), by End-User 2024 & 2032
- Figure 33: North America PET Scanner Industry Revenue Share (%), by End-User 2024 & 2032
- Figure 34: North America PET Scanner Industry Volume Share (%), by End-User 2024 & 2032
- Figure 35: North America PET Scanner Industry Revenue (Million), by Country 2024 & 2032
- Figure 36: North America PET Scanner Industry Volume (K Unit), by Country 2024 & 2032
- Figure 37: North America PET Scanner Industry Revenue Share (%), by Country 2024 & 2032
- Figure 38: North America PET Scanner Industry Volume Share (%), by Country 2024 & 2032
- Figure 39: Europe PET Scanner Industry Revenue (Million), by Product Type 2024 & 2032
- Figure 40: Europe PET Scanner Industry Volume (K Unit), by Product Type 2024 & 2032
- Figure 41: Europe PET Scanner Industry Revenue Share (%), by Product Type 2024 & 2032
- Figure 42: Europe PET Scanner Industry Volume Share (%), by Product Type 2024 & 2032
- Figure 43: Europe PET Scanner Industry Revenue (Million), by Application 2024 & 2032
- Figure 44: Europe PET Scanner Industry Volume (K Unit), by Application 2024 & 2032
- Figure 45: Europe PET Scanner Industry Revenue Share (%), by Application 2024 & 2032
- Figure 46: Europe PET Scanner Industry Volume Share (%), by Application 2024 & 2032
- Figure 47: Europe PET Scanner Industry Revenue (Million), by End-User 2024 & 2032
- Figure 48: Europe PET Scanner Industry Volume (K Unit), by End-User 2024 & 2032
- Figure 49: Europe PET Scanner Industry Revenue Share (%), by End-User 2024 & 2032
- Figure 50: Europe PET Scanner Industry Volume Share (%), by End-User 2024 & 2032
- Figure 51: Europe PET Scanner Industry Revenue (Million), by Country 2024 & 2032
- Figure 52: Europe PET Scanner Industry Volume (K Unit), by Country 2024 & 2032
- Figure 53: Europe PET Scanner Industry Revenue Share (%), by Country 2024 & 2032
- Figure 54: Europe PET Scanner Industry Volume Share (%), by Country 2024 & 2032
- Figure 55: Asia Pacific PET Scanner Industry Revenue (Million), by Product Type 2024 & 2032
- Figure 56: Asia Pacific PET Scanner Industry Volume (K Unit), by Product Type 2024 & 2032
- Figure 57: Asia Pacific PET Scanner Industry Revenue Share (%), by Product Type 2024 & 2032
- Figure 58: Asia Pacific PET Scanner Industry Volume Share (%), by Product Type 2024 & 2032
- Figure 59: Asia Pacific PET Scanner Industry Revenue (Million), by Application 2024 & 2032
- Figure 60: Asia Pacific PET Scanner Industry Volume (K Unit), by Application 2024 & 2032
- Figure 61: Asia Pacific PET Scanner Industry Revenue Share (%), by Application 2024 & 2032
- Figure 62: Asia Pacific PET Scanner Industry Volume Share (%), by Application 2024 & 2032
- Figure 63: Asia Pacific PET Scanner Industry Revenue (Million), by End-User 2024 & 2032
- Figure 64: Asia Pacific PET Scanner Industry Volume (K Unit), by End-User 2024 & 2032
- Figure 65: Asia Pacific PET Scanner Industry Revenue Share (%), by End-User 2024 & 2032
- Figure 66: Asia Pacific PET Scanner Industry Volume Share (%), by End-User 2024 & 2032
- Figure 67: Asia Pacific PET Scanner Industry Revenue (Million), by Country 2024 & 2032
- Figure 68: Asia Pacific PET Scanner Industry Volume (K Unit), by Country 2024 & 2032
- Figure 69: Asia Pacific PET Scanner Industry Revenue Share (%), by Country 2024 & 2032
- Figure 70: Asia Pacific PET Scanner Industry Volume Share (%), by Country 2024 & 2032
- Figure 71: Middle East and Africa PET Scanner Industry Revenue (Million), by Product Type 2024 & 2032
- Figure 72: Middle East and Africa PET Scanner Industry Volume (K Unit), by Product Type 2024 & 2032
- Figure 73: Middle East and Africa PET Scanner Industry Revenue Share (%), by Product Type 2024 & 2032
- Figure 74: Middle East and Africa PET Scanner Industry Volume Share (%), by Product Type 2024 & 2032
- Figure 75: Middle East and Africa PET Scanner Industry Revenue (Million), by Application 2024 & 2032
- Figure 76: Middle East and Africa PET Scanner Industry Volume (K Unit), by Application 2024 & 2032
- Figure 77: Middle East and Africa PET Scanner Industry Revenue Share (%), by Application 2024 & 2032
- Figure 78: Middle East and Africa PET Scanner Industry Volume Share (%), by Application 2024 & 2032
- Figure 79: Middle East and Africa PET Scanner Industry Revenue (Million), by End-User 2024 & 2032
- Figure 80: Middle East and Africa PET Scanner Industry Volume (K Unit), by End-User 2024 & 2032
- Figure 81: Middle East and Africa PET Scanner Industry Revenue Share (%), by End-User 2024 & 2032
- Figure 82: Middle East and Africa PET Scanner Industry Volume Share (%), by End-User 2024 & 2032
- Figure 83: Middle East and Africa PET Scanner Industry Revenue (Million), by Country 2024 & 2032
- Figure 84: Middle East and Africa PET Scanner Industry Volume (K Unit), by Country 2024 & 2032
- Figure 85: Middle East and Africa PET Scanner Industry Revenue Share (%), by Country 2024 & 2032
- Figure 86: Middle East and Africa PET Scanner Industry Volume Share (%), by Country 2024 & 2032
- Figure 87: South America PET Scanner Industry Revenue (Million), by Product Type 2024 & 2032
- Figure 88: South America PET Scanner Industry Volume (K Unit), by Product Type 2024 & 2032
- Figure 89: South America PET Scanner Industry Revenue Share (%), by Product Type 2024 & 2032
- Figure 90: South America PET Scanner Industry Volume Share (%), by Product Type 2024 & 2032
- Figure 91: South America PET Scanner Industry Revenue (Million), by Application 2024 & 2032
- Figure 92: South America PET Scanner Industry Volume (K Unit), by Application 2024 & 2032
- Figure 93: South America PET Scanner Industry Revenue Share (%), by Application 2024 & 2032
- Figure 94: South America PET Scanner Industry Volume Share (%), by Application 2024 & 2032
- Figure 95: South America PET Scanner Industry Revenue (Million), by End-User 2024 & 2032
- Figure 96: South America PET Scanner Industry Volume (K Unit), by End-User 2024 & 2032
- Figure 97: South America PET Scanner Industry Revenue Share (%), by End-User 2024 & 2032
- Figure 98: South America PET Scanner Industry Volume Share (%), by End-User 2024 & 2032
- Figure 99: South America PET Scanner Industry Revenue (Million), by Country 2024 & 2032
- Figure 100: South America PET Scanner Industry Volume (K Unit), by Country 2024 & 2032
- Figure 101: South America PET Scanner Industry Revenue Share (%), by Country 2024 & 2032
- Figure 102: South America PET Scanner Industry Volume Share (%), by Country 2024 & 2032
List of Tables
- Table 1: Global PET Scanner Industry Revenue Million Forecast, by Region 2019 & 2032
- Table 2: Global PET Scanner Industry Volume K Unit Forecast, by Region 2019 & 2032
- Table 3: Global PET Scanner Industry Revenue Million Forecast, by Product Type 2019 & 2032
- Table 4: Global PET Scanner Industry Volume K Unit Forecast, by Product Type 2019 & 2032
- Table 5: Global PET Scanner Industry Revenue Million Forecast, by Application 2019 & 2032
- Table 6: Global PET Scanner Industry Volume K Unit Forecast, by Application 2019 & 2032
- Table 7: Global PET Scanner Industry Revenue Million Forecast, by End-User 2019 & 2032
- Table 8: Global PET Scanner Industry Volume K Unit Forecast, by End-User 2019 & 2032
- Table 9: Global PET Scanner Industry Revenue Million Forecast, by Region 2019 & 2032
- Table 10: Global PET Scanner Industry Volume K Unit Forecast, by Region 2019 & 2032
- Table 11: Global PET Scanner Industry Revenue Million Forecast, by Country 2019 & 2032
- Table 12: Global PET Scanner Industry Volume K Unit Forecast, by Country 2019 & 2032
- Table 13: United States PET Scanner Industry Revenue (Million) Forecast, by Application 2019 & 2032
- Table 14: United States PET Scanner Industry Volume (K Unit) Forecast, by Application 2019 & 2032
- Table 15: Canada PET Scanner Industry Revenue (Million) Forecast, by Application 2019 & 2032
- Table 16: Canada PET Scanner Industry Volume (K Unit) Forecast, by Application 2019 & 2032
- Table 17: Mexico PET Scanner Industry Revenue (Million) Forecast, by Application 2019 & 2032
- Table 18: Mexico PET Scanner Industry Volume (K Unit) Forecast, by Application 2019 & 2032
- Table 19: Global PET Scanner Industry Revenue Million Forecast, by Country 2019 & 2032
- Table 20: Global PET Scanner Industry Volume K Unit Forecast, by Country 2019 & 2032
- Table 21: Germany PET Scanner Industry Revenue (Million) Forecast, by Application 2019 & 2032
- Table 22: Germany PET Scanner Industry Volume (K Unit) Forecast, by Application 2019 & 2032
- Table 23: United Kingdom PET Scanner Industry Revenue (Million) Forecast, by Application 2019 & 2032
- Table 24: United Kingdom PET Scanner Industry Volume (K Unit) Forecast, by Application 2019 & 2032
- Table 25: France PET Scanner Industry Revenue (Million) Forecast, by Application 2019 & 2032
- Table 26: France PET Scanner Industry Volume (K Unit) Forecast, by Application 2019 & 2032
- Table 27: Italy PET Scanner Industry Revenue (Million) Forecast, by Application 2019 & 2032
- Table 28: Italy PET Scanner Industry Volume (K Unit) Forecast, by Application 2019 & 2032
- Table 29: Spain PET Scanner Industry Revenue (Million) Forecast, by Application 2019 & 2032
- Table 30: Spain PET Scanner Industry Volume (K Unit) Forecast, by Application 2019 & 2032
- Table 31: Rest of Europe PET Scanner Industry Revenue (Million) Forecast, by Application 2019 & 2032
- Table 32: Rest of Europe PET Scanner Industry Volume (K Unit) Forecast, by Application 2019 & 2032
- Table 33: Global PET Scanner Industry Revenue Million Forecast, by Country 2019 & 2032
- Table 34: Global PET Scanner Industry Volume K Unit Forecast, by Country 2019 & 2032
- Table 35: China PET Scanner Industry Revenue (Million) Forecast, by Application 2019 & 2032
- Table 36: China PET Scanner Industry Volume (K Unit) Forecast, by Application 2019 & 2032
- Table 37: Japan PET Scanner Industry Revenue (Million) Forecast, by Application 2019 & 2032
- Table 38: Japan PET Scanner Industry Volume (K Unit) Forecast, by Application 2019 & 2032
- Table 39: India PET Scanner Industry Revenue (Million) Forecast, by Application 2019 & 2032
- Table 40: India PET Scanner Industry Volume (K Unit) Forecast, by Application 2019 & 2032
- Table 41: Australia PET Scanner Industry Revenue (Million) Forecast, by Application 2019 & 2032
- Table 42: Australia PET Scanner Industry Volume (K Unit) Forecast, by Application 2019 & 2032
- Table 43: South Korea PET Scanner Industry Revenue (Million) Forecast, by Application 2019 & 2032
- Table 44: South Korea PET Scanner Industry Volume (K Unit) Forecast, by Application 2019 & 2032
- Table 45: Rest of Asia Pacific PET Scanner Industry Revenue (Million) Forecast, by Application 2019 & 2032
- Table 46: Rest of Asia Pacific PET Scanner Industry Volume (K Unit) Forecast, by Application 2019 & 2032
- Table 47: Global PET Scanner Industry Revenue Million Forecast, by Country 2019 & 2032
- Table 48: Global PET Scanner Industry Volume K Unit Forecast, by Country 2019 & 2032
- Table 49: GCC PET Scanner Industry Revenue (Million) Forecast, by Application 2019 & 2032
- Table 50: GCC PET Scanner Industry Volume (K Unit) Forecast, by Application 2019 & 2032
- Table 51: South Africa PET Scanner Industry Revenue (Million) Forecast, by Application 2019 & 2032
- Table 52: South Africa PET Scanner Industry Volume (K Unit) Forecast, by Application 2019 & 2032
- Table 53: Rest of Middle East and Africa PET Scanner Industry Revenue (Million) Forecast, by Application 2019 & 2032
- Table 54: Rest of Middle East and Africa PET Scanner Industry Volume (K Unit) Forecast, by Application 2019 & 2032
- Table 55: Global PET Scanner Industry Revenue Million Forecast, by Country 2019 & 2032
- Table 56: Global PET Scanner Industry Volume K Unit Forecast, by Country 2019 & 2032
- Table 57: Brazil PET Scanner Industry Revenue (Million) Forecast, by Application 2019 & 2032
- Table 58: Brazil PET Scanner Industry Volume (K Unit) Forecast, by Application 2019 & 2032
- Table 59: Argentina PET Scanner Industry Revenue (Million) Forecast, by Application 2019 & 2032
- Table 60: Argentina PET Scanner Industry Volume (K Unit) Forecast, by Application 2019 & 2032
- Table 61: Rest of South America PET Scanner Industry Revenue (Million) Forecast, by Application 2019 & 2032
- Table 62: Rest of South America PET Scanner Industry Volume (K Unit) Forecast, by Application 2019 & 2032
- Table 63: Global PET Scanner Industry Revenue Million Forecast, by Product Type 2019 & 2032
- Table 64: Global PET Scanner Industry Volume K Unit Forecast, by Product Type 2019 & 2032
- Table 65: Global PET Scanner Industry Revenue Million Forecast, by Application 2019 & 2032
- Table 66: Global PET Scanner Industry Volume K Unit Forecast, by Application 2019 & 2032
- Table 67: Global PET Scanner Industry Revenue Million Forecast, by End-User 2019 & 2032
- Table 68: Global PET Scanner Industry Volume K Unit Forecast, by End-User 2019 & 2032
- Table 69: Global PET Scanner Industry Revenue Million Forecast, by Country 2019 & 2032
- Table 70: Global PET Scanner Industry Volume K Unit Forecast, by Country 2019 & 2032
- Table 71: United States PET Scanner Industry Revenue (Million) Forecast, by Application 2019 & 2032
- Table 72: United States PET Scanner Industry Volume (K Unit) Forecast, by Application 2019 & 2032
- Table 73: Canada PET Scanner Industry Revenue (Million) Forecast, by Application 2019 & 2032
- Table 74: Canada PET Scanner Industry Volume (K Unit) Forecast, by Application 2019 & 2032
- Table 75: Mexico PET Scanner Industry Revenue (Million) Forecast, by Application 2019 & 2032
- Table 76: Mexico PET Scanner Industry Volume (K Unit) Forecast, by Application 2019 & 2032
- Table 77: Global PET Scanner Industry Revenue Million Forecast, by Product Type 2019 & 2032
- Table 78: Global PET Scanner Industry Volume K Unit Forecast, by Product Type 2019 & 2032
- Table 79: Global PET Scanner Industry Revenue Million Forecast, by Application 2019 & 2032
- Table 80: Global PET Scanner Industry Volume K Unit Forecast, by Application 2019 & 2032
- Table 81: Global PET Scanner Industry Revenue Million Forecast, by End-User 2019 & 2032
- Table 82: Global PET Scanner Industry Volume K Unit Forecast, by End-User 2019 & 2032
- Table 83: Global PET Scanner Industry Revenue Million Forecast, by Country 2019 & 2032
- Table 84: Global PET Scanner Industry Volume K Unit Forecast, by Country 2019 & 2032
- Table 85: Germany PET Scanner Industry Revenue (Million) Forecast, by Application 2019 & 2032
- Table 86: Germany PET Scanner Industry Volume (K Unit) Forecast, by Application 2019 & 2032
- Table 87: United Kingdom PET Scanner Industry Revenue (Million) Forecast, by Application 2019 & 2032
- Table 88: United Kingdom PET Scanner Industry Volume (K Unit) Forecast, by Application 2019 & 2032
- Table 89: France PET Scanner Industry Revenue (Million) Forecast, by Application 2019 & 2032
- Table 90: France PET Scanner Industry Volume (K Unit) Forecast, by Application 2019 & 2032
- Table 91: Italy PET Scanner Industry Revenue (Million) Forecast, by Application 2019 & 2032
- Table 92: Italy PET Scanner Industry Volume (K Unit) Forecast, by Application 2019 & 2032
- Table 93: Spain PET Scanner Industry Revenue (Million) Forecast, by Application 2019 & 2032
- Table 94: Spain PET Scanner Industry Volume (K Unit) Forecast, by Application 2019 & 2032
- Table 95: Rest of Europe PET Scanner Industry Revenue (Million) Forecast, by Application 2019 & 2032
- Table 96: Rest of Europe PET Scanner Industry Volume (K Unit) Forecast, by Application 2019 & 2032
- Table 97: Global PET Scanner Industry Revenue Million Forecast, by Product Type 2019 & 2032
- Table 98: Global PET Scanner Industry Volume K Unit Forecast, by Product Type 2019 & 2032
- Table 99: Global PET Scanner Industry Revenue Million Forecast, by Application 2019 & 2032
- Table 100: Global PET Scanner Industry Volume K Unit Forecast, by Application 2019 & 2032
- Table 101: Global PET Scanner Industry Revenue Million Forecast, by End-User 2019 & 2032
- Table 102: Global PET Scanner Industry Volume K Unit Forecast, by End-User 2019 & 2032
- Table 103: Global PET Scanner Industry Revenue Million Forecast, by Country 2019 & 2032
- Table 104: Global PET Scanner Industry Volume K Unit Forecast, by Country 2019 & 2032
- Table 105: China PET Scanner Industry Revenue (Million) Forecast, by Application 2019 & 2032
- Table 106: China PET Scanner Industry Volume (K Unit) Forecast, by Application 2019 & 2032
- Table 107: Japan PET Scanner Industry Revenue (Million) Forecast, by Application 2019 & 2032
- Table 108: Japan PET Scanner Industry Volume (K Unit) Forecast, by Application 2019 & 2032
- Table 109: India PET Scanner Industry Revenue (Million) Forecast, by Application 2019 & 2032
- Table 110: India PET Scanner Industry Volume (K Unit) Forecast, by Application 2019 & 2032
- Table 111: Australia PET Scanner Industry Revenue (Million) Forecast, by Application 2019 & 2032
- Table 112: Australia PET Scanner Industry Volume (K Unit) Forecast, by Application 2019 & 2032
- Table 113: South Korea PET Scanner Industry Revenue (Million) Forecast, by Application 2019 & 2032
- Table 114: South Korea PET Scanner Industry Volume (K Unit) Forecast, by Application 2019 & 2032
- Table 115: Rest of Asia Pacific PET Scanner Industry Revenue (Million) Forecast, by Application 2019 & 2032
- Table 116: Rest of Asia Pacific PET Scanner Industry Volume (K Unit) Forecast, by Application 2019 & 2032
- Table 117: Global PET Scanner Industry Revenue Million Forecast, by Product Type 2019 & 2032
- Table 118: Global PET Scanner Industry Volume K Unit Forecast, by Product Type 2019 & 2032
- Table 119: Global PET Scanner Industry Revenue Million Forecast, by Application 2019 & 2032
- Table 120: Global PET Scanner Industry Volume K Unit Forecast, by Application 2019 & 2032
- Table 121: Global PET Scanner Industry Revenue Million Forecast, by End-User 2019 & 2032
- Table 122: Global PET Scanner Industry Volume K Unit Forecast, by End-User 2019 & 2032
- Table 123: Global PET Scanner Industry Revenue Million Forecast, by Country 2019 & 2032
- Table 124: Global PET Scanner Industry Volume K Unit Forecast, by Country 2019 & 2032
- Table 125: GCC PET Scanner Industry Revenue (Million) Forecast, by Application 2019 & 2032
- Table 126: GCC PET Scanner Industry Volume (K Unit) Forecast, by Application 2019 & 2032
- Table 127: South Africa PET Scanner Industry Revenue (Million) Forecast, by Application 2019 & 2032
- Table 128: South Africa PET Scanner Industry Volume (K Unit) Forecast, by Application 2019 & 2032
- Table 129: Rest of Middle East and Africa PET Scanner Industry Revenue (Million) Forecast, by Application 2019 & 2032
- Table 130: Rest of Middle East and Africa PET Scanner Industry Volume (K Unit) Forecast, by Application 2019 & 2032
- Table 131: Global PET Scanner Industry Revenue Million Forecast, by Product Type 2019 & 2032
- Table 132: Global PET Scanner Industry Volume K Unit Forecast, by Product Type 2019 & 2032
- Table 133: Global PET Scanner Industry Revenue Million Forecast, by Application 2019 & 2032
- Table 134: Global PET Scanner Industry Volume K Unit Forecast, by Application 2019 & 2032
- Table 135: Global PET Scanner Industry Revenue Million Forecast, by End-User 2019 & 2032
- Table 136: Global PET Scanner Industry Volume K Unit Forecast, by End-User 2019 & 2032
- Table 137: Global PET Scanner Industry Revenue Million Forecast, by Country 2019 & 2032
- Table 138: Global PET Scanner Industry Volume K Unit Forecast, by Country 2019 & 2032
- Table 139: Brazil PET Scanner Industry Revenue (Million) Forecast, by Application 2019 & 2032
- Table 140: Brazil PET Scanner Industry Volume (K Unit) Forecast, by Application 2019 & 2032
- Table 141: Argentina PET Scanner Industry Revenue (Million) Forecast, by Application 2019 & 2032
- Table 142: Argentina PET Scanner Industry Volume (K Unit) Forecast, by Application 2019 & 2032
- Table 143: Rest of South America PET Scanner Industry Revenue (Million) Forecast, by Application 2019 & 2032
- Table 144: Rest of South America PET Scanner Industry Volume (K Unit) Forecast, by Application 2019 & 2032
Frequently Asked Questions
1. What is the projected Compound Annual Growth Rate (CAGR) of the PET Scanner Industry?
The projected CAGR is approximately 3.71%.
2. Which companies are prominent players in the PET Scanner Industry?
Key companies in the market include CMR Naviscan, Oncovision, Mediso Ltd, Segami Corporation, Agfa Healthcare, Siemens Healthineers AG, Cardinal Health, General Electric Company (GE Healthcare), Koninklijke Philips NV, Neusoft Corporation, Biosensors International (Spectrum Dynamics Ltd), Positron Corporation.
3. What are the main segments of the PET Scanner Industry?
The market segments include Product Type, Application, End-User.
4. Can you provide details about the market size?
The market size is estimated to be USD 1.09 Million as of 2022.
5. What are some drivers contributing to market growth?
Increasing Demand for PET Analysis in Radio Pharmaceuticals; Technological Advancements in PET Imaging for Oncology and Advanced Diagnostics Applications; Integration of X-ray Tomography (CT) into PET.
6. What are the notable trends driving market growth?
The Oncology Segment is Expected to Hold a Significant Market Share Over the Forecast Period.
7. Are there any restraints impacting market growth?
Shorter Half-life of Radioisotopes; Stringent Regulatory Guidelines.
8. Can you provide examples of recent developments in the market?
August 2022- Positron Corporation, a nuclear medicine PET imaging device system and clinical services company, purchased its first PET-CT system and was on its way from its partner Neusoft Medical Systems. Positron's "Affinity PET-CT" system is on its way from China to its validation partner in the United States.
9. What pricing options are available for accessing the report?
Pricing options include single-user, multi-user, and enterprise licenses priced at USD 4750, USD 5250, and USD 8750 respectively.
10. Is the market size provided in terms of value or volume?
The market size is provided in terms of value, measured in Million and volume, measured in K Unit.
11. Are there any specific market keywords associated with the report?
Yes, the market keyword associated with the report is "PET Scanner Industry," which aids in identifying and referencing the specific market segment covered.
12. How do I determine which pricing option suits my needs best?
The pricing options vary based on user requirements and access needs. Individual users may opt for single-user licenses, while businesses requiring broader access may choose multi-user or enterprise licenses for cost-effective access to the report.
13. Are there any additional resources or data provided in the PET Scanner Industry report?
While the report offers comprehensive insights, it's advisable to review the specific contents or supplementary materials provided to ascertain if additional resources or data are available.
14. How can I stay updated on further developments or reports in the PET Scanner Industry?
To stay informed about further developments, trends, and reports in the PET Scanner Industry, consider subscribing to industry newsletters, following relevant companies and organizations, or regularly checking reputable industry news sources and publications.
Methodology
Step 1 - Identification of Relevant Samples Size from Population Database


Step 2 - Approaches for Defining Global Market Size (Value, Volume* & Price*)

Note*: In applicable scenarios
Step 3 - Data Sources
Primary Research
- Web Analytics
- Survey Reports
- Research Institute
- Latest Research Reports
- Opinion Leaders
Secondary Research
- Annual Reports
- White Paper
- Latest Press Release
- Industry Association
- Paid Database
- Investor Presentations

Step 4 - Data Triangulation
Involves using different sources of information in order to increase the validity of a study
These sources are likely to be stakeholders in a program - participants, other researchers, program staff, other community members, and so on.
Then we put all data in single framework & apply various statistical tools to find out the dynamic on the market.
During the analysis stage, feedback from the stakeholder groups would be compared to determine areas of agreement as well as areas of divergence


