
Key Insights
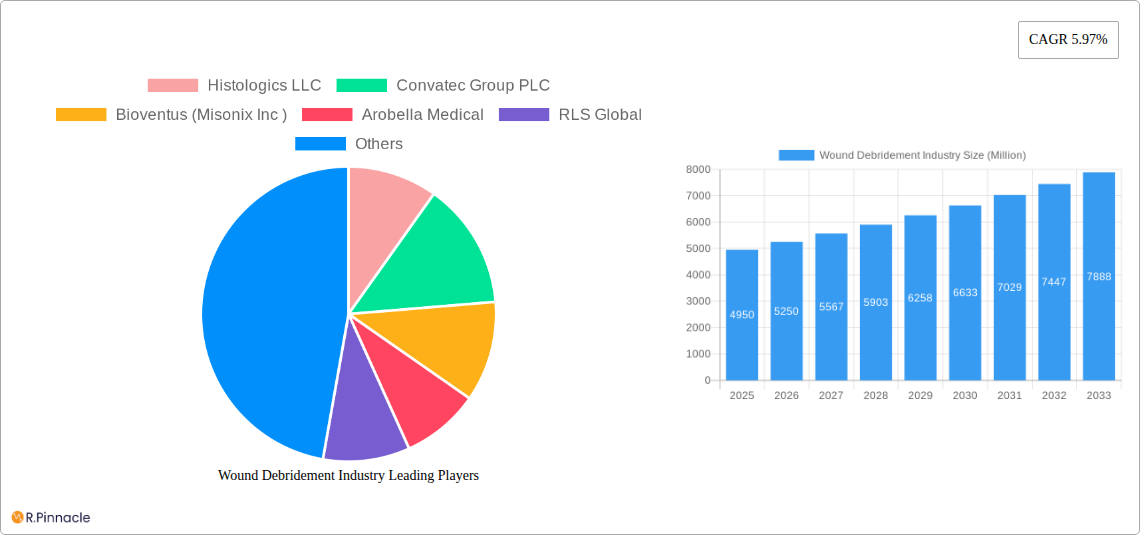
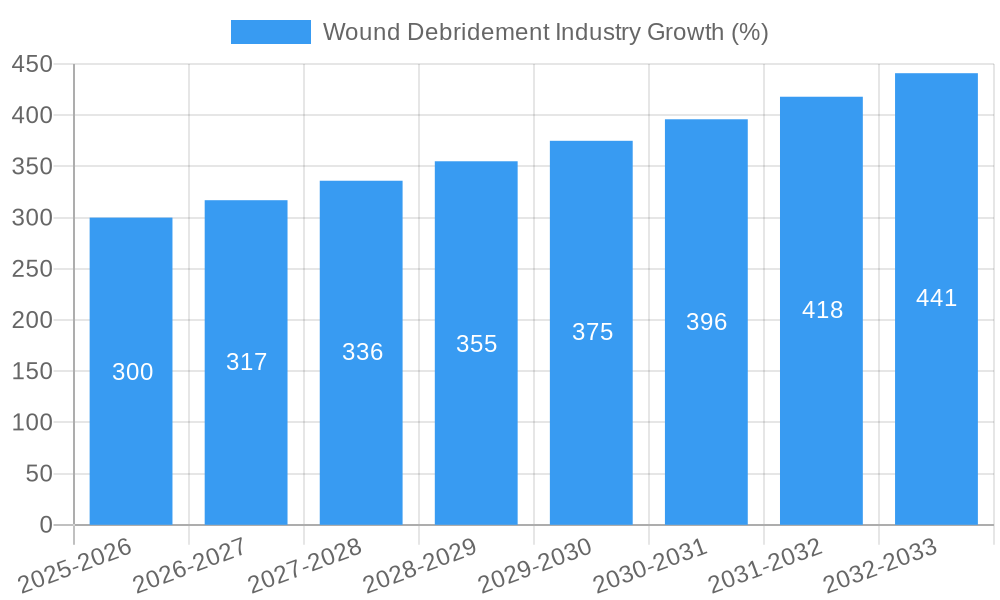
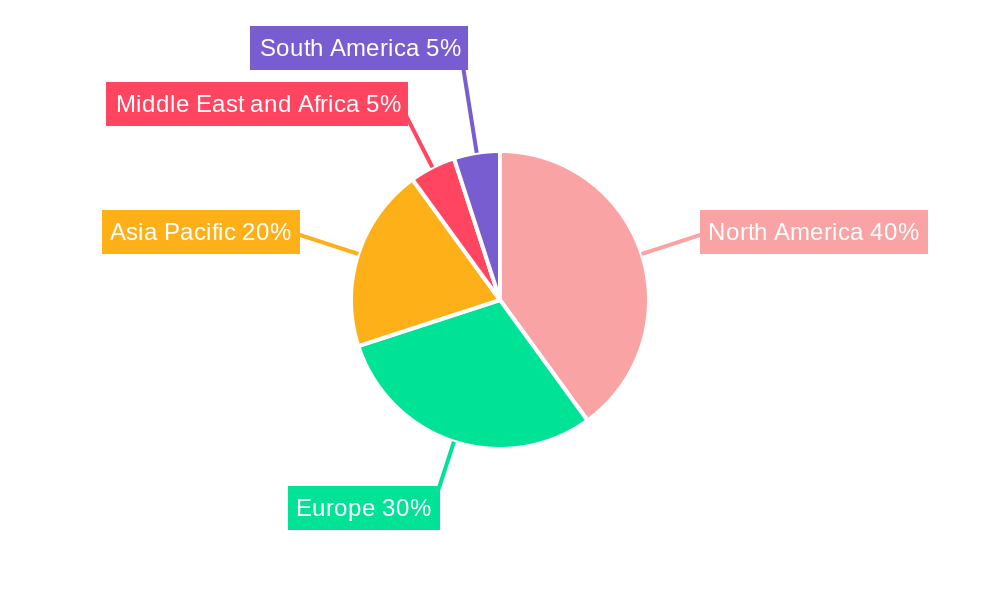
The global wound debridement market, valued at $4.95 billion in 2025, is projected to experience robust growth, driven by a rising prevalence of chronic wounds like diabetic ulcers and pressure injuries, coupled with an aging global population. The market's Compound Annual Growth Rate (CAGR) of 5.97% from 2025 to 2033 indicates significant expansion opportunities. This growth is fueled by advancements in debridement techniques, including the increasing adoption of minimally invasive methods like enzymatic debridement, which offers reduced pain and faster healing times compared to traditional surgical methods. Furthermore, the development of innovative products such as advanced gels, specialized wound dressings, and sophisticated ultrasound devices is contributing to market expansion. The surgical method currently holds a significant market share, but the enzymatic and autolytic methods are witnessing substantial growth, driven by their effectiveness and reduced invasiveness. Geographic segmentation reveals a strong presence in North America and Europe, largely due to advanced healthcare infrastructure and high healthcare expenditure. However, emerging markets in Asia-Pacific are expected to show significant growth potential in the coming years, fueled by increasing healthcare awareness and rising disposable incomes. Market restraints include the high cost of advanced debridement technologies, particularly in developing regions, and the potential for complications associated with certain debridement techniques.
The segmentation by wound type shows chronic ulcers dominating the market due to their prolonged healing time and increased need for debridement. Surgical and traumatic wounds represent a significant segment, while the burns segment is experiencing growth due to increasing burn incidents and the need for effective wound care. Within the product segment, gels, ointments, and creams maintain a substantial market share due to their ease of use and cost-effectiveness. However, the surgical devices and ultrasound devices segment shows strong growth potential, driven by their precision and efficacy in removing necrotic tissue. The competitive landscape is marked by a mix of established players and emerging companies, each offering a range of wound debridement products and services. Strategic collaborations, product innovation, and geographical expansion remain key growth strategies for companies operating within this market.
Wound Debridement Industry Market Report: 2019-2033
This comprehensive report provides an in-depth analysis of the global wound debridement industry, offering invaluable insights for industry professionals, investors, and strategic decision-makers. With a study period spanning 2019-2033, a base year of 2025, and a forecast period of 2025-2033, this report delivers a detailed overview of market dynamics, competitive landscape, and future growth potential. The report covers a market valued at xx Million in 2025 and is projected to reach xx Million by 2033, exhibiting a robust CAGR of xx%.
Wound Debridement Industry Market Structure & Innovation Trends
The wound debridement market is characterized by a moderately concentrated structure, with key players such as Smith + Nephew, B Braun SE, PAUL HARTMANN AG, and Convatec Group PLC holding significant market share. However, the market also features numerous smaller companies specializing in niche products or technologies, driving innovation and competition.
Market share data for 2025 suggests Smith + Nephew holds approximately xx% market share, followed by B Braun SE with xx%, and PAUL HARTMANN AG with xx%. The remaining share is distributed amongst other players including Histologics LLC, Convatec Group PLC, Bioventus (Misonix Inc), Arobella Medical, RLS Global, PulseCare Medical, Medaxis, DeRoyal Industries Inc, and Lohmann & Rauscher.
Innovation within the industry is driven by advancements in surgical techniques, the development of novel enzymatic debriding agents, and the introduction of sophisticated mechanical devices. Regulatory frameworks, such as those established by the FDA, play a significant role in shaping product development and market access. The prevalence of chronic wounds, coupled with rising healthcare expenditures, further fuels market expansion. M&A activities within the wound care sector are increasingly frequent, with deal values in the range of xx Million – xx Million observed in recent years. These strategic partnerships accelerate product development and market penetration. Substitutes for wound debridement treatments are limited, largely due to the necessity of removing necrotic tissue to promote healing. The end-user demographics are primarily hospitals and outpatient clinics, with growth projected in the home healthcare setting.
Wound Debridement Industry Market Dynamics & Trends
The wound debridement market is experiencing significant growth, driven by factors such as the increasing prevalence of chronic wounds (diabetic ulcers, pressure ulcers), a growing aging population, and advancements in wound care technologies. The market is also influenced by the rising incidence of surgical and traumatic wounds, particularly in developing economies. Technological disruptions, including the introduction of advanced wound dressings and minimally invasive debridement techniques, are significantly impacting market growth. Consumer preferences are shifting towards less invasive, faster-healing methods with minimal pain and scarring. Competitive dynamics are characterized by both price competition and innovation-driven differentiation. The market exhibits strong growth potential, driven by increasing demand for effective wound management solutions across various healthcare settings.
Dominant Regions & Segments in Wound Debridement Industry
North America currently dominates the wound debridement market, driven by factors such as high healthcare expenditure, technological advancements, and high prevalence of chronic wounds. However, strong growth is anticipated in Asia-Pacific and Europe due to improved healthcare infrastructure and increasing awareness of advanced wound care methods.
- Leading Regions: North America, Europe, Asia-Pacific
- Key Drivers (North America): High healthcare expenditure, advanced healthcare infrastructure, high prevalence of chronic wounds.
- Key Drivers (Asia-Pacific): Rising healthcare expenditure, improving healthcare infrastructure, increasing prevalence of chronic wounds, growing awareness of advanced wound care.
- Key Drivers (Europe): High healthcare standards, well-developed healthcare systems, increasing prevalence of chronic wounds.
Dominant Segments:
- Method: Surgical debridement holds the largest market share, followed by enzymatic debridement. Mechanical and autolytic methods represent significant segments as well.
- Wound Type: Chronic ulcers represent the most significant segment, driven by the rising prevalence of conditions like diabetes and peripheral artery disease. Surgical and traumatic wounds also constitute a substantial market share.
- Product: Surgical devices currently hold a significant segment, with gels, ointments, and creams representing another major market category. Growth in advanced devices such as ultrasound debridement systems is anticipated.
Wound Debridement Industry Product Innovations
Recent innovations focus on improving efficacy, reducing pain, and simplifying the debridement process. This includes advancements in enzymatic debridement agents with improved specificity and effectiveness, minimally invasive surgical devices, and automated wound debridement systems. Smart wound dressings that monitor healing progress and facilitate personalized treatment are also emerging. These innovative products address unmet needs in the market, leading to greater patient comfort, faster healing times, and improved clinical outcomes.
Report Scope & Segmentation Analysis
This report segments the wound debridement market by method (Surgical, Enzymatic, Mechanical, Autolytic, Other), wound type (Chronic Ulcers, Surgical & Traumatic Wounds, Burns), and product (Gels, Ointments & Creams, Surgical Devices, Ultrasound Devices, Mechanical Debridement Pads, Other Wound Debridement Products). Each segment is analyzed based on market size, growth projections, and competitive dynamics. The report provides detailed insights into market trends and opportunities for each segment, forecasting market growth and competitive landscape throughout the forecast period.
Key Drivers of Wound Debridement Industry Growth
The wound debridement market is propelled by several key factors: the escalating prevalence of chronic wounds linked to aging populations and lifestyle diseases; technological advancements leading to innovative products and procedures; growing healthcare expenditure, especially in developing countries; and rising awareness among healthcare professionals and patients about advanced wound care techniques. Favorable regulatory environments supporting innovation and market entry also contribute to overall growth.
Challenges in the Wound Debridement Industry Sector
Significant challenges exist within the wound debridement sector, including stringent regulatory requirements for new product approvals, which prolongs the time-to-market and increases development costs. Furthermore, supply chain disruptions can impact product availability and increase costs. Intense competition among established players and new entrants creates pricing pressures and necessitates continuous innovation to maintain a competitive edge. The high cost of some debridement methods can limit accessibility for certain patient populations.
Emerging Opportunities in Wound Debridement Industry
Significant opportunities lie in developing innovative technologies, including advanced biomaterials and smart dressings for improved wound healing. Expanding into emerging markets with a growing need for effective wound management solutions also presents vast potential. Focusing on personalized medicine approaches tailoring treatments to individual patient needs and promoting preventive wound care strategies can further boost market growth. The increasing adoption of telehealth and remote patient monitoring opens new avenues for delivering wound care services.
Leading Players in the Wound Debridement Industry Market
- Histologics LLC
- Convatec Group PLC
- Bioventus (Misonix Inc)
- Arobella Medical
- RLS Global
- PulseCare Medical
- Medaxis
- DeRoyal Industries Inc
- PAUL HARTMANN AG
- Smith + Nephew
- B Braun SE
- Lohmann & Rauscher
Key Developments in Wound Debridement Industry Industry
- March 2023: SolasCure secured USD 13.3 Million in Series B funding to advance its Aurase Wound Gel and further Phase II clinical trials.
- February 2023: SERDA Therapeutics submitted an IND application to the FDA for its SN514 hydrogel, an enzymatic wound debriding agent.
Future Outlook for Wound Debridement Industry Market
The future of the wound debridement market looks promising, driven by continuous innovation, expansion into new markets, and rising demand for effective wound care solutions. Strategic partnerships, acquisitions, and the development of personalized treatment approaches will shape future market dynamics. The focus on improving patient outcomes and reducing healthcare costs will drive growth and shape the landscape of the wound debridement market in the coming years.
Wound Debridement Industry Segmentation
-
1. Product
- 1.1. Gels
- 1.2. Ointments & Creams
- 1.3. Surgical Devices
- 1.4. Ultrasound Devices
- 1.5. Mechanical Debridement Pads
- 1.6. Other Wound Debridement Products
-
2. Method
- 2.1. Surgical Method
- 2.2. Enzymatic Method
- 2.3. Mechanical Method
- 2.4. Autolytic Method
- 2.5. Other Methods
-
3. Wound Type
- 3.1. Chronic Ulcers
- 3.2. Surgical & Traumatic Wounds
- 3.3. Burns
Wound Debridement Industry Segmentation By Geography
-
1. North America
- 1.1. United States
- 1.2. Canada
- 1.3. Mexico
-
2. Europe
- 2.1. Germany
- 2.2. United Kingdom
- 2.3. France
- 2.4. Italy
- 2.5. Spain
- 2.6. Rest of Europe
-
3. Asia Pacific
- 3.1. China
- 3.2. Japan
- 3.3. India
- 3.4. Australia
- 3.5. South Korea
- 3.6. Rest of Asia Pacific
-
4. Middle East and Africa
- 4.1. GCC
- 4.2. South Africa
- 4.3. Rest of Middle East and Africa
-
5. South America
- 5.1. Brazil
- 5.2. Argentina
- 5.3. Rest of South America
Wound Debridement Industry REPORT HIGHLIGHTS
| Aspects | Details |
|---|---|
| Study Period | 2019-2033 |
| Base Year | 2024 |
| Estimated Year | 2025 |
| Forecast Period | 2025-2033 |
| Historical Period | 2019-2024 |
| Growth Rate | CAGR of 5.97% from 2019-2033 |
| Segmentation |
|
Table of Contents
- 1. Introduction
- 1.1. Research Scope
- 1.2. Market Segmentation
- 1.3. Research Methodology
- 1.4. Definitions and Assumptions
- 2. Executive Summary
- 2.1. Introduction
- 3. Market Dynamics
- 3.1. Introduction
- 3.2. Market Drivers
- 3.2.1. Rising Incidence of Diabetes and Associated Wounds; Increase in Volume of Surgical Procedures; Growing Geriatric Population
- 3.3. Market Restrains
- 3.3.1. High Treatment Cost
- 3.4. Market Trends
- 3.4.1. Gels in Product Segment is Expected to Have a Significant Share in the Market Over the Forecast Period
- 4. Market Factor Analysis
- 4.1. Porters Five Forces
- 4.2. Supply/Value Chain
- 4.3. PESTEL analysis
- 4.4. Market Entropy
- 4.5. Patent/Trademark Analysis
- 5. Global Wound Debridement Industry Analysis, Insights and Forecast, 2019-2031
- 5.1. Market Analysis, Insights and Forecast - by Product
- 5.1.1. Gels
- 5.1.2. Ointments & Creams
- 5.1.3. Surgical Devices
- 5.1.4. Ultrasound Devices
- 5.1.5. Mechanical Debridement Pads
- 5.1.6. Other Wound Debridement Products
- 5.2. Market Analysis, Insights and Forecast - by Method
- 5.2.1. Surgical Method
- 5.2.2. Enzymatic Method
- 5.2.3. Mechanical Method
- 5.2.4. Autolytic Method
- 5.2.5. Other Methods
- 5.3. Market Analysis, Insights and Forecast - by Wound Type
- 5.3.1. Chronic Ulcers
- 5.3.2. Surgical & Traumatic Wounds
- 5.3.3. Burns
- 5.4. Market Analysis, Insights and Forecast - by Region
- 5.4.1. North America
- 5.4.2. Europe
- 5.4.3. Asia Pacific
- 5.4.4. Middle East and Africa
- 5.4.5. South America
- 5.1. Market Analysis, Insights and Forecast - by Product
- 6. North America Wound Debridement Industry Analysis, Insights and Forecast, 2019-2031
- 6.1. Market Analysis, Insights and Forecast - by Product
- 6.1.1. Gels
- 6.1.2. Ointments & Creams
- 6.1.3. Surgical Devices
- 6.1.4. Ultrasound Devices
- 6.1.5. Mechanical Debridement Pads
- 6.1.6. Other Wound Debridement Products
- 6.2. Market Analysis, Insights and Forecast - by Method
- 6.2.1. Surgical Method
- 6.2.2. Enzymatic Method
- 6.2.3. Mechanical Method
- 6.2.4. Autolytic Method
- 6.2.5. Other Methods
- 6.3. Market Analysis, Insights and Forecast - by Wound Type
- 6.3.1. Chronic Ulcers
- 6.3.2. Surgical & Traumatic Wounds
- 6.3.3. Burns
- 6.1. Market Analysis, Insights and Forecast - by Product
- 7. Europe Wound Debridement Industry Analysis, Insights and Forecast, 2019-2031
- 7.1. Market Analysis, Insights and Forecast - by Product
- 7.1.1. Gels
- 7.1.2. Ointments & Creams
- 7.1.3. Surgical Devices
- 7.1.4. Ultrasound Devices
- 7.1.5. Mechanical Debridement Pads
- 7.1.6. Other Wound Debridement Products
- 7.2. Market Analysis, Insights and Forecast - by Method
- 7.2.1. Surgical Method
- 7.2.2. Enzymatic Method
- 7.2.3. Mechanical Method
- 7.2.4. Autolytic Method
- 7.2.5. Other Methods
- 7.3. Market Analysis, Insights and Forecast - by Wound Type
- 7.3.1. Chronic Ulcers
- 7.3.2. Surgical & Traumatic Wounds
- 7.3.3. Burns
- 7.1. Market Analysis, Insights and Forecast - by Product
- 8. Asia Pacific Wound Debridement Industry Analysis, Insights and Forecast, 2019-2031
- 8.1. Market Analysis, Insights and Forecast - by Product
- 8.1.1. Gels
- 8.1.2. Ointments & Creams
- 8.1.3. Surgical Devices
- 8.1.4. Ultrasound Devices
- 8.1.5. Mechanical Debridement Pads
- 8.1.6. Other Wound Debridement Products
- 8.2. Market Analysis, Insights and Forecast - by Method
- 8.2.1. Surgical Method
- 8.2.2. Enzymatic Method
- 8.2.3. Mechanical Method
- 8.2.4. Autolytic Method
- 8.2.5. Other Methods
- 8.3. Market Analysis, Insights and Forecast - by Wound Type
- 8.3.1. Chronic Ulcers
- 8.3.2. Surgical & Traumatic Wounds
- 8.3.3. Burns
- 8.1. Market Analysis, Insights and Forecast - by Product
- 9. Middle East and Africa Wound Debridement Industry Analysis, Insights and Forecast, 2019-2031
- 9.1. Market Analysis, Insights and Forecast - by Product
- 9.1.1. Gels
- 9.1.2. Ointments & Creams
- 9.1.3. Surgical Devices
- 9.1.4. Ultrasound Devices
- 9.1.5. Mechanical Debridement Pads
- 9.1.6. Other Wound Debridement Products
- 9.2. Market Analysis, Insights and Forecast - by Method
- 9.2.1. Surgical Method
- 9.2.2. Enzymatic Method
- 9.2.3. Mechanical Method
- 9.2.4. Autolytic Method
- 9.2.5. Other Methods
- 9.3. Market Analysis, Insights and Forecast - by Wound Type
- 9.3.1. Chronic Ulcers
- 9.3.2. Surgical & Traumatic Wounds
- 9.3.3. Burns
- 9.1. Market Analysis, Insights and Forecast - by Product
- 10. South America Wound Debridement Industry Analysis, Insights and Forecast, 2019-2031
- 10.1. Market Analysis, Insights and Forecast - by Product
- 10.1.1. Gels
- 10.1.2. Ointments & Creams
- 10.1.3. Surgical Devices
- 10.1.4. Ultrasound Devices
- 10.1.5. Mechanical Debridement Pads
- 10.1.6. Other Wound Debridement Products
- 10.2. Market Analysis, Insights and Forecast - by Method
- 10.2.1. Surgical Method
- 10.2.2. Enzymatic Method
- 10.2.3. Mechanical Method
- 10.2.4. Autolytic Method
- 10.2.5. Other Methods
- 10.3. Market Analysis, Insights and Forecast - by Wound Type
- 10.3.1. Chronic Ulcers
- 10.3.2. Surgical & Traumatic Wounds
- 10.3.3. Burns
- 10.1. Market Analysis, Insights and Forecast - by Product
- 11. North America Wound Debridement Industry Analysis, Insights and Forecast, 2019-2031
- 11.1. Market Analysis, Insights and Forecast - By Country/Sub-region
- 11.1.1. undefined
- 12. Europe Wound Debridement Industry Analysis, Insights and Forecast, 2019-2031
- 12.1. Market Analysis, Insights and Forecast - By Country/Sub-region
- 12.1.1. undefined
- 13. Asia Pacific Wound Debridement Industry Analysis, Insights and Forecast, 2019-2031
- 13.1. Market Analysis, Insights and Forecast - By Country/Sub-region
- 13.1.1. undefined
- 14. Middle East and Africa Wound Debridement Industry Analysis, Insights and Forecast, 2019-2031
- 14.1. Market Analysis, Insights and Forecast - By Country/Sub-region
- 14.1.1. undefined
- 15. South America Wound Debridement Industry Analysis, Insights and Forecast, 2019-2031
- 15.1. Market Analysis, Insights and Forecast - By Country/Sub-region
- 15.1.1. undefined
- 16. Competitive Analysis
- 16.1. Global Market Share Analysis 2024
- 16.2. Company Profiles
- 16.2.1 Histologics LLC
- 16.2.1.1. Overview
- 16.2.1.2. Products
- 16.2.1.3. SWOT Analysis
- 16.2.1.4. Recent Developments
- 16.2.1.5. Financials (Based on Availability)
- 16.2.2 Convatec Group PLC
- 16.2.2.1. Overview
- 16.2.2.2. Products
- 16.2.2.3. SWOT Analysis
- 16.2.2.4. Recent Developments
- 16.2.2.5. Financials (Based on Availability)
- 16.2.3 Bioventus (Misonix Inc )
- 16.2.3.1. Overview
- 16.2.3.2. Products
- 16.2.3.3. SWOT Analysis
- 16.2.3.4. Recent Developments
- 16.2.3.5. Financials (Based on Availability)
- 16.2.4 Arobella Medical
- 16.2.4.1. Overview
- 16.2.4.2. Products
- 16.2.4.3. SWOT Analysis
- 16.2.4.4. Recent Developments
- 16.2.4.5. Financials (Based on Availability)
- 16.2.5 RLS Global
- 16.2.5.1. Overview
- 16.2.5.2. Products
- 16.2.5.3. SWOT Analysis
- 16.2.5.4. Recent Developments
- 16.2.5.5. Financials (Based on Availability)
- 16.2.6 PulseCare Medical
- 16.2.6.1. Overview
- 16.2.6.2. Products
- 16.2.6.3. SWOT Analysis
- 16.2.6.4. Recent Developments
- 16.2.6.5. Financials (Based on Availability)
- 16.2.7 Medaxis
- 16.2.7.1. Overview
- 16.2.7.2. Products
- 16.2.7.3. SWOT Analysis
- 16.2.7.4. Recent Developments
- 16.2.7.5. Financials (Based on Availability)
- 16.2.8 DeRoyal Industries Inc
- 16.2.8.1. Overview
- 16.2.8.2. Products
- 16.2.8.3. SWOT Analysis
- 16.2.8.4. Recent Developments
- 16.2.8.5. Financials (Based on Availability)
- 16.2.9 PAUL HARTMANN AG
- 16.2.9.1. Overview
- 16.2.9.2. Products
- 16.2.9.3. SWOT Analysis
- 16.2.9.4. Recent Developments
- 16.2.9.5. Financials (Based on Availability)
- 16.2.10 Smith + Nephew
- 16.2.10.1. Overview
- 16.2.10.2. Products
- 16.2.10.3. SWOT Analysis
- 16.2.10.4. Recent Developments
- 16.2.10.5. Financials (Based on Availability)
- 16.2.11 B Braun SE
- 16.2.11.1. Overview
- 16.2.11.2. Products
- 16.2.11.3. SWOT Analysis
- 16.2.11.4. Recent Developments
- 16.2.11.5. Financials (Based on Availability)
- 16.2.12 Lohmann & Rauscher
- 16.2.12.1. Overview
- 16.2.12.2. Products
- 16.2.12.3. SWOT Analysis
- 16.2.12.4. Recent Developments
- 16.2.12.5. Financials (Based on Availability)
- 16.2.1 Histologics LLC
List of Figures
- Figure 1: Global Wound Debridement Industry Revenue Breakdown (Million, %) by Region 2024 & 2032
- Figure 2: Global Wound Debridement Industry Volume Breakdown (K Unit, %) by Region 2024 & 2032
- Figure 3: North America Wound Debridement Industry Revenue (Million), by Country 2024 & 2032
- Figure 4: North America Wound Debridement Industry Volume (K Unit), by Country 2024 & 2032
- Figure 5: North America Wound Debridement Industry Revenue Share (%), by Country 2024 & 2032
- Figure 6: North America Wound Debridement Industry Volume Share (%), by Country 2024 & 2032
- Figure 7: Europe Wound Debridement Industry Revenue (Million), by Country 2024 & 2032
- Figure 8: Europe Wound Debridement Industry Volume (K Unit), by Country 2024 & 2032
- Figure 9: Europe Wound Debridement Industry Revenue Share (%), by Country 2024 & 2032
- Figure 10: Europe Wound Debridement Industry Volume Share (%), by Country 2024 & 2032
- Figure 11: Asia Pacific Wound Debridement Industry Revenue (Million), by Country 2024 & 2032
- Figure 12: Asia Pacific Wound Debridement Industry Volume (K Unit), by Country 2024 & 2032
- Figure 13: Asia Pacific Wound Debridement Industry Revenue Share (%), by Country 2024 & 2032
- Figure 14: Asia Pacific Wound Debridement Industry Volume Share (%), by Country 2024 & 2032
- Figure 15: Middle East and Africa Wound Debridement Industry Revenue (Million), by Country 2024 & 2032
- Figure 16: Middle East and Africa Wound Debridement Industry Volume (K Unit), by Country 2024 & 2032
- Figure 17: Middle East and Africa Wound Debridement Industry Revenue Share (%), by Country 2024 & 2032
- Figure 18: Middle East and Africa Wound Debridement Industry Volume Share (%), by Country 2024 & 2032
- Figure 19: South America Wound Debridement Industry Revenue (Million), by Country 2024 & 2032
- Figure 20: South America Wound Debridement Industry Volume (K Unit), by Country 2024 & 2032
- Figure 21: South America Wound Debridement Industry Revenue Share (%), by Country 2024 & 2032
- Figure 22: South America Wound Debridement Industry Volume Share (%), by Country 2024 & 2032
- Figure 23: North America Wound Debridement Industry Revenue (Million), by Product 2024 & 2032
- Figure 24: North America Wound Debridement Industry Volume (K Unit), by Product 2024 & 2032
- Figure 25: North America Wound Debridement Industry Revenue Share (%), by Product 2024 & 2032
- Figure 26: North America Wound Debridement Industry Volume Share (%), by Product 2024 & 2032
- Figure 27: North America Wound Debridement Industry Revenue (Million), by Method 2024 & 2032
- Figure 28: North America Wound Debridement Industry Volume (K Unit), by Method 2024 & 2032
- Figure 29: North America Wound Debridement Industry Revenue Share (%), by Method 2024 & 2032
- Figure 30: North America Wound Debridement Industry Volume Share (%), by Method 2024 & 2032
- Figure 31: North America Wound Debridement Industry Revenue (Million), by Wound Type 2024 & 2032
- Figure 32: North America Wound Debridement Industry Volume (K Unit), by Wound Type 2024 & 2032
- Figure 33: North America Wound Debridement Industry Revenue Share (%), by Wound Type 2024 & 2032
- Figure 34: North America Wound Debridement Industry Volume Share (%), by Wound Type 2024 & 2032
- Figure 35: North America Wound Debridement Industry Revenue (Million), by Country 2024 & 2032
- Figure 36: North America Wound Debridement Industry Volume (K Unit), by Country 2024 & 2032
- Figure 37: North America Wound Debridement Industry Revenue Share (%), by Country 2024 & 2032
- Figure 38: North America Wound Debridement Industry Volume Share (%), by Country 2024 & 2032
- Figure 39: Europe Wound Debridement Industry Revenue (Million), by Product 2024 & 2032
- Figure 40: Europe Wound Debridement Industry Volume (K Unit), by Product 2024 & 2032
- Figure 41: Europe Wound Debridement Industry Revenue Share (%), by Product 2024 & 2032
- Figure 42: Europe Wound Debridement Industry Volume Share (%), by Product 2024 & 2032
- Figure 43: Europe Wound Debridement Industry Revenue (Million), by Method 2024 & 2032
- Figure 44: Europe Wound Debridement Industry Volume (K Unit), by Method 2024 & 2032
- Figure 45: Europe Wound Debridement Industry Revenue Share (%), by Method 2024 & 2032
- Figure 46: Europe Wound Debridement Industry Volume Share (%), by Method 2024 & 2032
- Figure 47: Europe Wound Debridement Industry Revenue (Million), by Wound Type 2024 & 2032
- Figure 48: Europe Wound Debridement Industry Volume (K Unit), by Wound Type 2024 & 2032
- Figure 49: Europe Wound Debridement Industry Revenue Share (%), by Wound Type 2024 & 2032
- Figure 50: Europe Wound Debridement Industry Volume Share (%), by Wound Type 2024 & 2032
- Figure 51: Europe Wound Debridement Industry Revenue (Million), by Country 2024 & 2032
- Figure 52: Europe Wound Debridement Industry Volume (K Unit), by Country 2024 & 2032
- Figure 53: Europe Wound Debridement Industry Revenue Share (%), by Country 2024 & 2032
- Figure 54: Europe Wound Debridement Industry Volume Share (%), by Country 2024 & 2032
- Figure 55: Asia Pacific Wound Debridement Industry Revenue (Million), by Product 2024 & 2032
- Figure 56: Asia Pacific Wound Debridement Industry Volume (K Unit), by Product 2024 & 2032
- Figure 57: Asia Pacific Wound Debridement Industry Revenue Share (%), by Product 2024 & 2032
- Figure 58: Asia Pacific Wound Debridement Industry Volume Share (%), by Product 2024 & 2032
- Figure 59: Asia Pacific Wound Debridement Industry Revenue (Million), by Method 2024 & 2032
- Figure 60: Asia Pacific Wound Debridement Industry Volume (K Unit), by Method 2024 & 2032
- Figure 61: Asia Pacific Wound Debridement Industry Revenue Share (%), by Method 2024 & 2032
- Figure 62: Asia Pacific Wound Debridement Industry Volume Share (%), by Method 2024 & 2032
- Figure 63: Asia Pacific Wound Debridement Industry Revenue (Million), by Wound Type 2024 & 2032
- Figure 64: Asia Pacific Wound Debridement Industry Volume (K Unit), by Wound Type 2024 & 2032
- Figure 65: Asia Pacific Wound Debridement Industry Revenue Share (%), by Wound Type 2024 & 2032
- Figure 66: Asia Pacific Wound Debridement Industry Volume Share (%), by Wound Type 2024 & 2032
- Figure 67: Asia Pacific Wound Debridement Industry Revenue (Million), by Country 2024 & 2032
- Figure 68: Asia Pacific Wound Debridement Industry Volume (K Unit), by Country 2024 & 2032
- Figure 69: Asia Pacific Wound Debridement Industry Revenue Share (%), by Country 2024 & 2032
- Figure 70: Asia Pacific Wound Debridement Industry Volume Share (%), by Country 2024 & 2032
- Figure 71: Middle East and Africa Wound Debridement Industry Revenue (Million), by Product 2024 & 2032
- Figure 72: Middle East and Africa Wound Debridement Industry Volume (K Unit), by Product 2024 & 2032
- Figure 73: Middle East and Africa Wound Debridement Industry Revenue Share (%), by Product 2024 & 2032
- Figure 74: Middle East and Africa Wound Debridement Industry Volume Share (%), by Product 2024 & 2032
- Figure 75: Middle East and Africa Wound Debridement Industry Revenue (Million), by Method 2024 & 2032
- Figure 76: Middle East and Africa Wound Debridement Industry Volume (K Unit), by Method 2024 & 2032
- Figure 77: Middle East and Africa Wound Debridement Industry Revenue Share (%), by Method 2024 & 2032
- Figure 78: Middle East and Africa Wound Debridement Industry Volume Share (%), by Method 2024 & 2032
- Figure 79: Middle East and Africa Wound Debridement Industry Revenue (Million), by Wound Type 2024 & 2032
- Figure 80: Middle East and Africa Wound Debridement Industry Volume (K Unit), by Wound Type 2024 & 2032
- Figure 81: Middle East and Africa Wound Debridement Industry Revenue Share (%), by Wound Type 2024 & 2032
- Figure 82: Middle East and Africa Wound Debridement Industry Volume Share (%), by Wound Type 2024 & 2032
- Figure 83: Middle East and Africa Wound Debridement Industry Revenue (Million), by Country 2024 & 2032
- Figure 84: Middle East and Africa Wound Debridement Industry Volume (K Unit), by Country 2024 & 2032
- Figure 85: Middle East and Africa Wound Debridement Industry Revenue Share (%), by Country 2024 & 2032
- Figure 86: Middle East and Africa Wound Debridement Industry Volume Share (%), by Country 2024 & 2032
- Figure 87: South America Wound Debridement Industry Revenue (Million), by Product 2024 & 2032
- Figure 88: South America Wound Debridement Industry Volume (K Unit), by Product 2024 & 2032
- Figure 89: South America Wound Debridement Industry Revenue Share (%), by Product 2024 & 2032
- Figure 90: South America Wound Debridement Industry Volume Share (%), by Product 2024 & 2032
- Figure 91: South America Wound Debridement Industry Revenue (Million), by Method 2024 & 2032
- Figure 92: South America Wound Debridement Industry Volume (K Unit), by Method 2024 & 2032
- Figure 93: South America Wound Debridement Industry Revenue Share (%), by Method 2024 & 2032
- Figure 94: South America Wound Debridement Industry Volume Share (%), by Method 2024 & 2032
- Figure 95: South America Wound Debridement Industry Revenue (Million), by Wound Type 2024 & 2032
- Figure 96: South America Wound Debridement Industry Volume (K Unit), by Wound Type 2024 & 2032
- Figure 97: South America Wound Debridement Industry Revenue Share (%), by Wound Type 2024 & 2032
- Figure 98: South America Wound Debridement Industry Volume Share (%), by Wound Type 2024 & 2032
- Figure 99: South America Wound Debridement Industry Revenue (Million), by Country 2024 & 2032
- Figure 100: South America Wound Debridement Industry Volume (K Unit), by Country 2024 & 2032
- Figure 101: South America Wound Debridement Industry Revenue Share (%), by Country 2024 & 2032
- Figure 102: South America Wound Debridement Industry Volume Share (%), by Country 2024 & 2032
List of Tables
- Table 1: Global Wound Debridement Industry Revenue Million Forecast, by Region 2019 & 2032
- Table 2: Global Wound Debridement Industry Volume K Unit Forecast, by Region 2019 & 2032
- Table 3: Global Wound Debridement Industry Revenue Million Forecast, by Product 2019 & 2032
- Table 4: Global Wound Debridement Industry Volume K Unit Forecast, by Product 2019 & 2032
- Table 5: Global Wound Debridement Industry Revenue Million Forecast, by Method 2019 & 2032
- Table 6: Global Wound Debridement Industry Volume K Unit Forecast, by Method 2019 & 2032
- Table 7: Global Wound Debridement Industry Revenue Million Forecast, by Wound Type 2019 & 2032
- Table 8: Global Wound Debridement Industry Volume K Unit Forecast, by Wound Type 2019 & 2032
- Table 9: Global Wound Debridement Industry Revenue Million Forecast, by Region 2019 & 2032
- Table 10: Global Wound Debridement Industry Volume K Unit Forecast, by Region 2019 & 2032
- Table 11: Global Wound Debridement Industry Revenue Million Forecast, by Country 2019 & 2032
- Table 12: Global Wound Debridement Industry Volume K Unit Forecast, by Country 2019 & 2032
- Table 13: Global Wound Debridement Industry Revenue Million Forecast, by Country 2019 & 2032
- Table 14: Global Wound Debridement Industry Volume K Unit Forecast, by Country 2019 & 2032
- Table 15: Global Wound Debridement Industry Revenue Million Forecast, by Country 2019 & 2032
- Table 16: Global Wound Debridement Industry Volume K Unit Forecast, by Country 2019 & 2032
- Table 17: Global Wound Debridement Industry Revenue Million Forecast, by Country 2019 & 2032
- Table 18: Global Wound Debridement Industry Volume K Unit Forecast, by Country 2019 & 2032
- Table 19: Global Wound Debridement Industry Revenue Million Forecast, by Country 2019 & 2032
- Table 20: Global Wound Debridement Industry Volume K Unit Forecast, by Country 2019 & 2032
- Table 21: Global Wound Debridement Industry Revenue Million Forecast, by Product 2019 & 2032
- Table 22: Global Wound Debridement Industry Volume K Unit Forecast, by Product 2019 & 2032
- Table 23: Global Wound Debridement Industry Revenue Million Forecast, by Method 2019 & 2032
- Table 24: Global Wound Debridement Industry Volume K Unit Forecast, by Method 2019 & 2032
- Table 25: Global Wound Debridement Industry Revenue Million Forecast, by Wound Type 2019 & 2032
- Table 26: Global Wound Debridement Industry Volume K Unit Forecast, by Wound Type 2019 & 2032
- Table 27: Global Wound Debridement Industry Revenue Million Forecast, by Country 2019 & 2032
- Table 28: Global Wound Debridement Industry Volume K Unit Forecast, by Country 2019 & 2032
- Table 29: United States Wound Debridement Industry Revenue (Million) Forecast, by Application 2019 & 2032
- Table 30: United States Wound Debridement Industry Volume (K Unit) Forecast, by Application 2019 & 2032
- Table 31: Canada Wound Debridement Industry Revenue (Million) Forecast, by Application 2019 & 2032
- Table 32: Canada Wound Debridement Industry Volume (K Unit) Forecast, by Application 2019 & 2032
- Table 33: Mexico Wound Debridement Industry Revenue (Million) Forecast, by Application 2019 & 2032
- Table 34: Mexico Wound Debridement Industry Volume (K Unit) Forecast, by Application 2019 & 2032
- Table 35: Global Wound Debridement Industry Revenue Million Forecast, by Product 2019 & 2032
- Table 36: Global Wound Debridement Industry Volume K Unit Forecast, by Product 2019 & 2032
- Table 37: Global Wound Debridement Industry Revenue Million Forecast, by Method 2019 & 2032
- Table 38: Global Wound Debridement Industry Volume K Unit Forecast, by Method 2019 & 2032
- Table 39: Global Wound Debridement Industry Revenue Million Forecast, by Wound Type 2019 & 2032
- Table 40: Global Wound Debridement Industry Volume K Unit Forecast, by Wound Type 2019 & 2032
- Table 41: Global Wound Debridement Industry Revenue Million Forecast, by Country 2019 & 2032
- Table 42: Global Wound Debridement Industry Volume K Unit Forecast, by Country 2019 & 2032
- Table 43: Germany Wound Debridement Industry Revenue (Million) Forecast, by Application 2019 & 2032
- Table 44: Germany Wound Debridement Industry Volume (K Unit) Forecast, by Application 2019 & 2032
- Table 45: United Kingdom Wound Debridement Industry Revenue (Million) Forecast, by Application 2019 & 2032
- Table 46: United Kingdom Wound Debridement Industry Volume (K Unit) Forecast, by Application 2019 & 2032
- Table 47: France Wound Debridement Industry Revenue (Million) Forecast, by Application 2019 & 2032
- Table 48: France Wound Debridement Industry Volume (K Unit) Forecast, by Application 2019 & 2032
- Table 49: Italy Wound Debridement Industry Revenue (Million) Forecast, by Application 2019 & 2032
- Table 50: Italy Wound Debridement Industry Volume (K Unit) Forecast, by Application 2019 & 2032
- Table 51: Spain Wound Debridement Industry Revenue (Million) Forecast, by Application 2019 & 2032
- Table 52: Spain Wound Debridement Industry Volume (K Unit) Forecast, by Application 2019 & 2032
- Table 53: Rest of Europe Wound Debridement Industry Revenue (Million) Forecast, by Application 2019 & 2032
- Table 54: Rest of Europe Wound Debridement Industry Volume (K Unit) Forecast, by Application 2019 & 2032
- Table 55: Global Wound Debridement Industry Revenue Million Forecast, by Product 2019 & 2032
- Table 56: Global Wound Debridement Industry Volume K Unit Forecast, by Product 2019 & 2032
- Table 57: Global Wound Debridement Industry Revenue Million Forecast, by Method 2019 & 2032
- Table 58: Global Wound Debridement Industry Volume K Unit Forecast, by Method 2019 & 2032
- Table 59: Global Wound Debridement Industry Revenue Million Forecast, by Wound Type 2019 & 2032
- Table 60: Global Wound Debridement Industry Volume K Unit Forecast, by Wound Type 2019 & 2032
- Table 61: Global Wound Debridement Industry Revenue Million Forecast, by Country 2019 & 2032
- Table 62: Global Wound Debridement Industry Volume K Unit Forecast, by Country 2019 & 2032
- Table 63: China Wound Debridement Industry Revenue (Million) Forecast, by Application 2019 & 2032
- Table 64: China Wound Debridement Industry Volume (K Unit) Forecast, by Application 2019 & 2032
- Table 65: Japan Wound Debridement Industry Revenue (Million) Forecast, by Application 2019 & 2032
- Table 66: Japan Wound Debridement Industry Volume (K Unit) Forecast, by Application 2019 & 2032
- Table 67: India Wound Debridement Industry Revenue (Million) Forecast, by Application 2019 & 2032
- Table 68: India Wound Debridement Industry Volume (K Unit) Forecast, by Application 2019 & 2032
- Table 69: Australia Wound Debridement Industry Revenue (Million) Forecast, by Application 2019 & 2032
- Table 70: Australia Wound Debridement Industry Volume (K Unit) Forecast, by Application 2019 & 2032
- Table 71: South Korea Wound Debridement Industry Revenue (Million) Forecast, by Application 2019 & 2032
- Table 72: South Korea Wound Debridement Industry Volume (K Unit) Forecast, by Application 2019 & 2032
- Table 73: Rest of Asia Pacific Wound Debridement Industry Revenue (Million) Forecast, by Application 2019 & 2032
- Table 74: Rest of Asia Pacific Wound Debridement Industry Volume (K Unit) Forecast, by Application 2019 & 2032
- Table 75: Global Wound Debridement Industry Revenue Million Forecast, by Product 2019 & 2032
- Table 76: Global Wound Debridement Industry Volume K Unit Forecast, by Product 2019 & 2032
- Table 77: Global Wound Debridement Industry Revenue Million Forecast, by Method 2019 & 2032
- Table 78: Global Wound Debridement Industry Volume K Unit Forecast, by Method 2019 & 2032
- Table 79: Global Wound Debridement Industry Revenue Million Forecast, by Wound Type 2019 & 2032
- Table 80: Global Wound Debridement Industry Volume K Unit Forecast, by Wound Type 2019 & 2032
- Table 81: Global Wound Debridement Industry Revenue Million Forecast, by Country 2019 & 2032
- Table 82: Global Wound Debridement Industry Volume K Unit Forecast, by Country 2019 & 2032
- Table 83: GCC Wound Debridement Industry Revenue (Million) Forecast, by Application 2019 & 2032
- Table 84: GCC Wound Debridement Industry Volume (K Unit) Forecast, by Application 2019 & 2032
- Table 85: South Africa Wound Debridement Industry Revenue (Million) Forecast, by Application 2019 & 2032
- Table 86: South Africa Wound Debridement Industry Volume (K Unit) Forecast, by Application 2019 & 2032
- Table 87: Rest of Middle East and Africa Wound Debridement Industry Revenue (Million) Forecast, by Application 2019 & 2032
- Table 88: Rest of Middle East and Africa Wound Debridement Industry Volume (K Unit) Forecast, by Application 2019 & 2032
- Table 89: Global Wound Debridement Industry Revenue Million Forecast, by Product 2019 & 2032
- Table 90: Global Wound Debridement Industry Volume K Unit Forecast, by Product 2019 & 2032
- Table 91: Global Wound Debridement Industry Revenue Million Forecast, by Method 2019 & 2032
- Table 92: Global Wound Debridement Industry Volume K Unit Forecast, by Method 2019 & 2032
- Table 93: Global Wound Debridement Industry Revenue Million Forecast, by Wound Type 2019 & 2032
- Table 94: Global Wound Debridement Industry Volume K Unit Forecast, by Wound Type 2019 & 2032
- Table 95: Global Wound Debridement Industry Revenue Million Forecast, by Country 2019 & 2032
- Table 96: Global Wound Debridement Industry Volume K Unit Forecast, by Country 2019 & 2032
- Table 97: Brazil Wound Debridement Industry Revenue (Million) Forecast, by Application 2019 & 2032
- Table 98: Brazil Wound Debridement Industry Volume (K Unit) Forecast, by Application 2019 & 2032
- Table 99: Argentina Wound Debridement Industry Revenue (Million) Forecast, by Application 2019 & 2032
- Table 100: Argentina Wound Debridement Industry Volume (K Unit) Forecast, by Application 2019 & 2032
- Table 101: Rest of South America Wound Debridement Industry Revenue (Million) Forecast, by Application 2019 & 2032
- Table 102: Rest of South America Wound Debridement Industry Volume (K Unit) Forecast, by Application 2019 & 2032
Frequently Asked Questions
1. What is the projected Compound Annual Growth Rate (CAGR) of the Wound Debridement Industry?
The projected CAGR is approximately 5.97%.
2. Which companies are prominent players in the Wound Debridement Industry?
Key companies in the market include Histologics LLC, Convatec Group PLC, Bioventus (Misonix Inc ), Arobella Medical, RLS Global, PulseCare Medical, Medaxis, DeRoyal Industries Inc, PAUL HARTMANN AG, Smith + Nephew, B Braun SE, Lohmann & Rauscher.
3. What are the main segments of the Wound Debridement Industry?
The market segments include Product, Method, Wound Type.
4. Can you provide details about the market size?
The market size is estimated to be USD 4.95 Million as of 2022.
5. What are some drivers contributing to market growth?
Rising Incidence of Diabetes and Associated Wounds; Increase in Volume of Surgical Procedures; Growing Geriatric Population.
6. What are the notable trends driving market growth?
Gels in Product Segment is Expected to Have a Significant Share in the Market Over the Forecast Period.
7. Are there any restraints impacting market growth?
High Treatment Cost.
8. Can you provide examples of recent developments in the market?
March 2023: SolasCure announced the final closing of a GBP 10.9 million (USD 13.3 million) Series B fund to advance wound care innovation. The funding will support the development of Aurase Wound Gel and progress toward further Phase II clinical trials of innovative wound debriding enzymes.
9. What pricing options are available for accessing the report?
Pricing options include single-user, multi-user, and enterprise licenses priced at USD 4750, USD 5250, and USD 8750 respectively.
10. Is the market size provided in terms of value or volume?
The market size is provided in terms of value, measured in Million and volume, measured in K Unit.
11. Are there any specific market keywords associated with the report?
Yes, the market keyword associated with the report is "Wound Debridement Industry," which aids in identifying and referencing the specific market segment covered.
12. How do I determine which pricing option suits my needs best?
The pricing options vary based on user requirements and access needs. Individual users may opt for single-user licenses, while businesses requiring broader access may choose multi-user or enterprise licenses for cost-effective access to the report.
13. Are there any additional resources or data provided in the Wound Debridement Industry report?
While the report offers comprehensive insights, it's advisable to review the specific contents or supplementary materials provided to ascertain if additional resources or data are available.
14. How can I stay updated on further developments or reports in the Wound Debridement Industry?
To stay informed about further developments, trends, and reports in the Wound Debridement Industry, consider subscribing to industry newsletters, following relevant companies and organizations, or regularly checking reputable industry news sources and publications.
Methodology
Step 1 - Identification of Relevant Samples Size from Population Database


Step 2 - Approaches for Defining Global Market Size (Value, Volume* & Price*)

Note*: In applicable scenarios
Step 3 - Data Sources
Primary Research
- Web Analytics
- Survey Reports
- Research Institute
- Latest Research Reports
- Opinion Leaders
Secondary Research
- Annual Reports
- White Paper
- Latest Press Release
- Industry Association
- Paid Database
- Investor Presentations

Step 4 - Data Triangulation
Involves using different sources of information in order to increase the validity of a study
These sources are likely to be stakeholders in a program - participants, other researchers, program staff, other community members, and so on.
Then we put all data in single framework & apply various statistical tools to find out the dynamic on the market.
During the analysis stage, feedback from the stakeholder groups would be compared to determine areas of agreement as well as areas of divergence


