
Key Insights
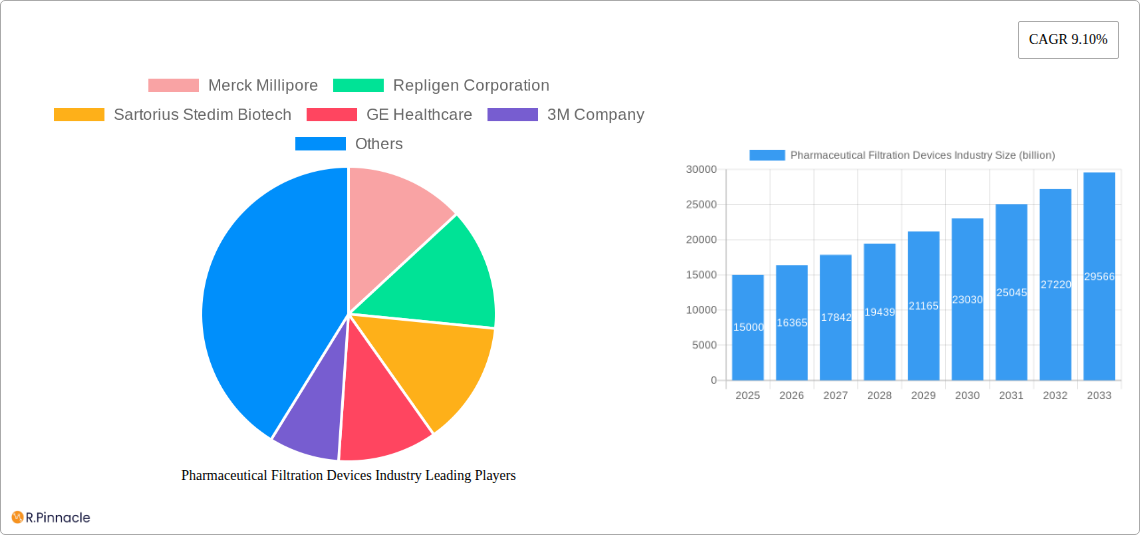
The global pharmaceutical filtration devices market is experiencing robust growth, driven by the increasing demand for sterile injectable drugs, biologics, and advanced therapies. The market's expansion is fueled by several key factors: the rising prevalence of chronic diseases necessitating increased medication use, stringent regulatory requirements mandating high-quality pharmaceutical products, and continuous advancements in filtration technologies leading to improved efficiency and efficacy. The market size, currently estimated at $XX billion in 2025, is projected to witness a compound annual growth rate (CAGR) of 9.10% from 2025 to 2033. This growth is further propelled by the development of novel filtration techniques such as nanofiltration, offering superior purification capabilities for complex pharmaceutical formulations. Segmentation analysis reveals strong growth across various applications, including final product processing, which benefits from the increasing demand for high-purity injectables, and cell separation, vital in biopharmaceutical manufacturing. Polyethersulfone (PES) and Polyvinylidene Difluoride (PVDF) membrane filters are leading material segments due to their superior chemical resistance and biocompatibility. Geographically, North America and Europe currently hold significant market share, driven by established pharmaceutical industries and strong regulatory frameworks. However, the Asia-Pacific region is anticipated to show significant growth in the coming years due to expanding pharmaceutical manufacturing capabilities and increasing investments in healthcare infrastructure within countries like China and India.
Market restraints include the high initial investment costs associated with advanced filtration systems and the potential challenges related to membrane fouling and cleaning. However, these challenges are being addressed through ongoing technological advancements and the development of more efficient and durable filtration devices. Major players like Merck Millipore, Sartorius Stedim Biotech, and Danaher Corporation are investing heavily in R&D to develop innovative filtration solutions, further driving market expansion and competition. The strategic mergers and acquisitions within the industry also contribute to the market's dynamic landscape. The forecast period (2025-2033) promises continued growth, propelled by the factors mentioned above and potentially augmented by increasing adoption in emerging markets and the development of personalized medicines. This consistent growth outlook makes the pharmaceutical filtration devices market an attractive investment opportunity.
Pharmaceutical Filtration Devices Industry: A Comprehensive Market Report (2019-2033)
This in-depth report provides a comprehensive analysis of the global pharmaceutical filtration devices market, projecting a market size exceeding $XX billion by 2033. The study covers the period from 2019 to 2033, with 2025 serving as the base and estimated year. It offers invaluable insights for industry professionals, investors, and strategic decision-makers seeking to navigate this dynamic market. The report leverages extensive data analysis and expert insights to forecast future trends and identify lucrative opportunities within the $XX billion pharmaceutical filtration devices market.
Pharmaceutical Filtration Devices Industry Market Structure & Innovation Trends
The pharmaceutical filtration devices market exhibits a moderately concentrated structure, with key players like Merck Millipore, Sartorius Stedim Biotech, and Danaher Corporation holding significant market share. The combined market share of the top five players is estimated at approximately XX%. Innovation is driven by stringent regulatory requirements, the need for enhanced product purity, and the rising demand for advanced filtration techniques in biologics manufacturing. The market witnessed several significant M&A activities in the historical period (2019-2024), with deal values exceeding $XX billion, mostly driven by the consolidation of smaller players and the acquisition of specialized technologies. Regulatory frameworks, such as those set by the FDA and EMA, significantly influence product development and adoption. Product substitutes are limited due to the stringent quality and regulatory requirements, though new materials and techniques continuously emerge. The end-user demographic comprises pharmaceutical companies across various stages of the value chain, from raw material suppliers to final product manufacturers.
- Market Concentration: Top 5 players hold XX% market share.
- M&A Activity (2019-2024): Total deal value exceeding $XX billion.
- Innovation Drivers: Stringent regulations, enhanced purity requirements, and demand for advanced techniques.
Pharmaceutical Filtration Devices Industry Market Dynamics & Trends
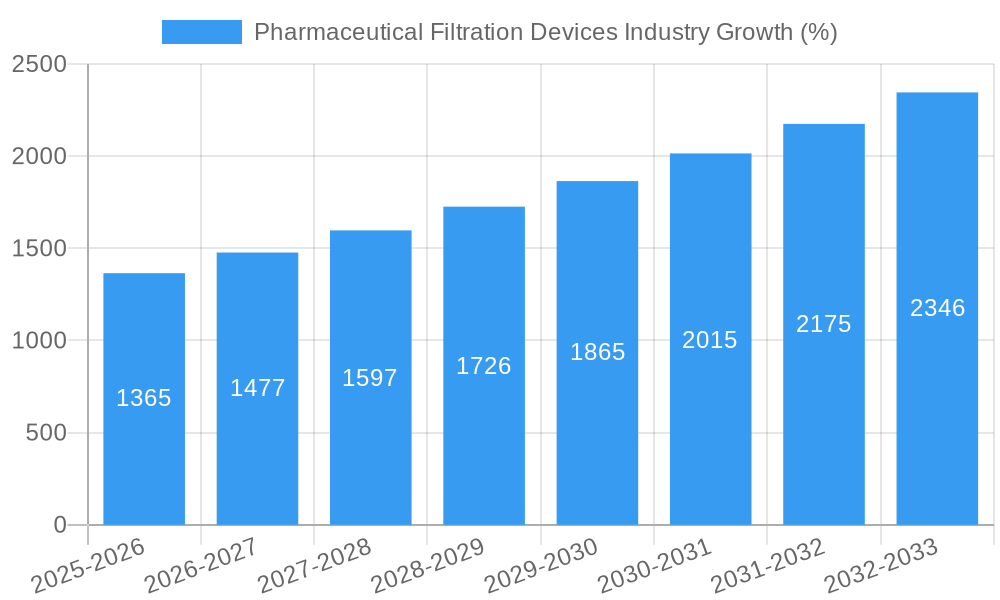
The global pharmaceutical filtration devices market is experiencing robust growth, driven by factors such as the increasing prevalence of chronic diseases, rising demand for biopharmaceuticals, and technological advancements leading to improved filtration efficiency and reduced processing times. The market is projected to exhibit a CAGR of XX% during the forecast period (2025-2033), exceeding $XX billion by 2033. Technological disruptions, particularly in the areas of membrane technology and automation, are reshaping the competitive landscape. Consumer preferences are shifting towards more efficient, cost-effective, and sustainable solutions. Competitive dynamics are intense, characterized by product differentiation, technological advancements, and strategic partnerships. Market penetration of advanced filtration technologies, such as single-use systems, is steadily increasing, driven by the advantages of reduced cleaning validation and enhanced sterility assurance.
Dominant Regions & Segments in Pharmaceutical Filtration Devices Industry
North America currently dominates the pharmaceutical filtration devices market, driven by robust pharmaceutical R&D spending, stringent regulatory standards, and the presence of major market players. Europe and Asia Pacific are also witnessing significant growth, fueled by expanding healthcare infrastructure and increasing investments in biopharmaceutical manufacturing.
- Leading Region: North America
- Key Drivers (North America): High R&D spending, stringent regulations, strong presence of major players.
- Key Drivers (Europe & Asia Pacific): Expanding healthcare infrastructure and biopharmaceutical investments.
Within segments, Final Product Processing constitutes the largest application segment, followed by Raw Material Filtration. In terms of materials, Polyethersulfone (PES) and Mixed Cellulose Ester & Cellulose Acetate (MCE & CA) hold significant market share due to their versatility and biocompatibility. Ultrafiltration is the dominant filtration technique, owing to its effectiveness in removing larger molecules and particles. The market is segmented based on application, material, and technique, with growth projections varying across segments based on specific market dynamics and technological advancements. For example, the demand for Nanofiltration is growing rapidly due to its ability to remove smaller contaminants, particularly in the biopharmaceutical industry.
Pharmaceutical Filtration Devices Industry Product Innovations
Recent innovations include the development of advanced membrane materials with enhanced performance characteristics, such as higher flux rates and improved selectivity. Single-use systems are gaining traction, reducing cleaning validation requirements and improving process efficiency. Furthermore, automation and digitalization are enhancing process control and optimizing overall filtration performance. These innovations are improving efficiency, reducing costs, and enhancing product quality, thereby strengthening their market fit.
Report Scope & Segmentation Analysis
This report comprehensively segments the pharmaceutical filtration devices market by application (Final Product Processing, Raw Material Filtration, Cell Separation, Water Purification, Air Purification), material (Polyethersulfone (PES), Mixed Cellulose Ester & Cellulose Acetate (MCE & CA), Polyvinylidene Difluoride (PVDF), Nylon Membrane Filters, Others), and technique (Microfiltration, Ultrafiltration, Nanofiltration, Others). Each segment is analyzed in terms of market size, growth projections, and competitive dynamics. Growth projections vary significantly across segments depending on factors like technological advancements and end-user demands. For example, the cell separation segment shows a higher projected growth rate compared to the water purification segment.
Key Drivers of Pharmaceutical Filtration Devices Industry Growth
The growth of the pharmaceutical filtration devices market is fueled by several key drivers, including the rising prevalence of chronic diseases, increased demand for biologics, stringent regulatory requirements for product purity, and ongoing technological advancements resulting in improved filtration efficacy and reduced processing times. The increasing adoption of advanced filtration technologies, such as single-use systems and automated filtration processes, also contributes significantly to market expansion.
Challenges in the Pharmaceutical Filtration Devices Industry Sector
The pharmaceutical filtration devices industry faces several challenges including stringent regulatory compliance requirements, potential supply chain disruptions impacting raw material availability, and intense competition from established and emerging players. These challenges can significantly impact production costs and market entry for new players. The industry is also subject to fluctuating raw material prices, leading to cost pressures and influencing profitability.
Emerging Opportunities in Pharmaceutical Filtration Devices Industry
Emerging opportunities lie in the development of innovative filtration technologies for advanced therapeutics, such as gene therapy and cell therapy products. The growing focus on sustainability is creating demand for eco-friendly filtration solutions. Expansion into emerging markets with developing healthcare infrastructure also presents significant growth potential. Furthermore, the integration of digital technologies for process optimization and predictive maintenance offers attractive opportunities.
Leading Players in the Pharmaceutical Filtration Devices Industry Market
- Merck Millipore
- Repligen Corporation
- Sartorius Stedim Biotech
- GE Healthcare
- 3M Company
- GEA Group
- Danaher Corporation
- Graver Technologies
- Thermo Fisher Scientific
- Parker Hannifin Corporation
Key Developments in Pharmaceutical Filtration Devices Industry
- 2022 Q4: Merck Millipore launched a new ultrafiltration membrane with enhanced flux rates.
- 2023 Q1: Sartorius Stedim Biotech acquired a smaller filtration technology company for $XX billion.
- 2023 Q3: Danaher Corporation invested in the development of automated filtration systems. (Further specific developments with dates can be added here based on available data)
Future Outlook for Pharmaceutical Filtration Devices Industry Market
The pharmaceutical filtration devices market is poised for continued growth, driven by technological advancements, the rising demand for biopharmaceuticals, and increasing investments in healthcare infrastructure globally. The market will likely witness further consolidation through mergers and acquisitions, with a focus on innovation and expansion into new therapeutic areas. Strategic partnerships and collaborations will play a key role in shaping the future competitive landscape. The adoption of sustainable and cost-effective filtration technologies will be a critical factor in determining long-term market success.
Pharmaceutical Filtration Devices Industry Segmentation
-
1. Material
- 1.1. Polyethersulfone (PES)
- 1.2. Mixed Ce
- 1.3. Polyvinylidene Difluoride (PVDF)
- 1.4. Nylon Membrane Filters
- 1.5. Others
-
2. Technique
- 2.1. Microfiltration
- 2.2. Ultrafiltration
- 2.3. Nanofiltration
- 2.4. Others
-
3. Application
- 3.1. Final Product Processing
- 3.2. Raw Material Filtration
- 3.3. Cell Separation
- 3.4. Water Purification
- 3.5. Air Purification
Pharmaceutical Filtration Devices Industry Segmentation By Geography
-
1. North America
- 1.1. United States
- 1.2. Canada
- 1.3. Mexico
-
2. Europe
- 2.1. Germany
- 2.2. United Kingdom
- 2.3. France
- 2.4. Italy
- 2.5. Spain
- 2.6. Rest of Europe
-
3. Asia Pacific
- 3.1. China
- 3.2. Japan
- 3.3. India
- 3.4. Australia
- 3.5. South Korea
- 3.6. Rest of Asia Pacific
- 4. Rest of the World

Pharmaceutical Filtration Devices Industry REPORT HIGHLIGHTS
| Aspects | Details |
|---|---|
| Study Period | 2019-2033 |
| Base Year | 2024 |
| Estimated Year | 2025 |
| Forecast Period | 2025-2033 |
| Historical Period | 2019-2024 |
| Growth Rate | CAGR of 9.10% from 2019-2033 |
| Segmentation |
|
Table of Contents
- 1. Introduction
- 1.1. Research Scope
- 1.2. Market Segmentation
- 1.3. Research Methodology
- 1.4. Definitions and Assumptions
- 2. Executive Summary
- 2.1. Introduction
- 3. Market Dynamics
- 3.1. Introduction
- 3.2. Market Drivers
- 3.2.1. Increasing Adoption of Single-Use Technologies; Advancements in Nanofiltration Technology
- 3.3. Market Restrains
- 3.3.1. High Capital Required for Operations; Membrane Fouling
- 3.4. Market Trends
- 3.4.1. Microfiltration is Expected to Register a High CAGR Through the Forecast Period
- 4. Market Factor Analysis
- 4.1. Porters Five Forces
- 4.2. Supply/Value Chain
- 4.3. PESTEL analysis
- 4.4. Market Entropy
- 4.5. Patent/Trademark Analysis
- 5. Global Pharmaceutical Filtration Devices Industry Analysis, Insights and Forecast, 2019-2031
- 5.1. Market Analysis, Insights and Forecast - by Material
- 5.1.1. Polyethersulfone (PES)
- 5.1.2. Mixed Ce
- 5.1.3. Polyvinylidene Difluoride (PVDF)
- 5.1.4. Nylon Membrane Filters
- 5.1.5. Others
- 5.2. Market Analysis, Insights and Forecast - by Technique
- 5.2.1. Microfiltration
- 5.2.2. Ultrafiltration
- 5.2.3. Nanofiltration
- 5.2.4. Others
- 5.3. Market Analysis, Insights and Forecast - by Application
- 5.3.1. Final Product Processing
- 5.3.2. Raw Material Filtration
- 5.3.3. Cell Separation
- 5.3.4. Water Purification
- 5.3.5. Air Purification
- 5.4. Market Analysis, Insights and Forecast - by Region
- 5.4.1. North America
- 5.4.2. Europe
- 5.4.3. Asia Pacific
- 5.4.4. Rest of the World
- 5.1. Market Analysis, Insights and Forecast - by Material
- 6. North America Pharmaceutical Filtration Devices Industry Analysis, Insights and Forecast, 2019-2031
- 6.1. Market Analysis, Insights and Forecast - by Material
- 6.1.1. Polyethersulfone (PES)
- 6.1.2. Mixed Ce
- 6.1.3. Polyvinylidene Difluoride (PVDF)
- 6.1.4. Nylon Membrane Filters
- 6.1.5. Others
- 6.2. Market Analysis, Insights and Forecast - by Technique
- 6.2.1. Microfiltration
- 6.2.2. Ultrafiltration
- 6.2.3. Nanofiltration
- 6.2.4. Others
- 6.3. Market Analysis, Insights and Forecast - by Application
- 6.3.1. Final Product Processing
- 6.3.2. Raw Material Filtration
- 6.3.3. Cell Separation
- 6.3.4. Water Purification
- 6.3.5. Air Purification
- 6.1. Market Analysis, Insights and Forecast - by Material
- 7. Europe Pharmaceutical Filtration Devices Industry Analysis, Insights and Forecast, 2019-2031
- 7.1. Market Analysis, Insights and Forecast - by Material
- 7.1.1. Polyethersulfone (PES)
- 7.1.2. Mixed Ce
- 7.1.3. Polyvinylidene Difluoride (PVDF)
- 7.1.4. Nylon Membrane Filters
- 7.1.5. Others
- 7.2. Market Analysis, Insights and Forecast - by Technique
- 7.2.1. Microfiltration
- 7.2.2. Ultrafiltration
- 7.2.3. Nanofiltration
- 7.2.4. Others
- 7.3. Market Analysis, Insights and Forecast - by Application
- 7.3.1. Final Product Processing
- 7.3.2. Raw Material Filtration
- 7.3.3. Cell Separation
- 7.3.4. Water Purification
- 7.3.5. Air Purification
- 7.1. Market Analysis, Insights and Forecast - by Material
- 8. Asia Pacific Pharmaceutical Filtration Devices Industry Analysis, Insights and Forecast, 2019-2031
- 8.1. Market Analysis, Insights and Forecast - by Material
- 8.1.1. Polyethersulfone (PES)
- 8.1.2. Mixed Ce
- 8.1.3. Polyvinylidene Difluoride (PVDF)
- 8.1.4. Nylon Membrane Filters
- 8.1.5. Others
- 8.2. Market Analysis, Insights and Forecast - by Technique
- 8.2.1. Microfiltration
- 8.2.2. Ultrafiltration
- 8.2.3. Nanofiltration
- 8.2.4. Others
- 8.3. Market Analysis, Insights and Forecast - by Application
- 8.3.1. Final Product Processing
- 8.3.2. Raw Material Filtration
- 8.3.3. Cell Separation
- 8.3.4. Water Purification
- 8.3.5. Air Purification
- 8.1. Market Analysis, Insights and Forecast - by Material
- 9. Rest of the World Pharmaceutical Filtration Devices Industry Analysis, Insights and Forecast, 2019-2031
- 9.1. Market Analysis, Insights and Forecast - by Material
- 9.1.1. Polyethersulfone (PES)
- 9.1.2. Mixed Ce
- 9.1.3. Polyvinylidene Difluoride (PVDF)
- 9.1.4. Nylon Membrane Filters
- 9.1.5. Others
- 9.2. Market Analysis, Insights and Forecast - by Technique
- 9.2.1. Microfiltration
- 9.2.2. Ultrafiltration
- 9.2.3. Nanofiltration
- 9.2.4. Others
- 9.3. Market Analysis, Insights and Forecast - by Application
- 9.3.1. Final Product Processing
- 9.3.2. Raw Material Filtration
- 9.3.3. Cell Separation
- 9.3.4. Water Purification
- 9.3.5. Air Purification
- 9.1. Market Analysis, Insights and Forecast - by Material
- 10. North Americ Pharmaceutical Filtration Devices Industry Analysis, Insights and Forecast, 2019-2031
- 10.1. Market Analysis, Insights and Forecast - By Country/Sub-region
- 10.1.1 United States
- 10.1.2 Canada
- 10.1.3 Mexico
- 11. South America Pharmaceutical Filtration Devices Industry Analysis, Insights and Forecast, 2019-2031
- 11.1. Market Analysis, Insights and Forecast - By Country/Sub-region
- 11.1.1 Brazil
- 11.1.2 Mexico
- 11.1.3 Rest of South America
- 12. Europe Pharmaceutical Filtration Devices Industry Analysis, Insights and Forecast, 2019-2031
- 12.1. Market Analysis, Insights and Forecast - By Country/Sub-region
- 12.1.1 Germany
- 12.1.2 United Kingdom
- 12.1.3 France
- 12.1.4 Italy
- 12.1.5 Spain
- 12.1.6 Rest of Europe
- 13. Asia Pacific Pharmaceutical Filtration Devices Industry Analysis, Insights and Forecast, 2019-2031
- 13.1. Market Analysis, Insights and Forecast - By Country/Sub-region
- 13.1.1 China
- 13.1.2 Japan
- 13.1.3 India
- 13.1.4 South Korea
- 13.1.5 Taiwan
- 13.1.6 Australia
- 13.1.7 Rest of Asia-Pacific
- 14. MEA Pharmaceutical Filtration Devices Industry Analysis, Insights and Forecast, 2019-2031
- 14.1. Market Analysis, Insights and Forecast - By Country/Sub-region
- 14.1.1 Middle East
- 14.1.2 Africa
- 15. Competitive Analysis
- 15.1. Global Market Share Analysis 2024
- 15.2. Company Profiles
- 15.2.1 Merck Millipore
- 15.2.1.1. Overview
- 15.2.1.2. Products
- 15.2.1.3. SWOT Analysis
- 15.2.1.4. Recent Developments
- 15.2.1.5. Financials (Based on Availability)
- 15.2.2 Repligen Corporation
- 15.2.2.1. Overview
- 15.2.2.2. Products
- 15.2.2.3. SWOT Analysis
- 15.2.2.4. Recent Developments
- 15.2.2.5. Financials (Based on Availability)
- 15.2.3 Sartorius Stedim Biotech
- 15.2.3.1. Overview
- 15.2.3.2. Products
- 15.2.3.3. SWOT Analysis
- 15.2.3.4. Recent Developments
- 15.2.3.5. Financials (Based on Availability)
- 15.2.4 GE Healthcare
- 15.2.4.1. Overview
- 15.2.4.2. Products
- 15.2.4.3. SWOT Analysis
- 15.2.4.4. Recent Developments
- 15.2.4.5. Financials (Based on Availability)
- 15.2.5 3M Company
- 15.2.5.1. Overview
- 15.2.5.2. Products
- 15.2.5.3. SWOT Analysis
- 15.2.5.4. Recent Developments
- 15.2.5.5. Financials (Based on Availability)
- 15.2.6 GEA Group
- 15.2.6.1. Overview
- 15.2.6.2. Products
- 15.2.6.3. SWOT Analysis
- 15.2.6.4. Recent Developments
- 15.2.6.5. Financials (Based on Availability)
- 15.2.7 Danaher Corporation
- 15.2.7.1. Overview
- 15.2.7.2. Products
- 15.2.7.3. SWOT Analysis
- 15.2.7.4. Recent Developments
- 15.2.7.5. Financials (Based on Availability)
- 15.2.8 Graver Technologies
- 15.2.8.1. Overview
- 15.2.8.2. Products
- 15.2.8.3. SWOT Analysis
- 15.2.8.4. Recent Developments
- 15.2.8.5. Financials (Based on Availability)
- 15.2.9 Thermo Fisher Scientific
- 15.2.9.1. Overview
- 15.2.9.2. Products
- 15.2.9.3. SWOT Analysis
- 15.2.9.4. Recent Developments
- 15.2.9.5. Financials (Based on Availability)
- 15.2.10 Parker Hannifin Corporation
- 15.2.10.1. Overview
- 15.2.10.2. Products
- 15.2.10.3. SWOT Analysis
- 15.2.10.4. Recent Developments
- 15.2.10.5. Financials (Based on Availability)
- 15.2.1 Merck Millipore
List of Figures
- Figure 1: Global Pharmaceutical Filtration Devices Industry Revenue Breakdown (billion, %) by Region 2024 & 2032
- Figure 2: Global Pharmaceutical Filtration Devices Industry Volume Breakdown (K Units, %) by Region 2024 & 2032
- Figure 3: North Americ Pharmaceutical Filtration Devices Industry Revenue (billion), by Country 2024 & 2032
- Figure 4: North Americ Pharmaceutical Filtration Devices Industry Volume (K Units), by Country 2024 & 2032
- Figure 5: North Americ Pharmaceutical Filtration Devices Industry Revenue Share (%), by Country 2024 & 2032
- Figure 6: North Americ Pharmaceutical Filtration Devices Industry Volume Share (%), by Country 2024 & 2032
- Figure 7: South America Pharmaceutical Filtration Devices Industry Revenue (billion), by Country 2024 & 2032
- Figure 8: South America Pharmaceutical Filtration Devices Industry Volume (K Units), by Country 2024 & 2032
- Figure 9: South America Pharmaceutical Filtration Devices Industry Revenue Share (%), by Country 2024 & 2032
- Figure 10: South America Pharmaceutical Filtration Devices Industry Volume Share (%), by Country 2024 & 2032
- Figure 11: Europe Pharmaceutical Filtration Devices Industry Revenue (billion), by Country 2024 & 2032
- Figure 12: Europe Pharmaceutical Filtration Devices Industry Volume (K Units), by Country 2024 & 2032
- Figure 13: Europe Pharmaceutical Filtration Devices Industry Revenue Share (%), by Country 2024 & 2032
- Figure 14: Europe Pharmaceutical Filtration Devices Industry Volume Share (%), by Country 2024 & 2032
- Figure 15: Asia Pacific Pharmaceutical Filtration Devices Industry Revenue (billion), by Country 2024 & 2032
- Figure 16: Asia Pacific Pharmaceutical Filtration Devices Industry Volume (K Units), by Country 2024 & 2032
- Figure 17: Asia Pacific Pharmaceutical Filtration Devices Industry Revenue Share (%), by Country 2024 & 2032
- Figure 18: Asia Pacific Pharmaceutical Filtration Devices Industry Volume Share (%), by Country 2024 & 2032
- Figure 19: MEA Pharmaceutical Filtration Devices Industry Revenue (billion), by Country 2024 & 2032
- Figure 20: MEA Pharmaceutical Filtration Devices Industry Volume (K Units), by Country 2024 & 2032
- Figure 21: MEA Pharmaceutical Filtration Devices Industry Revenue Share (%), by Country 2024 & 2032
- Figure 22: MEA Pharmaceutical Filtration Devices Industry Volume Share (%), by Country 2024 & 2032
- Figure 23: North America Pharmaceutical Filtration Devices Industry Revenue (billion), by Material 2024 & 2032
- Figure 24: North America Pharmaceutical Filtration Devices Industry Volume (K Units), by Material 2024 & 2032
- Figure 25: North America Pharmaceutical Filtration Devices Industry Revenue Share (%), by Material 2024 & 2032
- Figure 26: North America Pharmaceutical Filtration Devices Industry Volume Share (%), by Material 2024 & 2032
- Figure 27: North America Pharmaceutical Filtration Devices Industry Revenue (billion), by Technique 2024 & 2032
- Figure 28: North America Pharmaceutical Filtration Devices Industry Volume (K Units), by Technique 2024 & 2032
- Figure 29: North America Pharmaceutical Filtration Devices Industry Revenue Share (%), by Technique 2024 & 2032
- Figure 30: North America Pharmaceutical Filtration Devices Industry Volume Share (%), by Technique 2024 & 2032
- Figure 31: North America Pharmaceutical Filtration Devices Industry Revenue (billion), by Application 2024 & 2032
- Figure 32: North America Pharmaceutical Filtration Devices Industry Volume (K Units), by Application 2024 & 2032
- Figure 33: North America Pharmaceutical Filtration Devices Industry Revenue Share (%), by Application 2024 & 2032
- Figure 34: North America Pharmaceutical Filtration Devices Industry Volume Share (%), by Application 2024 & 2032
- Figure 35: North America Pharmaceutical Filtration Devices Industry Revenue (billion), by Country 2024 & 2032
- Figure 36: North America Pharmaceutical Filtration Devices Industry Volume (K Units), by Country 2024 & 2032
- Figure 37: North America Pharmaceutical Filtration Devices Industry Revenue Share (%), by Country 2024 & 2032
- Figure 38: North America Pharmaceutical Filtration Devices Industry Volume Share (%), by Country 2024 & 2032
- Figure 39: Europe Pharmaceutical Filtration Devices Industry Revenue (billion), by Material 2024 & 2032
- Figure 40: Europe Pharmaceutical Filtration Devices Industry Volume (K Units), by Material 2024 & 2032
- Figure 41: Europe Pharmaceutical Filtration Devices Industry Revenue Share (%), by Material 2024 & 2032
- Figure 42: Europe Pharmaceutical Filtration Devices Industry Volume Share (%), by Material 2024 & 2032
- Figure 43: Europe Pharmaceutical Filtration Devices Industry Revenue (billion), by Technique 2024 & 2032
- Figure 44: Europe Pharmaceutical Filtration Devices Industry Volume (K Units), by Technique 2024 & 2032
- Figure 45: Europe Pharmaceutical Filtration Devices Industry Revenue Share (%), by Technique 2024 & 2032
- Figure 46: Europe Pharmaceutical Filtration Devices Industry Volume Share (%), by Technique 2024 & 2032
- Figure 47: Europe Pharmaceutical Filtration Devices Industry Revenue (billion), by Application 2024 & 2032
- Figure 48: Europe Pharmaceutical Filtration Devices Industry Volume (K Units), by Application 2024 & 2032
- Figure 49: Europe Pharmaceutical Filtration Devices Industry Revenue Share (%), by Application 2024 & 2032
- Figure 50: Europe Pharmaceutical Filtration Devices Industry Volume Share (%), by Application 2024 & 2032
- Figure 51: Europe Pharmaceutical Filtration Devices Industry Revenue (billion), by Country 2024 & 2032
- Figure 52: Europe Pharmaceutical Filtration Devices Industry Volume (K Units), by Country 2024 & 2032
- Figure 53: Europe Pharmaceutical Filtration Devices Industry Revenue Share (%), by Country 2024 & 2032
- Figure 54: Europe Pharmaceutical Filtration Devices Industry Volume Share (%), by Country 2024 & 2032
- Figure 55: Asia Pacific Pharmaceutical Filtration Devices Industry Revenue (billion), by Material 2024 & 2032
- Figure 56: Asia Pacific Pharmaceutical Filtration Devices Industry Volume (K Units), by Material 2024 & 2032
- Figure 57: Asia Pacific Pharmaceutical Filtration Devices Industry Revenue Share (%), by Material 2024 & 2032
- Figure 58: Asia Pacific Pharmaceutical Filtration Devices Industry Volume Share (%), by Material 2024 & 2032
- Figure 59: Asia Pacific Pharmaceutical Filtration Devices Industry Revenue (billion), by Technique 2024 & 2032
- Figure 60: Asia Pacific Pharmaceutical Filtration Devices Industry Volume (K Units), by Technique 2024 & 2032
- Figure 61: Asia Pacific Pharmaceutical Filtration Devices Industry Revenue Share (%), by Technique 2024 & 2032
- Figure 62: Asia Pacific Pharmaceutical Filtration Devices Industry Volume Share (%), by Technique 2024 & 2032
- Figure 63: Asia Pacific Pharmaceutical Filtration Devices Industry Revenue (billion), by Application 2024 & 2032
- Figure 64: Asia Pacific Pharmaceutical Filtration Devices Industry Volume (K Units), by Application 2024 & 2032
- Figure 65: Asia Pacific Pharmaceutical Filtration Devices Industry Revenue Share (%), by Application 2024 & 2032
- Figure 66: Asia Pacific Pharmaceutical Filtration Devices Industry Volume Share (%), by Application 2024 & 2032
- Figure 67: Asia Pacific Pharmaceutical Filtration Devices Industry Revenue (billion), by Country 2024 & 2032
- Figure 68: Asia Pacific Pharmaceutical Filtration Devices Industry Volume (K Units), by Country 2024 & 2032
- Figure 69: Asia Pacific Pharmaceutical Filtration Devices Industry Revenue Share (%), by Country 2024 & 2032
- Figure 70: Asia Pacific Pharmaceutical Filtration Devices Industry Volume Share (%), by Country 2024 & 2032
- Figure 71: Rest of the World Pharmaceutical Filtration Devices Industry Revenue (billion), by Material 2024 & 2032
- Figure 72: Rest of the World Pharmaceutical Filtration Devices Industry Volume (K Units), by Material 2024 & 2032
- Figure 73: Rest of the World Pharmaceutical Filtration Devices Industry Revenue Share (%), by Material 2024 & 2032
- Figure 74: Rest of the World Pharmaceutical Filtration Devices Industry Volume Share (%), by Material 2024 & 2032
- Figure 75: Rest of the World Pharmaceutical Filtration Devices Industry Revenue (billion), by Technique 2024 & 2032
- Figure 76: Rest of the World Pharmaceutical Filtration Devices Industry Volume (K Units), by Technique 2024 & 2032
- Figure 77: Rest of the World Pharmaceutical Filtration Devices Industry Revenue Share (%), by Technique 2024 & 2032
- Figure 78: Rest of the World Pharmaceutical Filtration Devices Industry Volume Share (%), by Technique 2024 & 2032
- Figure 79: Rest of the World Pharmaceutical Filtration Devices Industry Revenue (billion), by Application 2024 & 2032
- Figure 80: Rest of the World Pharmaceutical Filtration Devices Industry Volume (K Units), by Application 2024 & 2032
- Figure 81: Rest of the World Pharmaceutical Filtration Devices Industry Revenue Share (%), by Application 2024 & 2032
- Figure 82: Rest of the World Pharmaceutical Filtration Devices Industry Volume Share (%), by Application 2024 & 2032
- Figure 83: Rest of the World Pharmaceutical Filtration Devices Industry Revenue (billion), by Country 2024 & 2032
- Figure 84: Rest of the World Pharmaceutical Filtration Devices Industry Volume (K Units), by Country 2024 & 2032
- Figure 85: Rest of the World Pharmaceutical Filtration Devices Industry Revenue Share (%), by Country 2024 & 2032
- Figure 86: Rest of the World Pharmaceutical Filtration Devices Industry Volume Share (%), by Country 2024 & 2032
List of Tables
- Table 1: Global Pharmaceutical Filtration Devices Industry Revenue billion Forecast, by Region 2019 & 2032
- Table 2: Global Pharmaceutical Filtration Devices Industry Volume K Units Forecast, by Region 2019 & 2032
- Table 3: Global Pharmaceutical Filtration Devices Industry Revenue billion Forecast, by Material 2019 & 2032
- Table 4: Global Pharmaceutical Filtration Devices Industry Volume K Units Forecast, by Material 2019 & 2032
- Table 5: Global Pharmaceutical Filtration Devices Industry Revenue billion Forecast, by Technique 2019 & 2032
- Table 6: Global Pharmaceutical Filtration Devices Industry Volume K Units Forecast, by Technique 2019 & 2032
- Table 7: Global Pharmaceutical Filtration Devices Industry Revenue billion Forecast, by Application 2019 & 2032
- Table 8: Global Pharmaceutical Filtration Devices Industry Volume K Units Forecast, by Application 2019 & 2032
- Table 9: Global Pharmaceutical Filtration Devices Industry Revenue billion Forecast, by Region 2019 & 2032
- Table 10: Global Pharmaceutical Filtration Devices Industry Volume K Units Forecast, by Region 2019 & 2032
- Table 11: Global Pharmaceutical Filtration Devices Industry Revenue billion Forecast, by Country 2019 & 2032
- Table 12: Global Pharmaceutical Filtration Devices Industry Volume K Units Forecast, by Country 2019 & 2032
- Table 13: United States Pharmaceutical Filtration Devices Industry Revenue (billion) Forecast, by Application 2019 & 2032
- Table 14: United States Pharmaceutical Filtration Devices Industry Volume (K Units) Forecast, by Application 2019 & 2032
- Table 15: Canada Pharmaceutical Filtration Devices Industry Revenue (billion) Forecast, by Application 2019 & 2032
- Table 16: Canada Pharmaceutical Filtration Devices Industry Volume (K Units) Forecast, by Application 2019 & 2032
- Table 17: Mexico Pharmaceutical Filtration Devices Industry Revenue (billion) Forecast, by Application 2019 & 2032
- Table 18: Mexico Pharmaceutical Filtration Devices Industry Volume (K Units) Forecast, by Application 2019 & 2032
- Table 19: Global Pharmaceutical Filtration Devices Industry Revenue billion Forecast, by Country 2019 & 2032
- Table 20: Global Pharmaceutical Filtration Devices Industry Volume K Units Forecast, by Country 2019 & 2032
- Table 21: Brazil Pharmaceutical Filtration Devices Industry Revenue (billion) Forecast, by Application 2019 & 2032
- Table 22: Brazil Pharmaceutical Filtration Devices Industry Volume (K Units) Forecast, by Application 2019 & 2032
- Table 23: Mexico Pharmaceutical Filtration Devices Industry Revenue (billion) Forecast, by Application 2019 & 2032
- Table 24: Mexico Pharmaceutical Filtration Devices Industry Volume (K Units) Forecast, by Application 2019 & 2032
- Table 25: Rest of South America Pharmaceutical Filtration Devices Industry Revenue (billion) Forecast, by Application 2019 & 2032
- Table 26: Rest of South America Pharmaceutical Filtration Devices Industry Volume (K Units) Forecast, by Application 2019 & 2032
- Table 27: Global Pharmaceutical Filtration Devices Industry Revenue billion Forecast, by Country 2019 & 2032
- Table 28: Global Pharmaceutical Filtration Devices Industry Volume K Units Forecast, by Country 2019 & 2032
- Table 29: Germany Pharmaceutical Filtration Devices Industry Revenue (billion) Forecast, by Application 2019 & 2032
- Table 30: Germany Pharmaceutical Filtration Devices Industry Volume (K Units) Forecast, by Application 2019 & 2032
- Table 31: United Kingdom Pharmaceutical Filtration Devices Industry Revenue (billion) Forecast, by Application 2019 & 2032
- Table 32: United Kingdom Pharmaceutical Filtration Devices Industry Volume (K Units) Forecast, by Application 2019 & 2032
- Table 33: France Pharmaceutical Filtration Devices Industry Revenue (billion) Forecast, by Application 2019 & 2032
- Table 34: France Pharmaceutical Filtration Devices Industry Volume (K Units) Forecast, by Application 2019 & 2032
- Table 35: Italy Pharmaceutical Filtration Devices Industry Revenue (billion) Forecast, by Application 2019 & 2032
- Table 36: Italy Pharmaceutical Filtration Devices Industry Volume (K Units) Forecast, by Application 2019 & 2032
- Table 37: Spain Pharmaceutical Filtration Devices Industry Revenue (billion) Forecast, by Application 2019 & 2032
- Table 38: Spain Pharmaceutical Filtration Devices Industry Volume (K Units) Forecast, by Application 2019 & 2032
- Table 39: Rest of Europe Pharmaceutical Filtration Devices Industry Revenue (billion) Forecast, by Application 2019 & 2032
- Table 40: Rest of Europe Pharmaceutical Filtration Devices Industry Volume (K Units) Forecast, by Application 2019 & 2032
- Table 41: Global Pharmaceutical Filtration Devices Industry Revenue billion Forecast, by Country 2019 & 2032
- Table 42: Global Pharmaceutical Filtration Devices Industry Volume K Units Forecast, by Country 2019 & 2032
- Table 43: China Pharmaceutical Filtration Devices Industry Revenue (billion) Forecast, by Application 2019 & 2032
- Table 44: China Pharmaceutical Filtration Devices Industry Volume (K Units) Forecast, by Application 2019 & 2032
- Table 45: Japan Pharmaceutical Filtration Devices Industry Revenue (billion) Forecast, by Application 2019 & 2032
- Table 46: Japan Pharmaceutical Filtration Devices Industry Volume (K Units) Forecast, by Application 2019 & 2032
- Table 47: India Pharmaceutical Filtration Devices Industry Revenue (billion) Forecast, by Application 2019 & 2032
- Table 48: India Pharmaceutical Filtration Devices Industry Volume (K Units) Forecast, by Application 2019 & 2032
- Table 49: South Korea Pharmaceutical Filtration Devices Industry Revenue (billion) Forecast, by Application 2019 & 2032
- Table 50: South Korea Pharmaceutical Filtration Devices Industry Volume (K Units) Forecast, by Application 2019 & 2032
- Table 51: Taiwan Pharmaceutical Filtration Devices Industry Revenue (billion) Forecast, by Application 2019 & 2032
- Table 52: Taiwan Pharmaceutical Filtration Devices Industry Volume (K Units) Forecast, by Application 2019 & 2032
- Table 53: Australia Pharmaceutical Filtration Devices Industry Revenue (billion) Forecast, by Application 2019 & 2032
- Table 54: Australia Pharmaceutical Filtration Devices Industry Volume (K Units) Forecast, by Application 2019 & 2032
- Table 55: Rest of Asia-Pacific Pharmaceutical Filtration Devices Industry Revenue (billion) Forecast, by Application 2019 & 2032
- Table 56: Rest of Asia-Pacific Pharmaceutical Filtration Devices Industry Volume (K Units) Forecast, by Application 2019 & 2032
- Table 57: Global Pharmaceutical Filtration Devices Industry Revenue billion Forecast, by Country 2019 & 2032
- Table 58: Global Pharmaceutical Filtration Devices Industry Volume K Units Forecast, by Country 2019 & 2032
- Table 59: Middle East Pharmaceutical Filtration Devices Industry Revenue (billion) Forecast, by Application 2019 & 2032
- Table 60: Middle East Pharmaceutical Filtration Devices Industry Volume (K Units) Forecast, by Application 2019 & 2032
- Table 61: Africa Pharmaceutical Filtration Devices Industry Revenue (billion) Forecast, by Application 2019 & 2032
- Table 62: Africa Pharmaceutical Filtration Devices Industry Volume (K Units) Forecast, by Application 2019 & 2032
- Table 63: Global Pharmaceutical Filtration Devices Industry Revenue billion Forecast, by Material 2019 & 2032
- Table 64: Global Pharmaceutical Filtration Devices Industry Volume K Units Forecast, by Material 2019 & 2032
- Table 65: Global Pharmaceutical Filtration Devices Industry Revenue billion Forecast, by Technique 2019 & 2032
- Table 66: Global Pharmaceutical Filtration Devices Industry Volume K Units Forecast, by Technique 2019 & 2032
- Table 67: Global Pharmaceutical Filtration Devices Industry Revenue billion Forecast, by Application 2019 & 2032
- Table 68: Global Pharmaceutical Filtration Devices Industry Volume K Units Forecast, by Application 2019 & 2032
- Table 69: Global Pharmaceutical Filtration Devices Industry Revenue billion Forecast, by Country 2019 & 2032
- Table 70: Global Pharmaceutical Filtration Devices Industry Volume K Units Forecast, by Country 2019 & 2032
- Table 71: United States Pharmaceutical Filtration Devices Industry Revenue (billion) Forecast, by Application 2019 & 2032
- Table 72: United States Pharmaceutical Filtration Devices Industry Volume (K Units) Forecast, by Application 2019 & 2032
- Table 73: Canada Pharmaceutical Filtration Devices Industry Revenue (billion) Forecast, by Application 2019 & 2032
- Table 74: Canada Pharmaceutical Filtration Devices Industry Volume (K Units) Forecast, by Application 2019 & 2032
- Table 75: Mexico Pharmaceutical Filtration Devices Industry Revenue (billion) Forecast, by Application 2019 & 2032
- Table 76: Mexico Pharmaceutical Filtration Devices Industry Volume (K Units) Forecast, by Application 2019 & 2032
- Table 77: Global Pharmaceutical Filtration Devices Industry Revenue billion Forecast, by Material 2019 & 2032
- Table 78: Global Pharmaceutical Filtration Devices Industry Volume K Units Forecast, by Material 2019 & 2032
- Table 79: Global Pharmaceutical Filtration Devices Industry Revenue billion Forecast, by Technique 2019 & 2032
- Table 80: Global Pharmaceutical Filtration Devices Industry Volume K Units Forecast, by Technique 2019 & 2032
- Table 81: Global Pharmaceutical Filtration Devices Industry Revenue billion Forecast, by Application 2019 & 2032
- Table 82: Global Pharmaceutical Filtration Devices Industry Volume K Units Forecast, by Application 2019 & 2032
- Table 83: Global Pharmaceutical Filtration Devices Industry Revenue billion Forecast, by Country 2019 & 2032
- Table 84: Global Pharmaceutical Filtration Devices Industry Volume K Units Forecast, by Country 2019 & 2032
- Table 85: Germany Pharmaceutical Filtration Devices Industry Revenue (billion) Forecast, by Application 2019 & 2032
- Table 86: Germany Pharmaceutical Filtration Devices Industry Volume (K Units) Forecast, by Application 2019 & 2032
- Table 87: United Kingdom Pharmaceutical Filtration Devices Industry Revenue (billion) Forecast, by Application 2019 & 2032
- Table 88: United Kingdom Pharmaceutical Filtration Devices Industry Volume (K Units) Forecast, by Application 2019 & 2032
- Table 89: France Pharmaceutical Filtration Devices Industry Revenue (billion) Forecast, by Application 2019 & 2032
- Table 90: France Pharmaceutical Filtration Devices Industry Volume (K Units) Forecast, by Application 2019 & 2032
- Table 91: Italy Pharmaceutical Filtration Devices Industry Revenue (billion) Forecast, by Application 2019 & 2032
- Table 92: Italy Pharmaceutical Filtration Devices Industry Volume (K Units) Forecast, by Application 2019 & 2032
- Table 93: Spain Pharmaceutical Filtration Devices Industry Revenue (billion) Forecast, by Application 2019 & 2032
- Table 94: Spain Pharmaceutical Filtration Devices Industry Volume (K Units) Forecast, by Application 2019 & 2032
- Table 95: Rest of Europe Pharmaceutical Filtration Devices Industry Revenue (billion) Forecast, by Application 2019 & 2032
- Table 96: Rest of Europe Pharmaceutical Filtration Devices Industry Volume (K Units) Forecast, by Application 2019 & 2032
- Table 97: Global Pharmaceutical Filtration Devices Industry Revenue billion Forecast, by Material 2019 & 2032
- Table 98: Global Pharmaceutical Filtration Devices Industry Volume K Units Forecast, by Material 2019 & 2032
- Table 99: Global Pharmaceutical Filtration Devices Industry Revenue billion Forecast, by Technique 2019 & 2032
- Table 100: Global Pharmaceutical Filtration Devices Industry Volume K Units Forecast, by Technique 2019 & 2032
- Table 101: Global Pharmaceutical Filtration Devices Industry Revenue billion Forecast, by Application 2019 & 2032
- Table 102: Global Pharmaceutical Filtration Devices Industry Volume K Units Forecast, by Application 2019 & 2032
- Table 103: Global Pharmaceutical Filtration Devices Industry Revenue billion Forecast, by Country 2019 & 2032
- Table 104: Global Pharmaceutical Filtration Devices Industry Volume K Units Forecast, by Country 2019 & 2032
- Table 105: China Pharmaceutical Filtration Devices Industry Revenue (billion) Forecast, by Application 2019 & 2032
- Table 106: China Pharmaceutical Filtration Devices Industry Volume (K Units) Forecast, by Application 2019 & 2032
- Table 107: Japan Pharmaceutical Filtration Devices Industry Revenue (billion) Forecast, by Application 2019 & 2032
- Table 108: Japan Pharmaceutical Filtration Devices Industry Volume (K Units) Forecast, by Application 2019 & 2032
- Table 109: India Pharmaceutical Filtration Devices Industry Revenue (billion) Forecast, by Application 2019 & 2032
- Table 110: India Pharmaceutical Filtration Devices Industry Volume (K Units) Forecast, by Application 2019 & 2032
- Table 111: Australia Pharmaceutical Filtration Devices Industry Revenue (billion) Forecast, by Application 2019 & 2032
- Table 112: Australia Pharmaceutical Filtration Devices Industry Volume (K Units) Forecast, by Application 2019 & 2032
- Table 113: South Korea Pharmaceutical Filtration Devices Industry Revenue (billion) Forecast, by Application 2019 & 2032
- Table 114: South Korea Pharmaceutical Filtration Devices Industry Volume (K Units) Forecast, by Application 2019 & 2032
- Table 115: Rest of Asia Pacific Pharmaceutical Filtration Devices Industry Revenue (billion) Forecast, by Application 2019 & 2032
- Table 116: Rest of Asia Pacific Pharmaceutical Filtration Devices Industry Volume (K Units) Forecast, by Application 2019 & 2032
- Table 117: Global Pharmaceutical Filtration Devices Industry Revenue billion Forecast, by Material 2019 & 2032
- Table 118: Global Pharmaceutical Filtration Devices Industry Volume K Units Forecast, by Material 2019 & 2032
- Table 119: Global Pharmaceutical Filtration Devices Industry Revenue billion Forecast, by Technique 2019 & 2032
- Table 120: Global Pharmaceutical Filtration Devices Industry Volume K Units Forecast, by Technique 2019 & 2032
- Table 121: Global Pharmaceutical Filtration Devices Industry Revenue billion Forecast, by Application 2019 & 2032
- Table 122: Global Pharmaceutical Filtration Devices Industry Volume K Units Forecast, by Application 2019 & 2032
- Table 123: Global Pharmaceutical Filtration Devices Industry Revenue billion Forecast, by Country 2019 & 2032
- Table 124: Global Pharmaceutical Filtration Devices Industry Volume K Units Forecast, by Country 2019 & 2032
Frequently Asked Questions
1. What is the projected Compound Annual Growth Rate (CAGR) of the Pharmaceutical Filtration Devices Industry?
The projected CAGR is approximately 9.10%.
2. Which companies are prominent players in the Pharmaceutical Filtration Devices Industry?
Key companies in the market include Merck Millipore, Repligen Corporation, Sartorius Stedim Biotech, GE Healthcare, 3M Company, GEA Group, Danaher Corporation, Graver Technologies, Thermo Fisher Scientific, Parker Hannifin Corporation.
3. What are the main segments of the Pharmaceutical Filtration Devices Industry?
The market segments include Material, Technique, Application.
4. Can you provide details about the market size?
The market size is estimated to be USD XX billion as of 2022.
5. What are some drivers contributing to market growth?
Increasing Adoption of Single-Use Technologies; Advancements in Nanofiltration Technology.
6. What are the notable trends driving market growth?
Microfiltration is Expected to Register a High CAGR Through the Forecast Period.
7. Are there any restraints impacting market growth?
High Capital Required for Operations; Membrane Fouling.
8. Can you provide examples of recent developments in the market?
N/A
9. What pricing options are available for accessing the report?
Pricing options include single-user, multi-user, and enterprise licenses priced at USD 4750, USD 5250, and USD 8750 respectively.
10. Is the market size provided in terms of value or volume?
The market size is provided in terms of value, measured in billion and volume, measured in K Units.
11. Are there any specific market keywords associated with the report?
Yes, the market keyword associated with the report is "Pharmaceutical Filtration Devices Industry," which aids in identifying and referencing the specific market segment covered.
12. How do I determine which pricing option suits my needs best?
The pricing options vary based on user requirements and access needs. Individual users may opt for single-user licenses, while businesses requiring broader access may choose multi-user or enterprise licenses for cost-effective access to the report.
13. Are there any additional resources or data provided in the Pharmaceutical Filtration Devices Industry report?
While the report offers comprehensive insights, it's advisable to review the specific contents or supplementary materials provided to ascertain if additional resources or data are available.
14. How can I stay updated on further developments or reports in the Pharmaceutical Filtration Devices Industry?
To stay informed about further developments, trends, and reports in the Pharmaceutical Filtration Devices Industry, consider subscribing to industry newsletters, following relevant companies and organizations, or regularly checking reputable industry news sources and publications.
Methodology
Step 1 - Identification of Relevant Samples Size from Population Database


Step 2 - Approaches for Defining Global Market Size (Value, Volume* & Price*)

Note*: In applicable scenarios
Step 3 - Data Sources
Primary Research
- Web Analytics
- Survey Reports
- Research Institute
- Latest Research Reports
- Opinion Leaders
Secondary Research
- Annual Reports
- White Paper
- Latest Press Release
- Industry Association
- Paid Database
- Investor Presentations

Step 4 - Data Triangulation
Involves using different sources of information in order to increase the validity of a study
These sources are likely to be stakeholders in a program - participants, other researchers, program staff, other community members, and so on.
Then we put all data in single framework & apply various statistical tools to find out the dynamic on the market.
During the analysis stage, feedback from the stakeholder groups would be compared to determine areas of agreement as well as areas of divergence


