
Key Insights
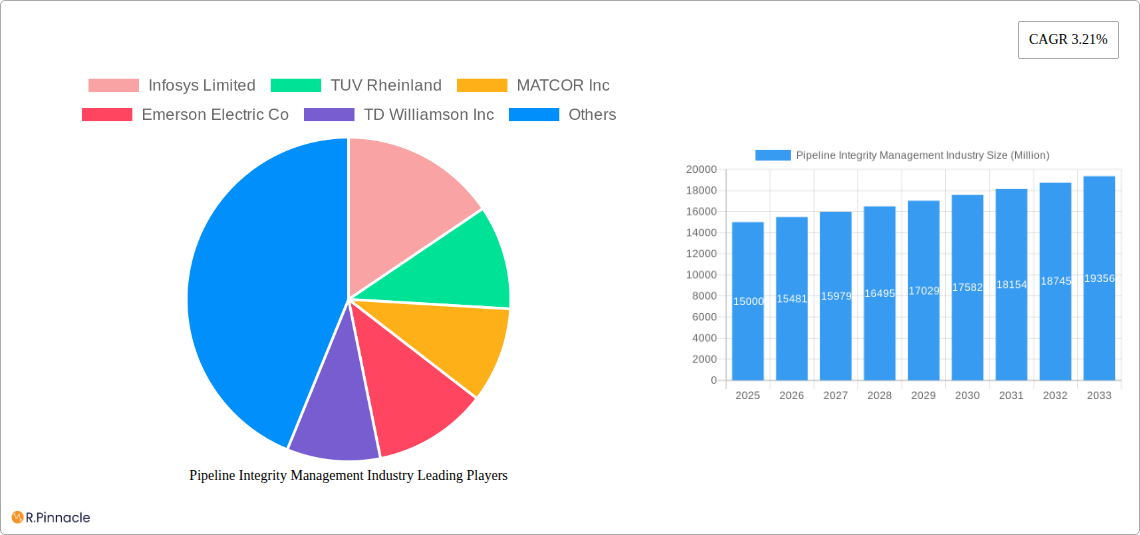
The global pipeline integrity management (PIM) market, valued at approximately $XX million in 2025, is projected to experience steady growth, driven by increasing demand for efficient and safe transportation of oil and gas, stringent regulatory frameworks emphasizing pipeline safety, and the growing adoption of advanced technologies like AI and machine learning for predictive maintenance. The market's Compound Annual Growth Rate (CAGR) of 3.21% from 2025 to 2033 indicates a consistent expansion, although this growth may be influenced by fluctuations in energy prices and geopolitical factors. Onshore deployments currently dominate the market share, but offshore deployments are expected to see significant growth fueled by exploration and production activities in challenging environments. Within service types, inspection services form the largest segment, followed by repair and refurbishment, with cleaning services representing a smaller but growing segment. The crude oil sector currently leads the industry, though natural gas applications are expected to increase proportionally as global demand for natural gas rises. Key players like Infosys Limited, TÜV Rheinland, and Baker Hughes Company are actively investing in research and development, driving innovation in data analytics, robotic inspection, and advanced materials to improve pipeline safety and longevity.
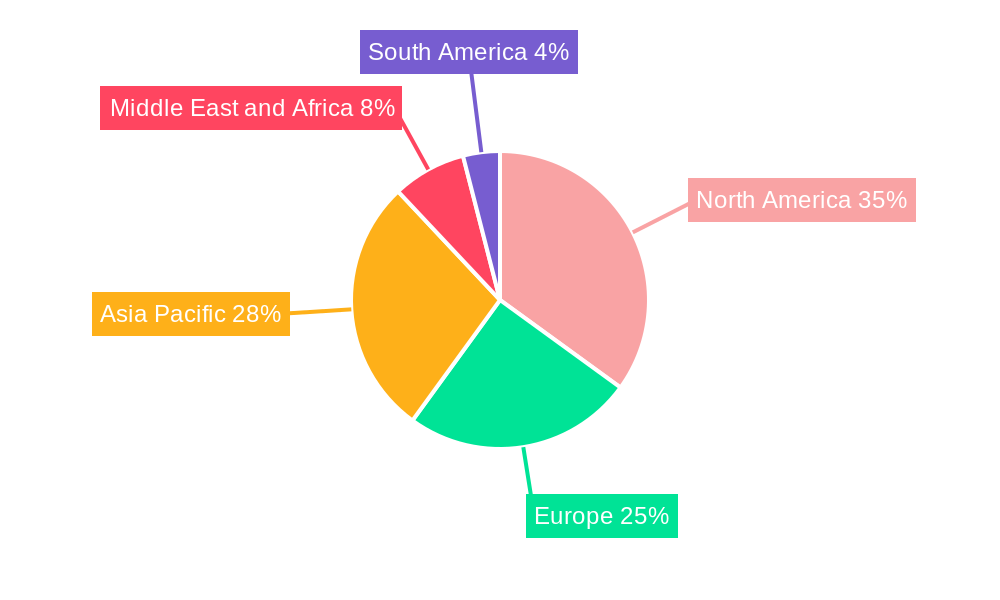
Geographic variations in market growth are expected. North America and the Asia-Pacific region, driven by robust energy infrastructure development and substantial investments in pipeline modernization, will likely remain dominant market regions. Europe is anticipated to witness steady growth, propelled by aging pipeline infrastructure requiring more frequent maintenance and upgrades. The Middle East and Africa region, with its substantial oil and gas reserves, presents considerable growth opportunities, although market expansion will depend on ongoing investments and regulatory policies. However, economic downturns or shifts in energy policies can act as potential restraints, impacting the overall market growth trajectory. The increasing complexity of pipeline networks, coupled with the need for skilled personnel to operate and maintain them, presents further challenges for the industry. The continuous development and adoption of new technologies promise to mitigate these challenges and unlock further market opportunities in the coming years.
Pipeline Integrity Management Industry Report: 2019-2033
This comprehensive report provides a detailed analysis of the Pipeline Integrity Management (PIM) industry, offering actionable insights for industry professionals, investors, and stakeholders. The study period covers 2019-2033, with a base year of 2025 and a forecast period of 2025-2033. The report delves into market dynamics, technological advancements, regional variations, and key players, providing a 360-degree view of this crucial sector. Expected market value is predicted at xx Million by 2033.
Pipeline Integrity Management Industry Market Structure & Innovation Trends
This section analyzes the market concentration, identifying key players and their market share, exploring innovation drivers such as technological advancements and regulatory changes, and examining the impact of mergers and acquisitions (M&A) activity. The competitive landscape is assessed, focusing on strategies employed by leading companies, and the report includes a discussion on product substitutes and their impact on market dynamics.
- Market Concentration: The PIM industry exhibits a moderately consolidated structure, with the top 10 players holding an estimated xx% market share in 2025.
- Innovation Drivers: Technological advancements in inspection techniques (e.g., smart pigging, advanced sensors), stricter regulatory frameworks demanding enhanced safety and environmental protection, and the increasing demand for efficient pipeline operations are major drivers of innovation.
- M&A Activities: The report analyzes significant M&A deals in the historical period (2019-2024), including deal values (estimated at xx Million in total) and their impact on market consolidation. Examples include the impact of strategic alliances on market share and technological capabilities.
- Regulatory Frameworks: Stringent regulations concerning pipeline safety and environmental protection across different regions significantly influence the market's growth trajectory and technology adoption.
- Product Substitutes: While few direct substitutes exist, the development of alternative transportation methods for oil and gas (e.g., rail, road) indirectly impacts the PIM market demand.
- End-User Demographics: The primary end-users are pipeline operators in the crude oil and natural gas sectors, including both large multinational corporations and smaller regional operators.
Pipeline Integrity Management Industry Market Dynamics & Trends
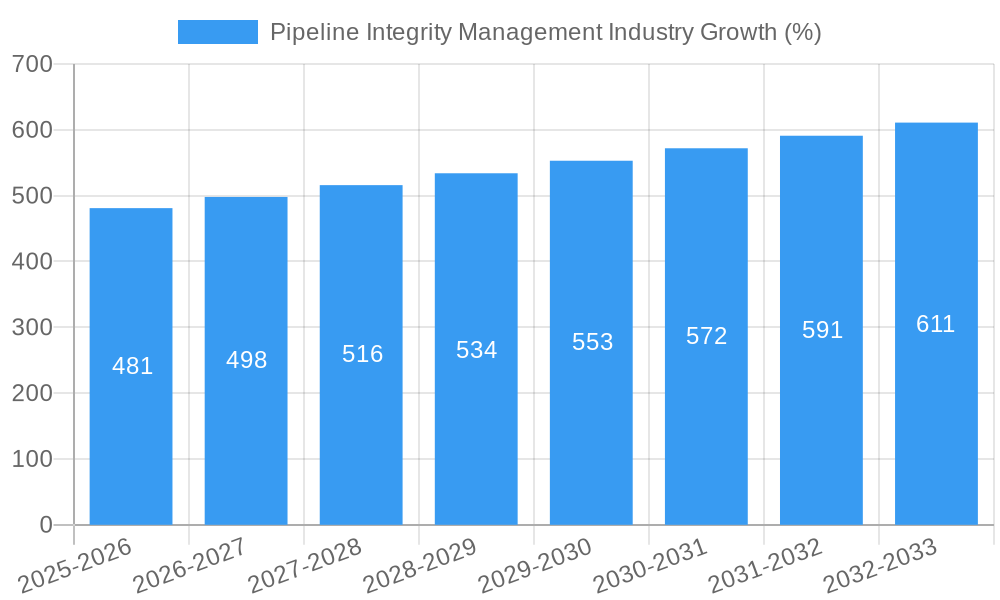
This section explores the key drivers and challenges impacting the PIM market's growth. It delves into the factors influencing market expansion, technological disruptions, shifting consumer preferences (e.g., heightened emphasis on safety and environmental responsibility), and the overall competitive landscape. The report projects a Compound Annual Growth Rate (CAGR) of xx% during the forecast period (2025-2033), with market penetration expected to reach xx% by 2033. Market growth will be fueled by increasing pipeline infrastructure development globally and the need for enhanced safety and efficiency. Further growth is expected to come from the rise of digitalization and the integration of advanced technologies.
Dominant Regions & Segments in Pipeline Integrity Management Industry
This section identifies the leading regions and segments within the PIM market. The analysis considers location of deployment (onshore, offshore), service type (inspection, cleaning, repair and refurbishment), and sector (crude oil, natural gas).
Leading Region/Country: North America is expected to maintain its dominant position during the forecast period, driven by extensive pipeline networks and stringent regulations.
- Onshore Segment: This segment is expected to dominate due to the larger existing onshore pipeline infrastructure. Key drivers include:
- Increasing investments in pipeline infrastructure upgrades and expansion.
- Stringent government regulations regarding pipeline safety.
- Growing demand for efficient and safe transportation of oil and gas.
- Offshore Segment: While smaller than onshore, the offshore segment is experiencing growth driven by exploration and production activities in deepwater areas.
- Inspection Services: This segment is crucial and has the largest market share due to the continuous need for monitoring pipeline integrity.
- Cleaning Services: The increasing demand for preventing blockages and ensuring operational efficiency drives the cleaning services market.
- Repair and Refurbishment Services: Aging pipeline infrastructure necessitates increased repair and refurbishment services.
- Crude Oil Sector: The largest sector driving the PIM market, primarily due to the large volume of crude oil transported via pipelines.
- Natural Gas Sector: The natural gas sector contributes significantly to the market, driven by increasing demand and pipeline expansions.
Pipeline Integrity Management Industry Product Innovations
Recent advancements in PIM technologies include improved inspection tools (smart pigs with advanced sensors), robotic solutions for pipeline repair, and data analytics for predictive maintenance. These innovations improve detection accuracy, reduce downtime, and enhance overall pipeline safety and efficiency. The market is increasingly adopting AI and machine learning for better data analysis and predictive modelling of pipeline integrity.
Report Scope & Segmentation Analysis
This report comprehensively segments the PIM market based on location of deployment (onshore and offshore), service type (inspection, cleaning, repair and refurbishment), and sector (crude oil and natural gas). Each segment's growth projection, market size (xx Million in 2025), and competitive dynamics are analyzed. Onshore deployment is the largest segment, followed by inspection services which are predicted to grow at an impressive CAGR of xx% during the forecast period. Competitive intensity varies across segments, with the inspection services market being more competitive.
Key Drivers of Pipeline Integrity Management Industry Growth
Several factors propel the PIM industry's growth. These include:
- Stringent Government Regulations: Increased emphasis on pipeline safety and environmental protection drives investment in PIM technologies and services.
- Aging Pipeline Infrastructure: The need to maintain and upgrade aging pipelines necessitates significant investment in PIM.
- Technological Advancements: Improved inspection techniques and data analytics enable more efficient and effective pipeline management.
- Growing Energy Demand: The global increase in energy consumption fuels the expansion of pipeline infrastructure.
Challenges in the Pipeline Integrity Management Industry Sector
The PIM industry faces challenges such as:
- High Initial Investment Costs: Implementing advanced PIM technologies can be expensive for pipeline operators, particularly smaller companies.
- Supply Chain Disruptions: The industry's reliance on specialized equipment and skilled labor can be susceptible to supply chain disruptions.
- Regulatory Uncertainty: Changes in environmental regulations and safety standards can impact the market's growth trajectory.
Emerging Opportunities in Pipeline Integrity Management Industry
Emerging trends and opportunities in the PIM industry include:
- Digitalization and IoT: Integration of IoT devices and data analytics for real-time pipeline monitoring and predictive maintenance.
- Advanced Robotics and Automation: Adoption of robotic solutions for inspection, repair, and maintenance tasks to improve efficiency and safety.
- Data Analytics and AI: Leveraging machine learning for enhanced risk assessment and improved predictive capabilities.
Leading Players in the Pipeline Integrity Management Industry Market
- Infosys Limited
- TUV Rheinland
- MATCOR Inc
- Emerson Electric Co
- TD Williamson Inc
- SGS SA
- TWI Ltd
- Baker Hughes Company
- EnerMech Limited
- Bureau Veritas SA
Key Developments in Pipeline Integrity Management Industry Industry
- November 2021: Schneider Electric and Prisma Photonics partnered to provide real-time monitoring of oil and gas infrastructure, enhancing safety and security.
- August 2021: The Dakota Access Pipeline (DAPL) expansion increased capacity by 180,000 BPD, highlighting growth in the sector.
Future Outlook for Pipeline Integrity Management Industry Market
The PIM market is poised for significant growth, driven by increasing energy demand, aging infrastructure, and the adoption of advanced technologies. Strategic investments in digitalization, automation, and predictive maintenance will be crucial for companies to maintain a competitive edge. The market's future success hinges on a balance between technological innovation and regulatory compliance.
Pipeline Integrity Management Industry Segmentation
-
1. Sector
- 1.1. Crude Oil
- 1.2. Natural Gas
-
2. Location of Deployment
- 2.1. Onshore
- 2.2. Offshore
-
3. Service Type
- 3.1. Inspection Services
- 3.2. Cleaning Services
- 3.3. Repair and Refurbishment Services
Pipeline Integrity Management Industry Segmentation By Geography
-
1. North America
- 1.1. United States
- 1.2. Canada
- 1.3. Rest of North America
-
2. Asia Pacific
- 2.1. China
- 2.2. India
- 2.3. Malaysia
- 2.4. Australia
- 2.5. Rest of Asia Pacific
-
3. Europe
- 3.1. United Kingdom
- 3.2. Norway
- 3.3. Russia
- 3.4. Rest of Europe
-
4. Middle East and Africa
- 4.1. Saudi Arabia
- 4.2. United Arab Emirates
- 4.3. Nigeria
- 4.4. Rest of Middle East and Africa
-
5. South America
- 5.1. Brazil
- 5.2. Argentina
- 5.3. Rest of South America
Pipeline Integrity Management Industry REPORT HIGHLIGHTS
| Aspects | Details |
|---|---|
| Study Period | 2019-2033 |
| Base Year | 2024 |
| Estimated Year | 2025 |
| Forecast Period | 2025-2033 |
| Historical Period | 2019-2024 |
| Growth Rate | CAGR of 3.21% from 2019-2033 |
| Segmentation |
|
Table of Contents
- 1. Introduction
- 1.1. Research Scope
- 1.2. Market Segmentation
- 1.3. Research Methodology
- 1.4. Definitions and Assumptions
- 2. Executive Summary
- 2.1. Introduction
- 3. Market Dynamics
- 3.1. Introduction
- 3.2. Market Drivers
- 3.2.1. 4.; Growing Vehicle Ownership4.; Government Initiatives
- 3.3. Market Restrains
- 3.3.1. 4.; Volatile Crude Oil Prices
- 3.4. Market Trends
- 3.4.1. Increasing Demand for Natural Gas Pipeline Infrastructure
- 4. Market Factor Analysis
- 4.1. Porters Five Forces
- 4.2. Supply/Value Chain
- 4.3. PESTEL analysis
- 4.4. Market Entropy
- 4.5. Patent/Trademark Analysis
- 5. Global Pipeline Integrity Management Industry Analysis, Insights and Forecast, 2019-2031
- 5.1. Market Analysis, Insights and Forecast - by Sector
- 5.1.1. Crude Oil
- 5.1.2. Natural Gas
- 5.2. Market Analysis, Insights and Forecast - by Location of Deployment
- 5.2.1. Onshore
- 5.2.2. Offshore
- 5.3. Market Analysis, Insights and Forecast - by Service Type
- 5.3.1. Inspection Services
- 5.3.2. Cleaning Services
- 5.3.3. Repair and Refurbishment Services
- 5.4. Market Analysis, Insights and Forecast - by Region
- 5.4.1. North America
- 5.4.2. Asia Pacific
- 5.4.3. Europe
- 5.4.4. Middle East and Africa
- 5.4.5. South America
- 5.1. Market Analysis, Insights and Forecast - by Sector
- 6. North America Pipeline Integrity Management Industry Analysis, Insights and Forecast, 2019-2031
- 6.1. Market Analysis, Insights and Forecast - by Sector
- 6.1.1. Crude Oil
- 6.1.2. Natural Gas
- 6.2. Market Analysis, Insights and Forecast - by Location of Deployment
- 6.2.1. Onshore
- 6.2.2. Offshore
- 6.3. Market Analysis, Insights and Forecast - by Service Type
- 6.3.1. Inspection Services
- 6.3.2. Cleaning Services
- 6.3.3. Repair and Refurbishment Services
- 6.1. Market Analysis, Insights and Forecast - by Sector
- 7. Asia Pacific Pipeline Integrity Management Industry Analysis, Insights and Forecast, 2019-2031
- 7.1. Market Analysis, Insights and Forecast - by Sector
- 7.1.1. Crude Oil
- 7.1.2. Natural Gas
- 7.2. Market Analysis, Insights and Forecast - by Location of Deployment
- 7.2.1. Onshore
- 7.2.2. Offshore
- 7.3. Market Analysis, Insights and Forecast - by Service Type
- 7.3.1. Inspection Services
- 7.3.2. Cleaning Services
- 7.3.3. Repair and Refurbishment Services
- 7.1. Market Analysis, Insights and Forecast - by Sector
- 8. Europe Pipeline Integrity Management Industry Analysis, Insights and Forecast, 2019-2031
- 8.1. Market Analysis, Insights and Forecast - by Sector
- 8.1.1. Crude Oil
- 8.1.2. Natural Gas
- 8.2. Market Analysis, Insights and Forecast - by Location of Deployment
- 8.2.1. Onshore
- 8.2.2. Offshore
- 8.3. Market Analysis, Insights and Forecast - by Service Type
- 8.3.1. Inspection Services
- 8.3.2. Cleaning Services
- 8.3.3. Repair and Refurbishment Services
- 8.1. Market Analysis, Insights and Forecast - by Sector
- 9. Middle East and Africa Pipeline Integrity Management Industry Analysis, Insights and Forecast, 2019-2031
- 9.1. Market Analysis, Insights and Forecast - by Sector
- 9.1.1. Crude Oil
- 9.1.2. Natural Gas
- 9.2. Market Analysis, Insights and Forecast - by Location of Deployment
- 9.2.1. Onshore
- 9.2.2. Offshore
- 9.3. Market Analysis, Insights and Forecast - by Service Type
- 9.3.1. Inspection Services
- 9.3.2. Cleaning Services
- 9.3.3. Repair and Refurbishment Services
- 9.1. Market Analysis, Insights and Forecast - by Sector
- 10. South America Pipeline Integrity Management Industry Analysis, Insights and Forecast, 2019-2031
- 10.1. Market Analysis, Insights and Forecast - by Sector
- 10.1.1. Crude Oil
- 10.1.2. Natural Gas
- 10.2. Market Analysis, Insights and Forecast - by Location of Deployment
- 10.2.1. Onshore
- 10.2.2. Offshore
- 10.3. Market Analysis, Insights and Forecast - by Service Type
- 10.3.1. Inspection Services
- 10.3.2. Cleaning Services
- 10.3.3. Repair and Refurbishment Services
- 10.1. Market Analysis, Insights and Forecast - by Sector
- 11. North America Pipeline Integrity Management Industry Analysis, Insights and Forecast, 2019-2031
- 11.1. Market Analysis, Insights and Forecast - By Country/Sub-region
- 11.1.1 United States
- 11.1.2 Canada
- 11.1.3 Rest of North America
- 12. Asia Pacific Pipeline Integrity Management Industry Analysis, Insights and Forecast, 2019-2031
- 12.1. Market Analysis, Insights and Forecast - By Country/Sub-region
- 12.1.1 China
- 12.1.2 India
- 12.1.3 Malaysia
- 12.1.4 Australia
- 12.1.5 Rest of Asia Pacific
- 13. Europe Pipeline Integrity Management Industry Analysis, Insights and Forecast, 2019-2031
- 13.1. Market Analysis, Insights and Forecast - By Country/Sub-region
- 13.1.1 United Kingdom
- 13.1.2 Norway
- 13.1.3 Russia
- 13.1.4 Rest of Europe
- 14. Middle East and Africa Pipeline Integrity Management Industry Analysis, Insights and Forecast, 2019-2031
- 14.1. Market Analysis, Insights and Forecast - By Country/Sub-region
- 14.1.1 Saudi Arabia
- 14.1.2 United Arab Emirates
- 14.1.3 Nigeria
- 14.1.4 Rest of Middle East and Africa
- 15. South America Pipeline Integrity Management Industry Analysis, Insights and Forecast, 2019-2031
- 15.1. Market Analysis, Insights and Forecast - By Country/Sub-region
- 15.1.1 Brazil
- 15.1.2 Argentina
- 15.1.3 Rest of South America
- 16. Competitive Analysis
- 16.1. Global Market Share Analysis 2024
- 16.2. Company Profiles
- 16.2.1 Infosys Limited
- 16.2.1.1. Overview
- 16.2.1.2. Products
- 16.2.1.3. SWOT Analysis
- 16.2.1.4. Recent Developments
- 16.2.1.5. Financials (Based on Availability)
- 16.2.2 TUV Rheinland
- 16.2.2.1. Overview
- 16.2.2.2. Products
- 16.2.2.3. SWOT Analysis
- 16.2.2.4. Recent Developments
- 16.2.2.5. Financials (Based on Availability)
- 16.2.3 MATCOR Inc
- 16.2.3.1. Overview
- 16.2.3.2. Products
- 16.2.3.3. SWOT Analysis
- 16.2.3.4. Recent Developments
- 16.2.3.5. Financials (Based on Availability)
- 16.2.4 Emerson Electric Co
- 16.2.4.1. Overview
- 16.2.4.2. Products
- 16.2.4.3. SWOT Analysis
- 16.2.4.4. Recent Developments
- 16.2.4.5. Financials (Based on Availability)
- 16.2.5 TD Williamson Inc
- 16.2.5.1. Overview
- 16.2.5.2. Products
- 16.2.5.3. SWOT Analysis
- 16.2.5.4. Recent Developments
- 16.2.5.5. Financials (Based on Availability)
- 16.2.6 SGS SA
- 16.2.6.1. Overview
- 16.2.6.2. Products
- 16.2.6.3. SWOT Analysis
- 16.2.6.4. Recent Developments
- 16.2.6.5. Financials (Based on Availability)
- 16.2.7 TWI Ltd
- 16.2.7.1. Overview
- 16.2.7.2. Products
- 16.2.7.3. SWOT Analysis
- 16.2.7.4. Recent Developments
- 16.2.7.5. Financials (Based on Availability)
- 16.2.8 Baker Hughes Company
- 16.2.8.1. Overview
- 16.2.8.2. Products
- 16.2.8.3. SWOT Analysis
- 16.2.8.4. Recent Developments
- 16.2.8.5. Financials (Based on Availability)
- 16.2.9 EnerMech Limited
- 16.2.9.1. Overview
- 16.2.9.2. Products
- 16.2.9.3. SWOT Analysis
- 16.2.9.4. Recent Developments
- 16.2.9.5. Financials (Based on Availability)
- 16.2.10 Bureau Veritas SA
- 16.2.10.1. Overview
- 16.2.10.2. Products
- 16.2.10.3. SWOT Analysis
- 16.2.10.4. Recent Developments
- 16.2.10.5. Financials (Based on Availability)
- 16.2.1 Infosys Limited
List of Figures
- Figure 1: Global Pipeline Integrity Management Industry Revenue Breakdown (Million, %) by Region 2024 & 2032
- Figure 2: North America Pipeline Integrity Management Industry Revenue (Million), by Country 2024 & 2032
- Figure 3: North America Pipeline Integrity Management Industry Revenue Share (%), by Country 2024 & 2032
- Figure 4: Asia Pacific Pipeline Integrity Management Industry Revenue (Million), by Country 2024 & 2032
- Figure 5: Asia Pacific Pipeline Integrity Management Industry Revenue Share (%), by Country 2024 & 2032
- Figure 6: Europe Pipeline Integrity Management Industry Revenue (Million), by Country 2024 & 2032
- Figure 7: Europe Pipeline Integrity Management Industry Revenue Share (%), by Country 2024 & 2032
- Figure 8: Middle East and Africa Pipeline Integrity Management Industry Revenue (Million), by Country 2024 & 2032
- Figure 9: Middle East and Africa Pipeline Integrity Management Industry Revenue Share (%), by Country 2024 & 2032
- Figure 10: South America Pipeline Integrity Management Industry Revenue (Million), by Country 2024 & 2032
- Figure 11: South America Pipeline Integrity Management Industry Revenue Share (%), by Country 2024 & 2032
- Figure 12: North America Pipeline Integrity Management Industry Revenue (Million), by Sector 2024 & 2032
- Figure 13: North America Pipeline Integrity Management Industry Revenue Share (%), by Sector 2024 & 2032
- Figure 14: North America Pipeline Integrity Management Industry Revenue (Million), by Location of Deployment 2024 & 2032
- Figure 15: North America Pipeline Integrity Management Industry Revenue Share (%), by Location of Deployment 2024 & 2032
- Figure 16: North America Pipeline Integrity Management Industry Revenue (Million), by Service Type 2024 & 2032
- Figure 17: North America Pipeline Integrity Management Industry Revenue Share (%), by Service Type 2024 & 2032
- Figure 18: North America Pipeline Integrity Management Industry Revenue (Million), by Country 2024 & 2032
- Figure 19: North America Pipeline Integrity Management Industry Revenue Share (%), by Country 2024 & 2032
- Figure 20: Asia Pacific Pipeline Integrity Management Industry Revenue (Million), by Sector 2024 & 2032
- Figure 21: Asia Pacific Pipeline Integrity Management Industry Revenue Share (%), by Sector 2024 & 2032
- Figure 22: Asia Pacific Pipeline Integrity Management Industry Revenue (Million), by Location of Deployment 2024 & 2032
- Figure 23: Asia Pacific Pipeline Integrity Management Industry Revenue Share (%), by Location of Deployment 2024 & 2032
- Figure 24: Asia Pacific Pipeline Integrity Management Industry Revenue (Million), by Service Type 2024 & 2032
- Figure 25: Asia Pacific Pipeline Integrity Management Industry Revenue Share (%), by Service Type 2024 & 2032
- Figure 26: Asia Pacific Pipeline Integrity Management Industry Revenue (Million), by Country 2024 & 2032
- Figure 27: Asia Pacific Pipeline Integrity Management Industry Revenue Share (%), by Country 2024 & 2032
- Figure 28: Europe Pipeline Integrity Management Industry Revenue (Million), by Sector 2024 & 2032
- Figure 29: Europe Pipeline Integrity Management Industry Revenue Share (%), by Sector 2024 & 2032
- Figure 30: Europe Pipeline Integrity Management Industry Revenue (Million), by Location of Deployment 2024 & 2032
- Figure 31: Europe Pipeline Integrity Management Industry Revenue Share (%), by Location of Deployment 2024 & 2032
- Figure 32: Europe Pipeline Integrity Management Industry Revenue (Million), by Service Type 2024 & 2032
- Figure 33: Europe Pipeline Integrity Management Industry Revenue Share (%), by Service Type 2024 & 2032
- Figure 34: Europe Pipeline Integrity Management Industry Revenue (Million), by Country 2024 & 2032
- Figure 35: Europe Pipeline Integrity Management Industry Revenue Share (%), by Country 2024 & 2032
- Figure 36: Middle East and Africa Pipeline Integrity Management Industry Revenue (Million), by Sector 2024 & 2032
- Figure 37: Middle East and Africa Pipeline Integrity Management Industry Revenue Share (%), by Sector 2024 & 2032
- Figure 38: Middle East and Africa Pipeline Integrity Management Industry Revenue (Million), by Location of Deployment 2024 & 2032
- Figure 39: Middle East and Africa Pipeline Integrity Management Industry Revenue Share (%), by Location of Deployment 2024 & 2032
- Figure 40: Middle East and Africa Pipeline Integrity Management Industry Revenue (Million), by Service Type 2024 & 2032
- Figure 41: Middle East and Africa Pipeline Integrity Management Industry Revenue Share (%), by Service Type 2024 & 2032
- Figure 42: Middle East and Africa Pipeline Integrity Management Industry Revenue (Million), by Country 2024 & 2032
- Figure 43: Middle East and Africa Pipeline Integrity Management Industry Revenue Share (%), by Country 2024 & 2032
- Figure 44: South America Pipeline Integrity Management Industry Revenue (Million), by Sector 2024 & 2032
- Figure 45: South America Pipeline Integrity Management Industry Revenue Share (%), by Sector 2024 & 2032
- Figure 46: South America Pipeline Integrity Management Industry Revenue (Million), by Location of Deployment 2024 & 2032
- Figure 47: South America Pipeline Integrity Management Industry Revenue Share (%), by Location of Deployment 2024 & 2032
- Figure 48: South America Pipeline Integrity Management Industry Revenue (Million), by Service Type 2024 & 2032
- Figure 49: South America Pipeline Integrity Management Industry Revenue Share (%), by Service Type 2024 & 2032
- Figure 50: South America Pipeline Integrity Management Industry Revenue (Million), by Country 2024 & 2032
- Figure 51: South America Pipeline Integrity Management Industry Revenue Share (%), by Country 2024 & 2032
List of Tables
- Table 1: Global Pipeline Integrity Management Industry Revenue Million Forecast, by Region 2019 & 2032
- Table 2: Global Pipeline Integrity Management Industry Revenue Million Forecast, by Sector 2019 & 2032
- Table 3: Global Pipeline Integrity Management Industry Revenue Million Forecast, by Location of Deployment 2019 & 2032
- Table 4: Global Pipeline Integrity Management Industry Revenue Million Forecast, by Service Type 2019 & 2032
- Table 5: Global Pipeline Integrity Management Industry Revenue Million Forecast, by Region 2019 & 2032
- Table 6: Global Pipeline Integrity Management Industry Revenue Million Forecast, by Country 2019 & 2032
- Table 7: United States Pipeline Integrity Management Industry Revenue (Million) Forecast, by Application 2019 & 2032
- Table 8: Canada Pipeline Integrity Management Industry Revenue (Million) Forecast, by Application 2019 & 2032
- Table 9: Rest of North America Pipeline Integrity Management Industry Revenue (Million) Forecast, by Application 2019 & 2032
- Table 10: Global Pipeline Integrity Management Industry Revenue Million Forecast, by Country 2019 & 2032
- Table 11: China Pipeline Integrity Management Industry Revenue (Million) Forecast, by Application 2019 & 2032
- Table 12: India Pipeline Integrity Management Industry Revenue (Million) Forecast, by Application 2019 & 2032
- Table 13: Malaysia Pipeline Integrity Management Industry Revenue (Million) Forecast, by Application 2019 & 2032
- Table 14: Australia Pipeline Integrity Management Industry Revenue (Million) Forecast, by Application 2019 & 2032
- Table 15: Rest of Asia Pacific Pipeline Integrity Management Industry Revenue (Million) Forecast, by Application 2019 & 2032
- Table 16: Global Pipeline Integrity Management Industry Revenue Million Forecast, by Country 2019 & 2032
- Table 17: United Kingdom Pipeline Integrity Management Industry Revenue (Million) Forecast, by Application 2019 & 2032
- Table 18: Norway Pipeline Integrity Management Industry Revenue (Million) Forecast, by Application 2019 & 2032
- Table 19: Russia Pipeline Integrity Management Industry Revenue (Million) Forecast, by Application 2019 & 2032
- Table 20: Rest of Europe Pipeline Integrity Management Industry Revenue (Million) Forecast, by Application 2019 & 2032
- Table 21: Global Pipeline Integrity Management Industry Revenue Million Forecast, by Country 2019 & 2032
- Table 22: Saudi Arabia Pipeline Integrity Management Industry Revenue (Million) Forecast, by Application 2019 & 2032
- Table 23: United Arab Emirates Pipeline Integrity Management Industry Revenue (Million) Forecast, by Application 2019 & 2032
- Table 24: Nigeria Pipeline Integrity Management Industry Revenue (Million) Forecast, by Application 2019 & 2032
- Table 25: Rest of Middle East and Africa Pipeline Integrity Management Industry Revenue (Million) Forecast, by Application 2019 & 2032
- Table 26: Global Pipeline Integrity Management Industry Revenue Million Forecast, by Country 2019 & 2032
- Table 27: Brazil Pipeline Integrity Management Industry Revenue (Million) Forecast, by Application 2019 & 2032
- Table 28: Argentina Pipeline Integrity Management Industry Revenue (Million) Forecast, by Application 2019 & 2032
- Table 29: Rest of South America Pipeline Integrity Management Industry Revenue (Million) Forecast, by Application 2019 & 2032
- Table 30: Global Pipeline Integrity Management Industry Revenue Million Forecast, by Sector 2019 & 2032
- Table 31: Global Pipeline Integrity Management Industry Revenue Million Forecast, by Location of Deployment 2019 & 2032
- Table 32: Global Pipeline Integrity Management Industry Revenue Million Forecast, by Service Type 2019 & 2032
- Table 33: Global Pipeline Integrity Management Industry Revenue Million Forecast, by Country 2019 & 2032
- Table 34: United States Pipeline Integrity Management Industry Revenue (Million) Forecast, by Application 2019 & 2032
- Table 35: Canada Pipeline Integrity Management Industry Revenue (Million) Forecast, by Application 2019 & 2032
- Table 36: Rest of North America Pipeline Integrity Management Industry Revenue (Million) Forecast, by Application 2019 & 2032
- Table 37: Global Pipeline Integrity Management Industry Revenue Million Forecast, by Sector 2019 & 2032
- Table 38: Global Pipeline Integrity Management Industry Revenue Million Forecast, by Location of Deployment 2019 & 2032
- Table 39: Global Pipeline Integrity Management Industry Revenue Million Forecast, by Service Type 2019 & 2032
- Table 40: Global Pipeline Integrity Management Industry Revenue Million Forecast, by Country 2019 & 2032
- Table 41: China Pipeline Integrity Management Industry Revenue (Million) Forecast, by Application 2019 & 2032
- Table 42: India Pipeline Integrity Management Industry Revenue (Million) Forecast, by Application 2019 & 2032
- Table 43: Malaysia Pipeline Integrity Management Industry Revenue (Million) Forecast, by Application 2019 & 2032
- Table 44: Australia Pipeline Integrity Management Industry Revenue (Million) Forecast, by Application 2019 & 2032
- Table 45: Rest of Asia Pacific Pipeline Integrity Management Industry Revenue (Million) Forecast, by Application 2019 & 2032
- Table 46: Global Pipeline Integrity Management Industry Revenue Million Forecast, by Sector 2019 & 2032
- Table 47: Global Pipeline Integrity Management Industry Revenue Million Forecast, by Location of Deployment 2019 & 2032
- Table 48: Global Pipeline Integrity Management Industry Revenue Million Forecast, by Service Type 2019 & 2032
- Table 49: Global Pipeline Integrity Management Industry Revenue Million Forecast, by Country 2019 & 2032
- Table 50: United Kingdom Pipeline Integrity Management Industry Revenue (Million) Forecast, by Application 2019 & 2032
- Table 51: Norway Pipeline Integrity Management Industry Revenue (Million) Forecast, by Application 2019 & 2032
- Table 52: Russia Pipeline Integrity Management Industry Revenue (Million) Forecast, by Application 2019 & 2032
- Table 53: Rest of Europe Pipeline Integrity Management Industry Revenue (Million) Forecast, by Application 2019 & 2032
- Table 54: Global Pipeline Integrity Management Industry Revenue Million Forecast, by Sector 2019 & 2032
- Table 55: Global Pipeline Integrity Management Industry Revenue Million Forecast, by Location of Deployment 2019 & 2032
- Table 56: Global Pipeline Integrity Management Industry Revenue Million Forecast, by Service Type 2019 & 2032
- Table 57: Global Pipeline Integrity Management Industry Revenue Million Forecast, by Country 2019 & 2032
- Table 58: Saudi Arabia Pipeline Integrity Management Industry Revenue (Million) Forecast, by Application 2019 & 2032
- Table 59: United Arab Emirates Pipeline Integrity Management Industry Revenue (Million) Forecast, by Application 2019 & 2032
- Table 60: Nigeria Pipeline Integrity Management Industry Revenue (Million) Forecast, by Application 2019 & 2032
- Table 61: Rest of Middle East and Africa Pipeline Integrity Management Industry Revenue (Million) Forecast, by Application 2019 & 2032
- Table 62: Global Pipeline Integrity Management Industry Revenue Million Forecast, by Sector 2019 & 2032
- Table 63: Global Pipeline Integrity Management Industry Revenue Million Forecast, by Location of Deployment 2019 & 2032
- Table 64: Global Pipeline Integrity Management Industry Revenue Million Forecast, by Service Type 2019 & 2032
- Table 65: Global Pipeline Integrity Management Industry Revenue Million Forecast, by Country 2019 & 2032
- Table 66: Brazil Pipeline Integrity Management Industry Revenue (Million) Forecast, by Application 2019 & 2032
- Table 67: Argentina Pipeline Integrity Management Industry Revenue (Million) Forecast, by Application 2019 & 2032
- Table 68: Rest of South America Pipeline Integrity Management Industry Revenue (Million) Forecast, by Application 2019 & 2032
Frequently Asked Questions
1. What is the projected Compound Annual Growth Rate (CAGR) of the Pipeline Integrity Management Industry?
The projected CAGR is approximately 3.21%.
2. Which companies are prominent players in the Pipeline Integrity Management Industry?
Key companies in the market include Infosys Limited, TUV Rheinland, MATCOR Inc, Emerson Electric Co, TD Williamson Inc, SGS SA, TWI Ltd, Baker Hughes Company, EnerMech Limited, Bureau Veritas SA.
3. What are the main segments of the Pipeline Integrity Management Industry?
The market segments include Sector, Location of Deployment, Service Type.
4. Can you provide details about the market size?
The market size is estimated to be USD XX Million as of 2022.
5. What are some drivers contributing to market growth?
4.; Growing Vehicle Ownership4.; Government Initiatives.
6. What are the notable trends driving market growth?
Increasing Demand for Natural Gas Pipeline Infrastructure.
7. Are there any restraints impacting market growth?
4.; Volatile Crude Oil Prices.
8. Can you provide examples of recent developments in the market?
In November 2021, Schneider Electric, and Prisma Photonics, a provider of next-generation fiber sensing for smart infrastructure, announced a partnership to help oil and gas pipeline owners and operators prevent accidental and malicious activity by providing real-time intelligence and precise monitoring of oil and gas infrastructure.
9. What pricing options are available for accessing the report?
Pricing options include single-user, multi-user, and enterprise licenses priced at USD 4750, USD 5250, and USD 8750 respectively.
10. Is the market size provided in terms of value or volume?
The market size is provided in terms of value, measured in Million.
11. Are there any specific market keywords associated with the report?
Yes, the market keyword associated with the report is "Pipeline Integrity Management Industry," which aids in identifying and referencing the specific market segment covered.
12. How do I determine which pricing option suits my needs best?
The pricing options vary based on user requirements and access needs. Individual users may opt for single-user licenses, while businesses requiring broader access may choose multi-user or enterprise licenses for cost-effective access to the report.
13. Are there any additional resources or data provided in the Pipeline Integrity Management Industry report?
While the report offers comprehensive insights, it's advisable to review the specific contents or supplementary materials provided to ascertain if additional resources or data are available.
14. How can I stay updated on further developments or reports in the Pipeline Integrity Management Industry?
To stay informed about further developments, trends, and reports in the Pipeline Integrity Management Industry, consider subscribing to industry newsletters, following relevant companies and organizations, or regularly checking reputable industry news sources and publications.
Methodology
Step 1 - Identification of Relevant Samples Size from Population Database


Step 2 - Approaches for Defining Global Market Size (Value, Volume* & Price*)

Note*: In applicable scenarios
Step 3 - Data Sources
Primary Research
- Web Analytics
- Survey Reports
- Research Institute
- Latest Research Reports
- Opinion Leaders
Secondary Research
- Annual Reports
- White Paper
- Latest Press Release
- Industry Association
- Paid Database
- Investor Presentations

Step 4 - Data Triangulation
Involves using different sources of information in order to increase the validity of a study
These sources are likely to be stakeholders in a program - participants, other researchers, program staff, other community members, and so on.
Then we put all data in single framework & apply various statistical tools to find out the dynamic on the market.
During the analysis stage, feedback from the stakeholder groups would be compared to determine areas of agreement as well as areas of divergence


