
Key Insights
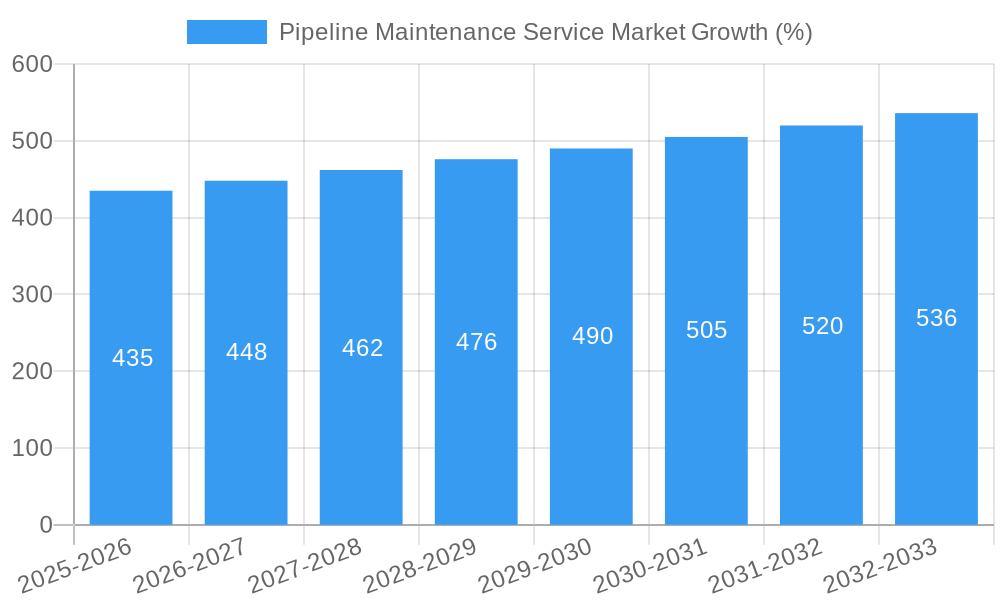
The global pipeline maintenance service market is experiencing robust growth, driven by the increasing demand for efficient and reliable pipeline infrastructure across various sectors, including oil and gas, chemicals, and water. The market's compound annual growth rate (CAGR) exceeding 2.80% signifies a steady expansion, projected to continue through 2033. Key drivers include stringent government regulations on pipeline safety and environmental protection, coupled with the aging infrastructure in many regions requiring significant maintenance and repair. Technological advancements, such as the adoption of advanced inspection techniques like smart pigs and robotic systems, are further boosting market growth by enabling more efficient and cost-effective maintenance solutions. The market is segmented by service type (pigging, flushing & chemical cleaning, pipeline repair & maintenance, drying, and others) and location of deployment (onshore and offshore), each exhibiting unique growth trajectories. Onshore segments currently dominate due to the greater concentration of pipeline networks, but offshore segments are expected to witness faster growth fueled by increasing offshore energy exploration and production activities. Competition is intense, with a mix of large multinational corporations and specialized service providers vying for market share. Geographic variations exist, with North America and Asia Pacific emerging as major markets, driven by robust energy demand and infrastructure development.
Despite the positive outlook, the market faces certain challenges. High initial investment costs for advanced maintenance technologies can hinder adoption, particularly for smaller operators. Fluctuations in oil and gas prices, as well as geopolitical uncertainties, can impact investment decisions and overall market growth. Furthermore, the skilled labor shortage in specialized pipeline maintenance roles presents a potential constraint on market expansion. To mitigate these challenges, companies are focusing on strategic partnerships, technological innovation, and workforce development initiatives. The overall outlook remains optimistic, with the market expected to reach significant value by 2033, driven by continuous infrastructure development, regulatory compliance, and technological advancements improving efficiency and safety across the pipeline industry.
Pipeline Maintenance Service Market: A Comprehensive Report (2019-2033)
This in-depth report provides a comprehensive analysis of the global Pipeline Maintenance Service Market, offering invaluable insights for industry professionals, investors, and strategic decision-makers. Covering the period from 2019 to 2033, with a focus on 2025, this report meticulously examines market dynamics, key players, technological advancements, and future growth projections. The market is segmented by service type (Pigging, Flushing & Chemical Cleaning, Pipeline Repair & Maintenance, Drying, Others) and location of deployment (Onshore, Offshore). The total market size is projected to reach xx Million by 2033.
Pipeline Maintenance Service Market Market Structure & Innovation Trends
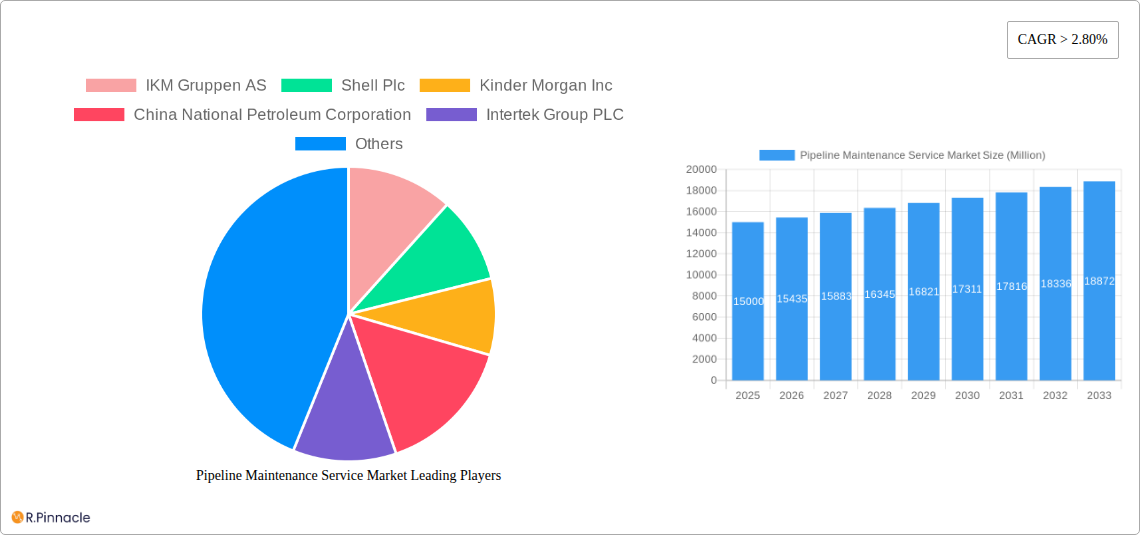
This section analyzes the competitive landscape, innovation drivers, and regulatory aspects shaping the Pipeline Maintenance Service Market. The market exhibits a moderately concentrated structure, with key players like IKM Gruppen AS, Shell Plc, Kinder Morgan Inc, and China National Petroleum Corporation holding significant market share. However, the presence of numerous smaller, specialized providers creates a dynamic and competitive environment.
- Market Concentration: The market share of the top 5 players is estimated to be around xx%, indicating a moderately concentrated market. Smaller players focus on niche services and geographic regions, driving competition.
- Innovation Drivers: Technological advancements in inspection technologies (e.g., smart pigs, drones), robotic solutions for pipeline repair, and data analytics for predictive maintenance are key innovation drivers. Stringent environmental regulations and the need for enhanced safety are also propelling innovation.
- Regulatory Frameworks: Government regulations on pipeline safety, environmental protection, and operational efficiency significantly impact market dynamics. These regulations often mandate specific maintenance practices and technologies, influencing market demand.
- Product Substitutes: While direct substitutes are limited, alternative approaches like pipeline replacement might be considered in certain cases, depending on cost-benefit analyses.
- End-User Demographics: The key end-users are pipeline operators (including BP Plc, ExxonMobil Corporation, and others), and pipeline maintenance service providers. The market’s growth depends heavily on the investments and activities of these operators and service providers.
- M&A Activities: The market has witnessed several mergers and acquisitions in recent years, with deal values ranging from xx Million to xx Million. These activities reflect industry consolidation and the pursuit of economies of scale.
Pipeline Maintenance Service Market Market Dynamics & Trends
The Pipeline Maintenance Service Market is experiencing robust growth, driven by several factors. The aging pipeline infrastructure globally requires significant maintenance and upgrades, creating substantial demand. Moreover, the increasing adoption of stringent safety regulations and a growing focus on environmental protection necessitate robust pipeline maintenance programs.
The market's CAGR is projected to be xx% during the forecast period (2025-2033), with market penetration increasing steadily. Technological advancements, such as the implementation of advanced inspection technologies and robotic systems, are contributing significantly to market growth. Consumer preferences are shifting towards solutions that offer improved efficiency, reduced downtime, and enhanced safety. Competitive dynamics are intense, with players differentiating themselves through technological innovation, service offerings, and geographical reach.
Dominant Regions & Segments in Pipeline Maintenance Service Market
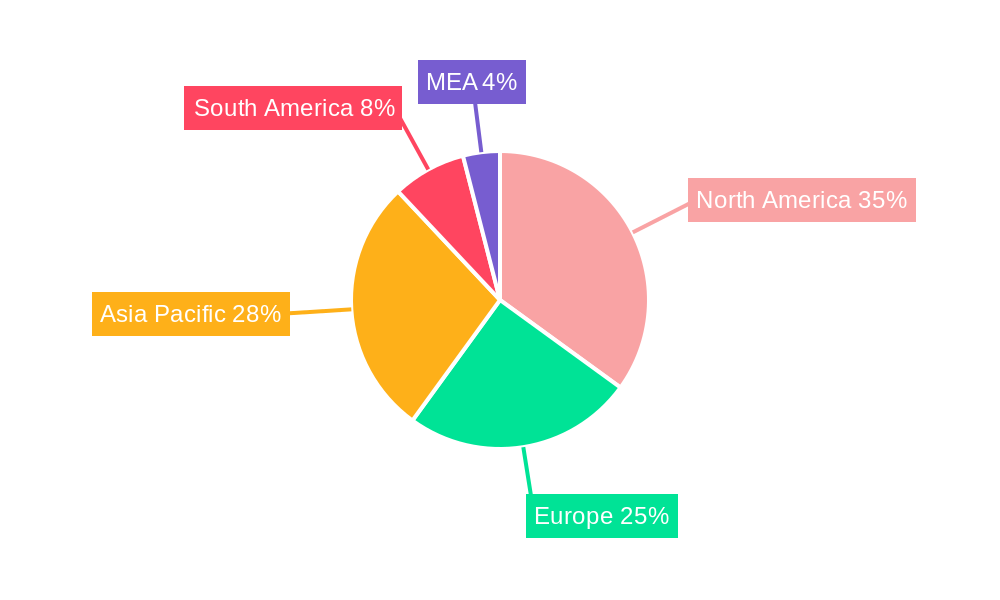
The North American region currently dominates the Pipeline Maintenance Service Market, driven by extensive pipeline networks and substantial investments in infrastructure modernization. However, the Asia-Pacific region is anticipated to witness the fastest growth in the coming years, fueled by rapid industrialization and expanding energy infrastructure.
Dominant Segments:
- Service Type: Pipeline Repair & Maintenance is the largest segment, followed by Pigging, Flushing & Chemical Cleaning. The "Others" category includes specialized services that are experiencing growth due to the increasing need for specific maintenance practices.
- Location of Deployment: Onshore segment dominates due to the wider extent of onshore pipelines. Offshore segment is showing growth potential due to increasing offshore exploration and production activities.
Key Drivers for Dominant Regions:
- North America: Strong regulatory frameworks, significant investments in pipeline infrastructure upgrades, and the presence of major pipeline operators.
- Asia-Pacific: Rapid industrialization, growing energy demand, and substantial government investments in energy infrastructure projects.
Pipeline Maintenance Service Market Product Innovations
Recent product innovations include the development of smart pigs with advanced sensor technologies for enhanced pipeline inspection, robotic systems for autonomous pipeline repair, and data analytics platforms for predictive maintenance. These innovations offer significant improvements in efficiency, safety, and cost-effectiveness, catering to the evolving needs of pipeline operators and driving market growth. The focus is on solutions that minimize downtime, reduce environmental impact, and improve operational safety.
Report Scope & Segmentation Analysis
This report provides a comprehensive analysis of the Pipeline Maintenance Service Market, segmented by service type (Pigging, Flushing & Chemical Cleaning, Pipeline Repair & Maintenance, Drying, Others) and location of deployment (Onshore, Offshore). Each segment's growth projections, market sizes, and competitive dynamics are thoroughly analyzed. Market size is estimated based on revenue generated by various service types and deployment locations. The report also considers the impact of technological advancements and regulatory changes on each segment.
Key Drivers of Pipeline Maintenance Service Market Growth
The Pipeline Maintenance Service Market's growth is fueled by several key factors. The aging pipeline infrastructure worldwide necessitates substantial maintenance investments. Stringent regulatory requirements emphasize safety and environmental protection, driving demand for advanced maintenance services. Moreover, technological advancements, including smart pigs, robotic solutions, and data analytics, enhance efficiency and reduce downtime, further boosting market growth.
Challenges in the Pipeline Maintenance Service Market Sector
The Pipeline Maintenance Service Market faces challenges such as fluctuating oil and gas prices, impacting investment decisions. Supply chain disruptions can lead to delays and increased costs. Furthermore, intense competition among service providers necessitates continuous innovation and cost optimization strategies. Strict safety and environmental regulations add complexity and compliance costs, posing a challenge for many businesses.
Emerging Opportunities in Pipeline Maintenance Service Market
Emerging opportunities include the growing adoption of digital technologies for predictive maintenance, expanding into new geographic markets with developing pipeline infrastructure, and providing specialized services catering to niche industry segments. There’s also potential in developing eco-friendly and sustainable pipeline maintenance solutions, meeting the increasing focus on environmental concerns.
Leading Players in the Pipeline Maintenance Service Market Market
- IKM Gruppen AS
- Shell Plc (Shell Plc)
- Kinder Morgan Inc (Kinder Morgan Inc)
- China National Petroleum Corporation
- Intertek Group PLC (Intertek Group PLC)
- T D Williamson Inc
- Chevron Corporation (Chevron Corporation)
- Oil States Industries Inc
- EnerMech Ltd
- STATS Group
- Pipeline Operators
- BP Plc (BP Plc)
- Dacon Inspection Services Co Ltd
- Baker Hughes A GE Co (Baker Hughes A GE Co)
- ExxonMobil Corporation (ExxonMobil Corporation)
- Pipeline Maintenance Services Providers
Key Developments in Pipeline Maintenance Service Market Industry
- October 2021: Optilan completes the first year of operation on the BTC pipeline project, showcasing advancements in pipeline management systems. This highlights the increasing adoption of technology solutions within the industry.
- October 2020: Stork secures a five-year pipeline maintenance contract in Peru, demonstrating the significant demand for comprehensive pipeline maintenance services in emerging markets.
- November 2020: CenterPoint Energy's $240 Million investment in pipeline modernization underscores the substantial capital expenditure directed towards upgrading aging infrastructure, driving opportunities in the maintenance sector.
Future Outlook for Pipeline Maintenance Service Market Market
The Pipeline Maintenance Service Market is poised for continued growth, driven by increasing investments in pipeline infrastructure, stringent regulatory requirements, and technological advancements. The adoption of predictive maintenance techniques, smart technologies, and specialized services will shape the future market landscape. Companies that embrace innovation and adapt to evolving industry demands are well-positioned to capitalize on emerging growth opportunities.
Pipeline Maintenance Service Market Segmentation
-
1. Service Type
- 1.1. Pigging
- 1.2. Flushing & Chemical Cleaning
- 1.3. Pipeline Repair & Maintenance
- 1.4. Drying
- 1.5. Others
-
2. Location of Deployment
- 2.1. Onshore
- 2.2. Offshore
Pipeline Maintenance Service Market Segmentation By Geography
- 1. North America
- 2. Europe
- 3. Asia Pacific
- 4. South America
- 5. Middle East and Africa
Pipeline Maintenance Service Market REPORT HIGHLIGHTS
| Aspects | Details |
|---|---|
| Study Period | 2019-2033 |
| Base Year | 2024 |
| Estimated Year | 2025 |
| Forecast Period | 2025-2033 |
| Historical Period | 2019-2024 |
| Growth Rate | CAGR of > 2.80% from 2019-2033 |
| Segmentation |
|
Table of Contents
- 1. Introduction
- 1.1. Research Scope
- 1.2. Market Segmentation
- 1.3. Research Methodology
- 1.4. Definitions and Assumptions
- 2. Executive Summary
- 2.1. Introduction
- 3. Market Dynamics
- 3.1. Introduction
- 3.2. Market Drivers
- 3.2.1. 4.; Increasing Gas Production and Infrastructure4.; Increasing Exploration and Production Activities
- 3.3. Market Restrains
- 3.3.1. 4.; Increasing Adoption of Clean Power Sources
- 3.4. Market Trends
- 3.4.1. Pipeline Repair & Maintenance Segment to have a Significant Share in the Market
- 4. Market Factor Analysis
- 4.1. Porters Five Forces
- 4.2. Supply/Value Chain
- 4.3. PESTEL analysis
- 4.4. Market Entropy
- 4.5. Patent/Trademark Analysis
- 5. Global Pipeline Maintenance Service Market Analysis, Insights and Forecast, 2019-2031
- 5.1. Market Analysis, Insights and Forecast - by Service Type
- 5.1.1. Pigging
- 5.1.2. Flushing & Chemical Cleaning
- 5.1.3. Pipeline Repair & Maintenance
- 5.1.4. Drying
- 5.1.5. Others
- 5.2. Market Analysis, Insights and Forecast - by Location of Deployment
- 5.2.1. Onshore
- 5.2.2. Offshore
- 5.3. Market Analysis, Insights and Forecast - by Region
- 5.3.1. North America
- 5.3.2. Europe
- 5.3.3. Asia Pacific
- 5.3.4. South America
- 5.3.5. Middle East and Africa
- 5.1. Market Analysis, Insights and Forecast - by Service Type
- 6. North America Pipeline Maintenance Service Market Analysis, Insights and Forecast, 2019-2031
- 6.1. Market Analysis, Insights and Forecast - by Service Type
- 6.1.1. Pigging
- 6.1.2. Flushing & Chemical Cleaning
- 6.1.3. Pipeline Repair & Maintenance
- 6.1.4. Drying
- 6.1.5. Others
- 6.2. Market Analysis, Insights and Forecast - by Location of Deployment
- 6.2.1. Onshore
- 6.2.2. Offshore
- 6.1. Market Analysis, Insights and Forecast - by Service Type
- 7. Europe Pipeline Maintenance Service Market Analysis, Insights and Forecast, 2019-2031
- 7.1. Market Analysis, Insights and Forecast - by Service Type
- 7.1.1. Pigging
- 7.1.2. Flushing & Chemical Cleaning
- 7.1.3. Pipeline Repair & Maintenance
- 7.1.4. Drying
- 7.1.5. Others
- 7.2. Market Analysis, Insights and Forecast - by Location of Deployment
- 7.2.1. Onshore
- 7.2.2. Offshore
- 7.1. Market Analysis, Insights and Forecast - by Service Type
- 8. Asia Pacific Pipeline Maintenance Service Market Analysis, Insights and Forecast, 2019-2031
- 8.1. Market Analysis, Insights and Forecast - by Service Type
- 8.1.1. Pigging
- 8.1.2. Flushing & Chemical Cleaning
- 8.1.3. Pipeline Repair & Maintenance
- 8.1.4. Drying
- 8.1.5. Others
- 8.2. Market Analysis, Insights and Forecast - by Location of Deployment
- 8.2.1. Onshore
- 8.2.2. Offshore
- 8.1. Market Analysis, Insights and Forecast - by Service Type
- 9. South America Pipeline Maintenance Service Market Analysis, Insights and Forecast, 2019-2031
- 9.1. Market Analysis, Insights and Forecast - by Service Type
- 9.1.1. Pigging
- 9.1.2. Flushing & Chemical Cleaning
- 9.1.3. Pipeline Repair & Maintenance
- 9.1.4. Drying
- 9.1.5. Others
- 9.2. Market Analysis, Insights and Forecast - by Location of Deployment
- 9.2.1. Onshore
- 9.2.2. Offshore
- 9.1. Market Analysis, Insights and Forecast - by Service Type
- 10. Middle East and Africa Pipeline Maintenance Service Market Analysis, Insights and Forecast, 2019-2031
- 10.1. Market Analysis, Insights and Forecast - by Service Type
- 10.1.1. Pigging
- 10.1.2. Flushing & Chemical Cleaning
- 10.1.3. Pipeline Repair & Maintenance
- 10.1.4. Drying
- 10.1.5. Others
- 10.2. Market Analysis, Insights and Forecast - by Location of Deployment
- 10.2.1. Onshore
- 10.2.2. Offshore
- 10.1. Market Analysis, Insights and Forecast - by Service Type
- 11. North America Pipeline Maintenance Service Market Analysis, Insights and Forecast, 2019-2031
- 11.1. Market Analysis, Insights and Forecast - By Country/Sub-region
- 11.1.1 United States
- 11.1.2 Canada
- 11.1.3 Mexico
- 12. Europe Pipeline Maintenance Service Market Analysis, Insights and Forecast, 2019-2031
- 12.1. Market Analysis, Insights and Forecast - By Country/Sub-region
- 12.1.1 Germany
- 12.1.2 United Kingdom
- 12.1.3 France
- 12.1.4 Spain
- 12.1.5 Italy
- 12.1.6 Spain
- 12.1.7 Belgium
- 12.1.8 Netherland
- 12.1.9 Nordics
- 12.1.10 Rest of Europe
- 13. Asia Pacific Pipeline Maintenance Service Market Analysis, Insights and Forecast, 2019-2031
- 13.1. Market Analysis, Insights and Forecast - By Country/Sub-region
- 13.1.1 China
- 13.1.2 Japan
- 13.1.3 India
- 13.1.4 South Korea
- 13.1.5 Southeast Asia
- 13.1.6 Australia
- 13.1.7 Indonesia
- 13.1.8 Phillipes
- 13.1.9 Singapore
- 13.1.10 Thailandc
- 13.1.11 Rest of Asia Pacific
- 14. South America Pipeline Maintenance Service Market Analysis, Insights and Forecast, 2019-2031
- 14.1. Market Analysis, Insights and Forecast - By Country/Sub-region
- 14.1.1 Brazil
- 14.1.2 Argentina
- 14.1.3 Peru
- 14.1.4 Chile
- 14.1.5 Colombia
- 14.1.6 Ecuador
- 14.1.7 Venezuela
- 14.1.8 Rest of South America
- 15. North America Pipeline Maintenance Service Market Analysis, Insights and Forecast, 2019-2031
- 15.1. Market Analysis, Insights and Forecast - By Country/Sub-region
- 15.1.1 United States
- 15.1.2 Canada
- 15.1.3 Mexico
- 16. MEA Pipeline Maintenance Service Market Analysis, Insights and Forecast, 2019-2031
- 16.1. Market Analysis, Insights and Forecast - By Country/Sub-region
- 16.1.1 United Arab Emirates
- 16.1.2 Saudi Arabia
- 16.1.3 South Africa
- 16.1.4 Rest of Middle East and Africa
- 17. Competitive Analysis
- 17.1. Global Market Share Analysis 2024
- 17.2. Company Profiles
- 17.2.1 IKM Gruppen AS
- 17.2.1.1. Overview
- 17.2.1.2. Products
- 17.2.1.3. SWOT Analysis
- 17.2.1.4. Recent Developments
- 17.2.1.5. Financials (Based on Availability)
- 17.2.2 Shell Plc
- 17.2.2.1. Overview
- 17.2.2.2. Products
- 17.2.2.3. SWOT Analysis
- 17.2.2.4. Recent Developments
- 17.2.2.5. Financials (Based on Availability)
- 17.2.3 Kinder Morgan Inc
- 17.2.3.1. Overview
- 17.2.3.2. Products
- 17.2.3.3. SWOT Analysis
- 17.2.3.4. Recent Developments
- 17.2.3.5. Financials (Based on Availability)
- 17.2.4 China National Petroleum Corporation
- 17.2.4.1. Overview
- 17.2.4.2. Products
- 17.2.4.3. SWOT Analysis
- 17.2.4.4. Recent Developments
- 17.2.4.5. Financials (Based on Availability)
- 17.2.5 Intertek Group PLC
- 17.2.5.1. Overview
- 17.2.5.2. Products
- 17.2.5.3. SWOT Analysis
- 17.2.5.4. Recent Developments
- 17.2.5.5. Financials (Based on Availability)
- 17.2.6 T D Williamson Inc
- 17.2.6.1. Overview
- 17.2.6.2. Products
- 17.2.6.3. SWOT Analysis
- 17.2.6.4. Recent Developments
- 17.2.6.5. Financials (Based on Availability)
- 17.2.7 Chevron Corporation
- 17.2.7.1. Overview
- 17.2.7.2. Products
- 17.2.7.3. SWOT Analysis
- 17.2.7.4. Recent Developments
- 17.2.7.5. Financials (Based on Availability)
- 17.2.8 Oil States Industries Inc
- 17.2.8.1. Overview
- 17.2.8.2. Products
- 17.2.8.3. SWOT Analysis
- 17.2.8.4. Recent Developments
- 17.2.8.5. Financials (Based on Availability)
- 17.2.9 EnerMech Ltd
- 17.2.9.1. Overview
- 17.2.9.2. Products
- 17.2.9.3. SWOT Analysis
- 17.2.9.4. Recent Developments
- 17.2.9.5. Financials (Based on Availability)
- 17.2.10 STATS Group
- 17.2.10.1. Overview
- 17.2.10.2. Products
- 17.2.10.3. SWOT Analysis
- 17.2.10.4. Recent Developments
- 17.2.10.5. Financials (Based on Availability)
- 17.2.11 Pipeline Operators
- 17.2.11.1. Overview
- 17.2.11.2. Products
- 17.2.11.3. SWOT Analysis
- 17.2.11.4. Recent Developments
- 17.2.11.5. Financials (Based on Availability)
- 17.2.12 BP Plc
- 17.2.12.1. Overview
- 17.2.12.2. Products
- 17.2.12.3. SWOT Analysis
- 17.2.12.4. Recent Developments
- 17.2.12.5. Financials (Based on Availability)
- 17.2.13 Dacon Inspection Services Co Ltd
- 17.2.13.1. Overview
- 17.2.13.2. Products
- 17.2.13.3. SWOT Analysis
- 17.2.13.4. Recent Developments
- 17.2.13.5. Financials (Based on Availability)
- 17.2.14 Baker Hughes A GE Co
- 17.2.14.1. Overview
- 17.2.14.2. Products
- 17.2.14.3. SWOT Analysis
- 17.2.14.4. Recent Developments
- 17.2.14.5. Financials (Based on Availability)
- 17.2.15 ExxonMobil Corporation
- 17.2.15.1. Overview
- 17.2.15.2. Products
- 17.2.15.3. SWOT Analysis
- 17.2.15.4. Recent Developments
- 17.2.15.5. Financials (Based on Availability)
- 17.2.16 Pipeline Maintenance Services Providers
- 17.2.16.1. Overview
- 17.2.16.2. Products
- 17.2.16.3. SWOT Analysis
- 17.2.16.4. Recent Developments
- 17.2.16.5. Financials (Based on Availability)
- 17.2.1 IKM Gruppen AS
List of Figures
- Figure 1: Global Pipeline Maintenance Service Market Revenue Breakdown (Million, %) by Region 2024 & 2032
- Figure 2: North America Pipeline Maintenance Service Market Revenue (Million), by Country 2024 & 2032
- Figure 3: North America Pipeline Maintenance Service Market Revenue Share (%), by Country 2024 & 2032
- Figure 4: Europe Pipeline Maintenance Service Market Revenue (Million), by Country 2024 & 2032
- Figure 5: Europe Pipeline Maintenance Service Market Revenue Share (%), by Country 2024 & 2032
- Figure 6: Asia Pacific Pipeline Maintenance Service Market Revenue (Million), by Country 2024 & 2032
- Figure 7: Asia Pacific Pipeline Maintenance Service Market Revenue Share (%), by Country 2024 & 2032
- Figure 8: South America Pipeline Maintenance Service Market Revenue (Million), by Country 2024 & 2032
- Figure 9: South America Pipeline Maintenance Service Market Revenue Share (%), by Country 2024 & 2032
- Figure 10: North America Pipeline Maintenance Service Market Revenue (Million), by Country 2024 & 2032
- Figure 11: North America Pipeline Maintenance Service Market Revenue Share (%), by Country 2024 & 2032
- Figure 12: MEA Pipeline Maintenance Service Market Revenue (Million), by Country 2024 & 2032
- Figure 13: MEA Pipeline Maintenance Service Market Revenue Share (%), by Country 2024 & 2032
- Figure 14: North America Pipeline Maintenance Service Market Revenue (Million), by Service Type 2024 & 2032
- Figure 15: North America Pipeline Maintenance Service Market Revenue Share (%), by Service Type 2024 & 2032
- Figure 16: North America Pipeline Maintenance Service Market Revenue (Million), by Location of Deployment 2024 & 2032
- Figure 17: North America Pipeline Maintenance Service Market Revenue Share (%), by Location of Deployment 2024 & 2032
- Figure 18: North America Pipeline Maintenance Service Market Revenue (Million), by Country 2024 & 2032
- Figure 19: North America Pipeline Maintenance Service Market Revenue Share (%), by Country 2024 & 2032
- Figure 20: Europe Pipeline Maintenance Service Market Revenue (Million), by Service Type 2024 & 2032
- Figure 21: Europe Pipeline Maintenance Service Market Revenue Share (%), by Service Type 2024 & 2032
- Figure 22: Europe Pipeline Maintenance Service Market Revenue (Million), by Location of Deployment 2024 & 2032
- Figure 23: Europe Pipeline Maintenance Service Market Revenue Share (%), by Location of Deployment 2024 & 2032
- Figure 24: Europe Pipeline Maintenance Service Market Revenue (Million), by Country 2024 & 2032
- Figure 25: Europe Pipeline Maintenance Service Market Revenue Share (%), by Country 2024 & 2032
- Figure 26: Asia Pacific Pipeline Maintenance Service Market Revenue (Million), by Service Type 2024 & 2032
- Figure 27: Asia Pacific Pipeline Maintenance Service Market Revenue Share (%), by Service Type 2024 & 2032
- Figure 28: Asia Pacific Pipeline Maintenance Service Market Revenue (Million), by Location of Deployment 2024 & 2032
- Figure 29: Asia Pacific Pipeline Maintenance Service Market Revenue Share (%), by Location of Deployment 2024 & 2032
- Figure 30: Asia Pacific Pipeline Maintenance Service Market Revenue (Million), by Country 2024 & 2032
- Figure 31: Asia Pacific Pipeline Maintenance Service Market Revenue Share (%), by Country 2024 & 2032
- Figure 32: South America Pipeline Maintenance Service Market Revenue (Million), by Service Type 2024 & 2032
- Figure 33: South America Pipeline Maintenance Service Market Revenue Share (%), by Service Type 2024 & 2032
- Figure 34: South America Pipeline Maintenance Service Market Revenue (Million), by Location of Deployment 2024 & 2032
- Figure 35: South America Pipeline Maintenance Service Market Revenue Share (%), by Location of Deployment 2024 & 2032
- Figure 36: South America Pipeline Maintenance Service Market Revenue (Million), by Country 2024 & 2032
- Figure 37: South America Pipeline Maintenance Service Market Revenue Share (%), by Country 2024 & 2032
- Figure 38: Middle East and Africa Pipeline Maintenance Service Market Revenue (Million), by Service Type 2024 & 2032
- Figure 39: Middle East and Africa Pipeline Maintenance Service Market Revenue Share (%), by Service Type 2024 & 2032
- Figure 40: Middle East and Africa Pipeline Maintenance Service Market Revenue (Million), by Location of Deployment 2024 & 2032
- Figure 41: Middle East and Africa Pipeline Maintenance Service Market Revenue Share (%), by Location of Deployment 2024 & 2032
- Figure 42: Middle East and Africa Pipeline Maintenance Service Market Revenue (Million), by Country 2024 & 2032
- Figure 43: Middle East and Africa Pipeline Maintenance Service Market Revenue Share (%), by Country 2024 & 2032
List of Tables
- Table 1: Global Pipeline Maintenance Service Market Revenue Million Forecast, by Region 2019 & 2032
- Table 2: Global Pipeline Maintenance Service Market Revenue Million Forecast, by Service Type 2019 & 2032
- Table 3: Global Pipeline Maintenance Service Market Revenue Million Forecast, by Location of Deployment 2019 & 2032
- Table 4: Global Pipeline Maintenance Service Market Revenue Million Forecast, by Region 2019 & 2032
- Table 5: Global Pipeline Maintenance Service Market Revenue Million Forecast, by Country 2019 & 2032
- Table 6: United States Pipeline Maintenance Service Market Revenue (Million) Forecast, by Application 2019 & 2032
- Table 7: Canada Pipeline Maintenance Service Market Revenue (Million) Forecast, by Application 2019 & 2032
- Table 8: Mexico Pipeline Maintenance Service Market Revenue (Million) Forecast, by Application 2019 & 2032
- Table 9: Global Pipeline Maintenance Service Market Revenue Million Forecast, by Country 2019 & 2032
- Table 10: Germany Pipeline Maintenance Service Market Revenue (Million) Forecast, by Application 2019 & 2032
- Table 11: United Kingdom Pipeline Maintenance Service Market Revenue (Million) Forecast, by Application 2019 & 2032
- Table 12: France Pipeline Maintenance Service Market Revenue (Million) Forecast, by Application 2019 & 2032
- Table 13: Spain Pipeline Maintenance Service Market Revenue (Million) Forecast, by Application 2019 & 2032
- Table 14: Italy Pipeline Maintenance Service Market Revenue (Million) Forecast, by Application 2019 & 2032
- Table 15: Spain Pipeline Maintenance Service Market Revenue (Million) Forecast, by Application 2019 & 2032
- Table 16: Belgium Pipeline Maintenance Service Market Revenue (Million) Forecast, by Application 2019 & 2032
- Table 17: Netherland Pipeline Maintenance Service Market Revenue (Million) Forecast, by Application 2019 & 2032
- Table 18: Nordics Pipeline Maintenance Service Market Revenue (Million) Forecast, by Application 2019 & 2032
- Table 19: Rest of Europe Pipeline Maintenance Service Market Revenue (Million) Forecast, by Application 2019 & 2032
- Table 20: Global Pipeline Maintenance Service Market Revenue Million Forecast, by Country 2019 & 2032
- Table 21: China Pipeline Maintenance Service Market Revenue (Million) Forecast, by Application 2019 & 2032
- Table 22: Japan Pipeline Maintenance Service Market Revenue (Million) Forecast, by Application 2019 & 2032
- Table 23: India Pipeline Maintenance Service Market Revenue (Million) Forecast, by Application 2019 & 2032
- Table 24: South Korea Pipeline Maintenance Service Market Revenue (Million) Forecast, by Application 2019 & 2032
- Table 25: Southeast Asia Pipeline Maintenance Service Market Revenue (Million) Forecast, by Application 2019 & 2032
- Table 26: Australia Pipeline Maintenance Service Market Revenue (Million) Forecast, by Application 2019 & 2032
- Table 27: Indonesia Pipeline Maintenance Service Market Revenue (Million) Forecast, by Application 2019 & 2032
- Table 28: Phillipes Pipeline Maintenance Service Market Revenue (Million) Forecast, by Application 2019 & 2032
- Table 29: Singapore Pipeline Maintenance Service Market Revenue (Million) Forecast, by Application 2019 & 2032
- Table 30: Thailandc Pipeline Maintenance Service Market Revenue (Million) Forecast, by Application 2019 & 2032
- Table 31: Rest of Asia Pacific Pipeline Maintenance Service Market Revenue (Million) Forecast, by Application 2019 & 2032
- Table 32: Global Pipeline Maintenance Service Market Revenue Million Forecast, by Country 2019 & 2032
- Table 33: Brazil Pipeline Maintenance Service Market Revenue (Million) Forecast, by Application 2019 & 2032
- Table 34: Argentina Pipeline Maintenance Service Market Revenue (Million) Forecast, by Application 2019 & 2032
- Table 35: Peru Pipeline Maintenance Service Market Revenue (Million) Forecast, by Application 2019 & 2032
- Table 36: Chile Pipeline Maintenance Service Market Revenue (Million) Forecast, by Application 2019 & 2032
- Table 37: Colombia Pipeline Maintenance Service Market Revenue (Million) Forecast, by Application 2019 & 2032
- Table 38: Ecuador Pipeline Maintenance Service Market Revenue (Million) Forecast, by Application 2019 & 2032
- Table 39: Venezuela Pipeline Maintenance Service Market Revenue (Million) Forecast, by Application 2019 & 2032
- Table 40: Rest of South America Pipeline Maintenance Service Market Revenue (Million) Forecast, by Application 2019 & 2032
- Table 41: Global Pipeline Maintenance Service Market Revenue Million Forecast, by Country 2019 & 2032
- Table 42: United States Pipeline Maintenance Service Market Revenue (Million) Forecast, by Application 2019 & 2032
- Table 43: Canada Pipeline Maintenance Service Market Revenue (Million) Forecast, by Application 2019 & 2032
- Table 44: Mexico Pipeline Maintenance Service Market Revenue (Million) Forecast, by Application 2019 & 2032
- Table 45: Global Pipeline Maintenance Service Market Revenue Million Forecast, by Country 2019 & 2032
- Table 46: United Arab Emirates Pipeline Maintenance Service Market Revenue (Million) Forecast, by Application 2019 & 2032
- Table 47: Saudi Arabia Pipeline Maintenance Service Market Revenue (Million) Forecast, by Application 2019 & 2032
- Table 48: South Africa Pipeline Maintenance Service Market Revenue (Million) Forecast, by Application 2019 & 2032
- Table 49: Rest of Middle East and Africa Pipeline Maintenance Service Market Revenue (Million) Forecast, by Application 2019 & 2032
- Table 50: Global Pipeline Maintenance Service Market Revenue Million Forecast, by Service Type 2019 & 2032
- Table 51: Global Pipeline Maintenance Service Market Revenue Million Forecast, by Location of Deployment 2019 & 2032
- Table 52: Global Pipeline Maintenance Service Market Revenue Million Forecast, by Country 2019 & 2032
- Table 53: Global Pipeline Maintenance Service Market Revenue Million Forecast, by Service Type 2019 & 2032
- Table 54: Global Pipeline Maintenance Service Market Revenue Million Forecast, by Location of Deployment 2019 & 2032
- Table 55: Global Pipeline Maintenance Service Market Revenue Million Forecast, by Country 2019 & 2032
- Table 56: Global Pipeline Maintenance Service Market Revenue Million Forecast, by Service Type 2019 & 2032
- Table 57: Global Pipeline Maintenance Service Market Revenue Million Forecast, by Location of Deployment 2019 & 2032
- Table 58: Global Pipeline Maintenance Service Market Revenue Million Forecast, by Country 2019 & 2032
- Table 59: Global Pipeline Maintenance Service Market Revenue Million Forecast, by Service Type 2019 & 2032
- Table 60: Global Pipeline Maintenance Service Market Revenue Million Forecast, by Location of Deployment 2019 & 2032
- Table 61: Global Pipeline Maintenance Service Market Revenue Million Forecast, by Country 2019 & 2032
- Table 62: Global Pipeline Maintenance Service Market Revenue Million Forecast, by Service Type 2019 & 2032
- Table 63: Global Pipeline Maintenance Service Market Revenue Million Forecast, by Location of Deployment 2019 & 2032
- Table 64: Global Pipeline Maintenance Service Market Revenue Million Forecast, by Country 2019 & 2032
Frequently Asked Questions
1. What is the projected Compound Annual Growth Rate (CAGR) of the Pipeline Maintenance Service Market?
The projected CAGR is approximately > 2.80%.
2. Which companies are prominent players in the Pipeline Maintenance Service Market?
Key companies in the market include IKM Gruppen AS, Shell Plc, Kinder Morgan Inc, China National Petroleum Corporation, Intertek Group PLC, T D Williamson Inc, Chevron Corporation, Oil States Industries Inc, EnerMech Ltd, STATS Group, Pipeline Operators, BP Plc, Dacon Inspection Services Co Ltd, Baker Hughes A GE Co, ExxonMobil Corporation, Pipeline Maintenance Services Providers.
3. What are the main segments of the Pipeline Maintenance Service Market?
The market segments include Service Type, Location of Deployment.
4. Can you provide details about the market size?
The market size is estimated to be USD XX Million as of 2022.
5. What are some drivers contributing to market growth?
4.; Increasing Gas Production and Infrastructure4.; Increasing Exploration and Production Activities.
6. What are the notable trends driving market growth?
Pipeline Repair & Maintenance Segment to have a Significant Share in the Market.
7. Are there any restraints impacting market growth?
4.; Increasing Adoption of Clean Power Sources.
8. Can you provide examples of recent developments in the market?
In October 2021, Optilan, a leading telecommunications and security systems integrator, announced completion of the first year of operation on the BTC pipeline project. The company reavelaed that out of the 14 completed projects, six projects were new pipelines, five projects were expansions of existing systems, two projects reversed the direction that the commodity flowed on the pipeline and one project was a change in the commodity carried by the pipeline.
9. What pricing options are available for accessing the report?
Pricing options include single-user, multi-user, and enterprise licenses priced at USD 4750, USD 5250, and USD 8750 respectively.
10. Is the market size provided in terms of value or volume?
The market size is provided in terms of value, measured in Million.
11. Are there any specific market keywords associated with the report?
Yes, the market keyword associated with the report is "Pipeline Maintenance Service Market," which aids in identifying and referencing the specific market segment covered.
12. How do I determine which pricing option suits my needs best?
The pricing options vary based on user requirements and access needs. Individual users may opt for single-user licenses, while businesses requiring broader access may choose multi-user or enterprise licenses for cost-effective access to the report.
13. Are there any additional resources or data provided in the Pipeline Maintenance Service Market report?
While the report offers comprehensive insights, it's advisable to review the specific contents or supplementary materials provided to ascertain if additional resources or data are available.
14. How can I stay updated on further developments or reports in the Pipeline Maintenance Service Market?
To stay informed about further developments, trends, and reports in the Pipeline Maintenance Service Market, consider subscribing to industry newsletters, following relevant companies and organizations, or regularly checking reputable industry news sources and publications.
Methodology
Step 1 - Identification of Relevant Samples Size from Population Database


Step 2 - Approaches for Defining Global Market Size (Value, Volume* & Price*)

Note*: In applicable scenarios
Step 3 - Data Sources
Primary Research
- Web Analytics
- Survey Reports
- Research Institute
- Latest Research Reports
- Opinion Leaders
Secondary Research
- Annual Reports
- White Paper
- Latest Press Release
- Industry Association
- Paid Database
- Investor Presentations

Step 4 - Data Triangulation
Involves using different sources of information in order to increase the validity of a study
These sources are likely to be stakeholders in a program - participants, other researchers, program staff, other community members, and so on.
Then we put all data in single framework & apply various statistical tools to find out the dynamic on the market.
During the analysis stage, feedback from the stakeholder groups would be compared to determine areas of agreement as well as areas of divergence


