
Key Insights
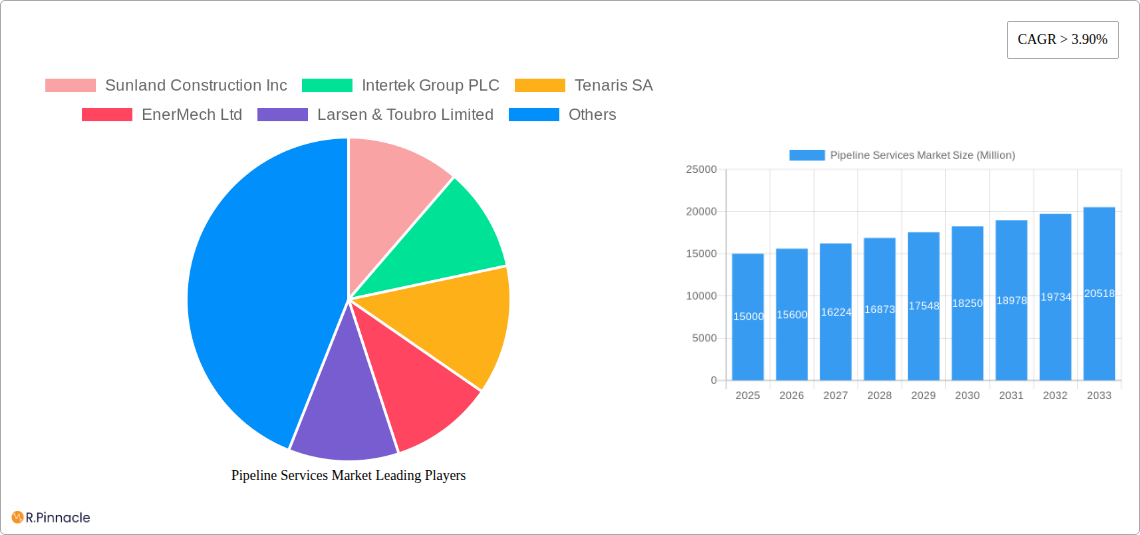
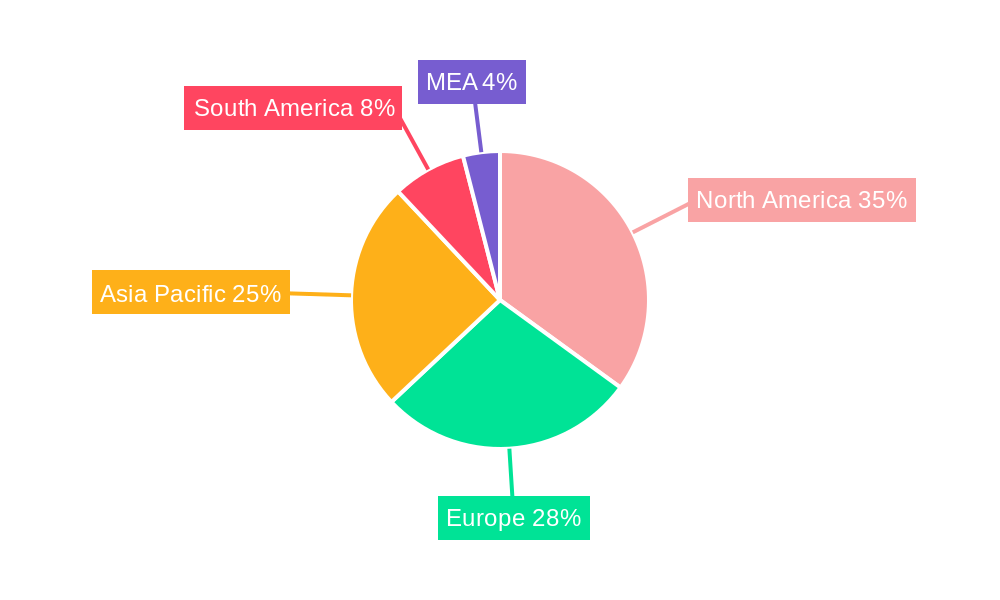
The global pipeline services market is experiencing robust growth, driven by increasing investments in oil and gas infrastructure, expanding cross-border pipeline networks, and the rising demand for energy across various sectors. The market's Compound Annual Growth Rate (CAGR) exceeding 3.90% signifies a consistent upward trajectory projected through 2033. Key drivers include the ongoing need for efficient pipeline maintenance and the growing emphasis on safety and regulatory compliance within the energy industry. Technological advancements, such as the adoption of advanced inspection techniques and automation, are further fueling market expansion. While challenges like fluctuating oil prices and stringent environmental regulations can pose temporary restraints, the long-term outlook remains positive, fueled by global energy demand and the critical role pipelines play in energy transportation. The market segmentation reveals substantial opportunities across various service types, including pre-commissioning and commissioning, maintenance, and specialized cleaning services, catering to both onshore and offshore pipeline operations. Geographic analysis indicates strong growth potential across North America, Europe, and the Asia-Pacific region, driven by diverse factors such as government initiatives, infrastructural development, and energy consumption patterns within each region. The competitive landscape is marked by a mix of established multinational companies and regional players, reflecting a dynamic and evolving market structure.
The market's expansion is strategically segmented by service type, location, and geographic region. Pre-commissioning and commissioning services, crucial for ensuring pipeline operational readiness, represent a substantial segment, alongside the continuous demand for maintenance services. Cleaning services, essential for preventing corrosion and maintaining pipeline integrity, are also significant. Onshore projects currently hold a larger market share compared to offshore projects, although offshore projects are anticipated to witness significant growth due to rising exploration and production activities in deepwater regions. North America and Europe are currently leading market segments, owing to substantial existing pipeline infrastructure and continuous upgrades. However, the Asia-Pacific region is predicted to demonstrate significant growth in the coming years, propelled by expanding energy consumption and infrastructure development initiatives. This growth is expected to be led by countries with significant pipeline projects, such as China and India. The presence of several key players like Sunland Construction Inc, Intertek Group PLC, and Baker Hughes Co, among others, creates a competitive yet dynamic market.
Pipeline Services Market: A Comprehensive Report (2019-2033)
This in-depth report provides a comprehensive analysis of the Pipeline Services Market, offering invaluable insights for industry professionals, investors, and strategic decision-makers. The study period covers 2019-2033, with a base year of 2025 and a forecast period of 2025-2033. The report leverages extensive data analysis to deliver actionable intelligence, focusing on market dynamics, key players, and future growth opportunities. The total market size in 2025 is estimated at xx Million.
Pipeline Services Market Market Structure & Innovation Trends
This section analyzes the competitive landscape of the Pipeline Services Market, encompassing market concentration, innovation drivers, regulatory frameworks, product substitutes, end-user demographics, and M&A activities. The market exhibits a moderately concentrated structure, with several key players holding significant market share.
- Market Concentration: The top 5 players account for approximately xx% of the global market share in 2025.
- Innovation Drivers: Technological advancements in inspection technologies (e.g., robotic inspection, advanced sensors) and the increasing demand for efficient pipeline maintenance are key drivers.
- Regulatory Frameworks: Stringent environmental regulations and safety standards are shaping market practices, driving the adoption of advanced, eco-friendly solutions.
- Product Substitutes: While traditional methods remain prevalent, the emergence of innovative technologies presents potential substitutes for certain services.
- End-User Demographics: The primary end-users include oil and gas companies, energy transportation firms, and government agencies involved in infrastructure development.
- M&A Activities: The market has witnessed significant M&A activity in recent years, driven by companies seeking to expand their service portfolios and geographic reach. Total M&A deal value in the past 5 years is estimated at xx Million.
Pipeline Services Market Market Dynamics & Trends
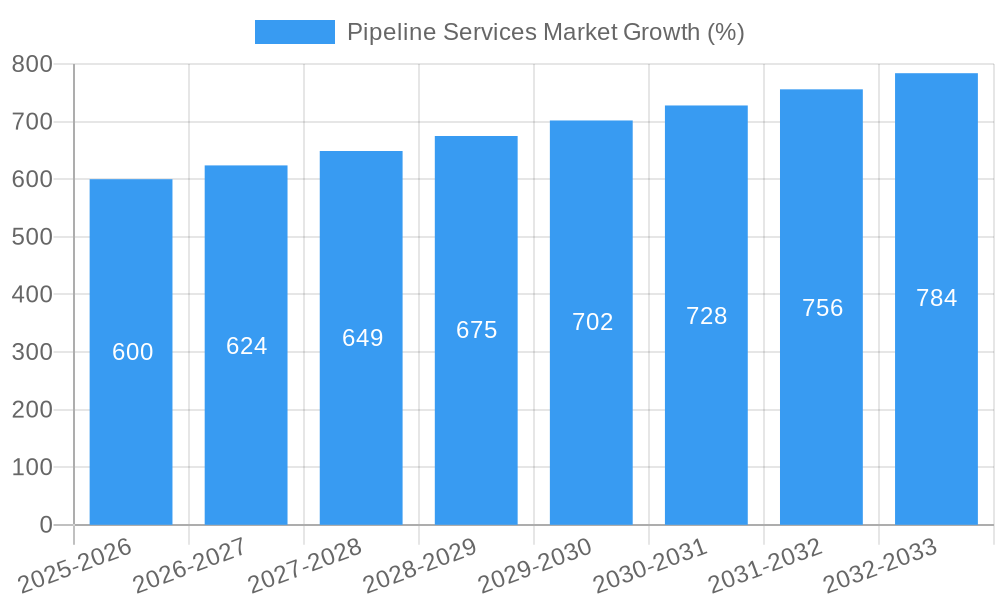
This section delves into the key market dynamics and trends influencing the Pipeline Services Market. The market is projected to experience a Compound Annual Growth Rate (CAGR) of xx% during the forecast period (2025-2033). This growth is fueled by:
- Increasing global energy demand and the expansion of pipeline networks.
- Growing focus on pipeline safety and integrity management.
- Technological advancements leading to improved efficiency and reduced operational costs.
- Rising investments in pipeline infrastructure projects across various regions.
- The increasing adoption of advanced inspection and maintenance technologies is driving market penetration to xx% in 2025.
Competitive dynamics are intense, with companies focusing on innovation, strategic partnerships, and geographic expansion to maintain a competitive edge.
Dominant Regions & Segments in Pipeline Services Market
This section identifies the leading regions and segments within the Pipeline Services Market.
By Location of Deployment: The Offshore segment is currently dominating due to the higher demand for specialized services in challenging environments. Key drivers include the increasing exploration and production activities in offshore oil and gas fields and stringent safety regulations.
By Service Type: The Pre-commissioning and Commissioning Services segment holds the largest market share, driven by the growing need to ensure the safe and efficient operation of new and upgraded pipeline infrastructure. Maintenance Services are also crucial due to the need for regular inspections and repairs.
Other Inspection Services: Decommissioning Services: The decommissioning services market is witnessing significant growth driven by aging pipeline infrastructure and environmental regulations.
Key drivers for the dominant regions include robust economic growth, extensive pipeline infrastructure, and supportive government policies.
Pipeline Services Market Product Innovations
The Pipeline Services Market is witnessing rapid product innovation, with advancements in inspection technologies, data analytics, and automation playing a critical role. New products focus on enhancing efficiency, safety, and cost-effectiveness. The increasing demand for real-time monitoring and predictive maintenance is driving the development of advanced technologies like robotic inspection systems, and sophisticated data analysis tools, offering considerable competitive advantages to providers.
Report Scope & Segmentation Analysis
This report segments the Pipeline Services Market across several key parameters:
By Location of Deployment: Onshore and Offshore. The offshore segment is projected to witness faster growth due to increased exploration and production in offshore regions.
By Service Type: Pre-commissioning and Commissioning Services, Maintenance Services, Cleaning Services, and Inspection Services. Each segment exhibits unique growth trajectories and competitive dynamics.
Other Inspection Services: Decommissioning services are a growing segment, driven by aging pipeline infrastructure and environmental concerns. Each segment presents unique growth opportunities, driven by factors such as increasing regulatory compliance, stringent safety norms, and the demand for advanced service solutions.
Key Drivers of Pipeline Services Market Growth
The Pipeline Services Market is driven by several factors:
- Technological Advancements: The development of advanced inspection techniques, automated systems, and data analytics solutions is enhancing efficiency and lowering operational costs.
- Stringent Safety Regulations: Governments worldwide are implementing stricter regulations on pipeline safety, leading to increased demand for inspection and maintenance services.
- Rising Energy Demand: The global energy demand is pushing the expansion of pipeline infrastructure, creating opportunities for pipeline services providers.
Challenges in the Pipeline Services Market Sector
The Pipeline Services Market faces several challenges:
- Fluctuating Oil and Gas Prices: Price volatility impacts investment decisions in pipeline projects, affecting the demand for services.
- Supply Chain Disruptions: Global events can disrupt the supply of equipment and skilled labor, impacting project timelines and costs.
- Intense Competition: The market is competitive, putting pressure on pricing and profitability.
Emerging Opportunities in Pipeline Services Market
The Pipeline Services Market presents several emerging opportunities:
- Growth in Emerging Markets: Developing economies are investing heavily in pipeline infrastructure, creating significant demand.
- Digitalization and Automation: The adoption of digital technologies for predictive maintenance and remote monitoring offers significant opportunities.
- Focus on Sustainability: The industry is increasingly focused on environmentally friendly practices, leading to demand for eco-friendly service solutions.
Leading Players in the Pipeline Services Market Market
- Sunland Construction Inc
- Intertek Group PLC (Intertek)
- Tenaris SA (Tenaris)
- EnerMech Ltd
- Larsen & Toubro Limited (Larsen & Toubro)
- IKM Gruppen AS
- Ledcor Group
- Baker Hughes Co (Baker Hughes)
- STATS Group
- T D Williamson
- Barnard Construction Company Inc
- Snelson Companies Inc
- Oil States Industries Inc
- Pumpco Inc
Key Developments in Pipeline Services Market Industry
- January 2023: Company X launched a new robotic inspection system for pipelines.
- June 2022: Company Y acquired Company Z, expanding its service portfolio.
- March 2021: New regulations on pipeline safety were implemented in Region A.
(Further key developments to be added)
Future Outlook for Pipeline Services Market Market
The Pipeline Services Market is poised for robust growth in the coming years, driven by factors such as increasing energy demand, rising investments in pipeline infrastructure, and technological advancements. Strategic partnerships, technological innovation, and expansion into emerging markets will be key success factors for companies operating in this dynamic sector. The market is projected to reach xx Million by 2033.
Pipeline Services Market Segmentation
-
1. Service Type
- 1.1. Pre-commissioning and Commissioning Services
-
1.2. Maintenance Services
- 1.2.1. Repair Services
- 1.2.2. Cleaning Services
-
1.3. Inspection Services
- 1.3.1. Intellig
- 1.3.2. Caliper Pigging
- 1.3.3. Other Inspection Services
- 1.4. Decommissioning Services
-
2. Location of Deployment
- 2.1. Onshore
- 2.2. Offshore
Pipeline Services Market Segmentation By Geography
- 1. North America
- 2. Asia Pacific
- 3. Europe
- 4. South America
- 5. Middle East
Pipeline Services Market REPORT HIGHLIGHTS
| Aspects | Details |
|---|---|
| Study Period | 2019-2033 |
| Base Year | 2024 |
| Estimated Year | 2025 |
| Forecast Period | 2025-2033 |
| Historical Period | 2019-2024 |
| Growth Rate | CAGR of > 3.90% from 2019-2033 |
| Segmentation |
|
Table of Contents
- 1. Introduction
- 1.1. Research Scope
- 1.2. Market Segmentation
- 1.3. Research Methodology
- 1.4. Definitions and Assumptions
- 2. Executive Summary
- 2.1. Introduction
- 3. Market Dynamics
- 3.1. Introduction
- 3.2. Market Drivers
- 3.2.1. 4.; Rapid Recovery in the Oil and Gas and Mining Industries4.; Surge in the Construction Industry
- 3.3. Market Restrains
- 3.3.1. 4.; High Maintenance and Operation Costs of Submersible Pump Restrain the Market
- 3.4. Market Trends
- 3.4.1. Intelligent Pigging to be a Significant Market
- 4. Market Factor Analysis
- 4.1. Porters Five Forces
- 4.2. Supply/Value Chain
- 4.3. PESTEL analysis
- 4.4. Market Entropy
- 4.5. Patent/Trademark Analysis
- 5. Global Pipeline Services Market Analysis, Insights and Forecast, 2019-2031
- 5.1. Market Analysis, Insights and Forecast - by Service Type
- 5.1.1. Pre-commissioning and Commissioning Services
- 5.1.2. Maintenance Services
- 5.1.2.1. Repair Services
- 5.1.2.2. Cleaning Services
- 5.1.3. Inspection Services
- 5.1.3.1. Intellig
- 5.1.3.2. Caliper Pigging
- 5.1.3.3. Other Inspection Services
- 5.1.4. Decommissioning Services
- 5.2. Market Analysis, Insights and Forecast - by Location of Deployment
- 5.2.1. Onshore
- 5.2.2. Offshore
- 5.3. Market Analysis, Insights and Forecast - by Region
- 5.3.1. North America
- 5.3.2. Asia Pacific
- 5.3.3. Europe
- 5.3.4. South America
- 5.3.5. Middle East
- 5.1. Market Analysis, Insights and Forecast - by Service Type
- 6. North America Pipeline Services Market Analysis, Insights and Forecast, 2019-2031
- 6.1. Market Analysis, Insights and Forecast - by Service Type
- 6.1.1. Pre-commissioning and Commissioning Services
- 6.1.2. Maintenance Services
- 6.1.2.1. Repair Services
- 6.1.2.2. Cleaning Services
- 6.1.3. Inspection Services
- 6.1.3.1. Intellig
- 6.1.3.2. Caliper Pigging
- 6.1.3.3. Other Inspection Services
- 6.1.4. Decommissioning Services
- 6.2. Market Analysis, Insights and Forecast - by Location of Deployment
- 6.2.1. Onshore
- 6.2.2. Offshore
- 6.1. Market Analysis, Insights and Forecast - by Service Type
- 7. Asia Pacific Pipeline Services Market Analysis, Insights and Forecast, 2019-2031
- 7.1. Market Analysis, Insights and Forecast - by Service Type
- 7.1.1. Pre-commissioning and Commissioning Services
- 7.1.2. Maintenance Services
- 7.1.2.1. Repair Services
- 7.1.2.2. Cleaning Services
- 7.1.3. Inspection Services
- 7.1.3.1. Intellig
- 7.1.3.2. Caliper Pigging
- 7.1.3.3. Other Inspection Services
- 7.1.4. Decommissioning Services
- 7.2. Market Analysis, Insights and Forecast - by Location of Deployment
- 7.2.1. Onshore
- 7.2.2. Offshore
- 7.1. Market Analysis, Insights and Forecast - by Service Type
- 8. Europe Pipeline Services Market Analysis, Insights and Forecast, 2019-2031
- 8.1. Market Analysis, Insights and Forecast - by Service Type
- 8.1.1. Pre-commissioning and Commissioning Services
- 8.1.2. Maintenance Services
- 8.1.2.1. Repair Services
- 8.1.2.2. Cleaning Services
- 8.1.3. Inspection Services
- 8.1.3.1. Intellig
- 8.1.3.2. Caliper Pigging
- 8.1.3.3. Other Inspection Services
- 8.1.4. Decommissioning Services
- 8.2. Market Analysis, Insights and Forecast - by Location of Deployment
- 8.2.1. Onshore
- 8.2.2. Offshore
- 8.1. Market Analysis, Insights and Forecast - by Service Type
- 9. South America Pipeline Services Market Analysis, Insights and Forecast, 2019-2031
- 9.1. Market Analysis, Insights and Forecast - by Service Type
- 9.1.1. Pre-commissioning and Commissioning Services
- 9.1.2. Maintenance Services
- 9.1.2.1. Repair Services
- 9.1.2.2. Cleaning Services
- 9.1.3. Inspection Services
- 9.1.3.1. Intellig
- 9.1.3.2. Caliper Pigging
- 9.1.3.3. Other Inspection Services
- 9.1.4. Decommissioning Services
- 9.2. Market Analysis, Insights and Forecast - by Location of Deployment
- 9.2.1. Onshore
- 9.2.2. Offshore
- 9.1. Market Analysis, Insights and Forecast - by Service Type
- 10. Middle East Pipeline Services Market Analysis, Insights and Forecast, 2019-2031
- 10.1. Market Analysis, Insights and Forecast - by Service Type
- 10.1.1. Pre-commissioning and Commissioning Services
- 10.1.2. Maintenance Services
- 10.1.2.1. Repair Services
- 10.1.2.2. Cleaning Services
- 10.1.3. Inspection Services
- 10.1.3.1. Intellig
- 10.1.3.2. Caliper Pigging
- 10.1.3.3. Other Inspection Services
- 10.1.4. Decommissioning Services
- 10.2. Market Analysis, Insights and Forecast - by Location of Deployment
- 10.2.1. Onshore
- 10.2.2. Offshore
- 10.1. Market Analysis, Insights and Forecast - by Service Type
- 11. North America Pipeline Services Market Analysis, Insights and Forecast, 2019-2031
- 11.1. Market Analysis, Insights and Forecast - By Country/Sub-region
- 11.1.1 United States
- 11.1.2 Canada
- 11.1.3 Mexico
- 12. Europe Pipeline Services Market Analysis, Insights and Forecast, 2019-2031
- 12.1. Market Analysis, Insights and Forecast - By Country/Sub-region
- 12.1.1 Germany
- 12.1.2 United Kingdom
- 12.1.3 France
- 12.1.4 Spain
- 12.1.5 Italy
- 12.1.6 Spain
- 12.1.7 Belgium
- 12.1.8 Netherland
- 12.1.9 Nordics
- 12.1.10 Rest of Europe
- 13. Asia Pacific Pipeline Services Market Analysis, Insights and Forecast, 2019-2031
- 13.1. Market Analysis, Insights and Forecast - By Country/Sub-region
- 13.1.1 China
- 13.1.2 Japan
- 13.1.3 India
- 13.1.4 South Korea
- 13.1.5 Southeast Asia
- 13.1.6 Australia
- 13.1.7 Indonesia
- 13.1.8 Phillipes
- 13.1.9 Singapore
- 13.1.10 Thailandc
- 13.1.11 Rest of Asia Pacific
- 14. South America Pipeline Services Market Analysis, Insights and Forecast, 2019-2031
- 14.1. Market Analysis, Insights and Forecast - By Country/Sub-region
- 14.1.1 Brazil
- 14.1.2 Argentina
- 14.1.3 Peru
- 14.1.4 Chile
- 14.1.5 Colombia
- 14.1.6 Ecuador
- 14.1.7 Venezuela
- 14.1.8 Rest of South America
- 15. North America Pipeline Services Market Analysis, Insights and Forecast, 2019-2031
- 15.1. Market Analysis, Insights and Forecast - By Country/Sub-region
- 15.1.1 United States
- 15.1.2 Canada
- 15.1.3 Mexico
- 16. MEA Pipeline Services Market Analysis, Insights and Forecast, 2019-2031
- 16.1. Market Analysis, Insights and Forecast - By Country/Sub-region
- 16.1.1 United Arab Emirates
- 16.1.2 Saudi Arabia
- 16.1.3 South Africa
- 16.1.4 Rest of Middle East and Africa
- 17. Competitive Analysis
- 17.1. Global Market Share Analysis 2024
- 17.2. Company Profiles
- 17.2.1 Sunland Construction Inc
- 17.2.1.1. Overview
- 17.2.1.2. Products
- 17.2.1.3. SWOT Analysis
- 17.2.1.4. Recent Developments
- 17.2.1.5. Financials (Based on Availability)
- 17.2.2 Intertek Group PLC
- 17.2.2.1. Overview
- 17.2.2.2. Products
- 17.2.2.3. SWOT Analysis
- 17.2.2.4. Recent Developments
- 17.2.2.5. Financials (Based on Availability)
- 17.2.3 Tenaris SA
- 17.2.3.1. Overview
- 17.2.3.2. Products
- 17.2.3.3. SWOT Analysis
- 17.2.3.4. Recent Developments
- 17.2.3.5. Financials (Based on Availability)
- 17.2.4 EnerMech Ltd
- 17.2.4.1. Overview
- 17.2.4.2. Products
- 17.2.4.3. SWOT Analysis
- 17.2.4.4. Recent Developments
- 17.2.4.5. Financials (Based on Availability)
- 17.2.5 Larsen & Toubro Limited
- 17.2.5.1. Overview
- 17.2.5.2. Products
- 17.2.5.3. SWOT Analysis
- 17.2.5.4. Recent Developments
- 17.2.5.5. Financials (Based on Availability)
- 17.2.6 IKM Gruppen AS
- 17.2.6.1. Overview
- 17.2.6.2. Products
- 17.2.6.3. SWOT Analysis
- 17.2.6.4. Recent Developments
- 17.2.6.5. Financials (Based on Availability)
- 17.2.7 Ledcor Group
- 17.2.7.1. Overview
- 17.2.7.2. Products
- 17.2.7.3. SWOT Analysis
- 17.2.7.4. Recent Developments
- 17.2.7.5. Financials (Based on Availability)
- 17.2.8 Baker Hughes Co
- 17.2.8.1. Overview
- 17.2.8.2. Products
- 17.2.8.3. SWOT Analysis
- 17.2.8.4. Recent Developments
- 17.2.8.5. Financials (Based on Availability)
- 17.2.9 STATS Group
- 17.2.9.1. Overview
- 17.2.9.2. Products
- 17.2.9.3. SWOT Analysis
- 17.2.9.4. Recent Developments
- 17.2.9.5. Financials (Based on Availability)
- 17.2.10 T D Williamson*List Not Exhaustive
- 17.2.10.1. Overview
- 17.2.10.2. Products
- 17.2.10.3. SWOT Analysis
- 17.2.10.4. Recent Developments
- 17.2.10.5. Financials (Based on Availability)
- 17.2.11 Barnard Construction Company Inc
- 17.2.11.1. Overview
- 17.2.11.2. Products
- 17.2.11.3. SWOT Analysis
- 17.2.11.4. Recent Developments
- 17.2.11.5. Financials (Based on Availability)
- 17.2.12 Snelson Companies Inc
- 17.2.12.1. Overview
- 17.2.12.2. Products
- 17.2.12.3. SWOT Analysis
- 17.2.12.4. Recent Developments
- 17.2.12.5. Financials (Based on Availability)
- 17.2.13 Oil States Industries Inc
- 17.2.13.1. Overview
- 17.2.13.2. Products
- 17.2.13.3. SWOT Analysis
- 17.2.13.4. Recent Developments
- 17.2.13.5. Financials (Based on Availability)
- 17.2.14 Pumpco Inc
- 17.2.14.1. Overview
- 17.2.14.2. Products
- 17.2.14.3. SWOT Analysis
- 17.2.14.4. Recent Developments
- 17.2.14.5. Financials (Based on Availability)
- 17.2.1 Sunland Construction Inc
List of Figures
- Figure 1: Global Pipeline Services Market Revenue Breakdown (Million, %) by Region 2024 & 2032
- Figure 2: North America Pipeline Services Market Revenue (Million), by Country 2024 & 2032
- Figure 3: North America Pipeline Services Market Revenue Share (%), by Country 2024 & 2032
- Figure 4: Europe Pipeline Services Market Revenue (Million), by Country 2024 & 2032
- Figure 5: Europe Pipeline Services Market Revenue Share (%), by Country 2024 & 2032
- Figure 6: Asia Pacific Pipeline Services Market Revenue (Million), by Country 2024 & 2032
- Figure 7: Asia Pacific Pipeline Services Market Revenue Share (%), by Country 2024 & 2032
- Figure 8: South America Pipeline Services Market Revenue (Million), by Country 2024 & 2032
- Figure 9: South America Pipeline Services Market Revenue Share (%), by Country 2024 & 2032
- Figure 10: North America Pipeline Services Market Revenue (Million), by Country 2024 & 2032
- Figure 11: North America Pipeline Services Market Revenue Share (%), by Country 2024 & 2032
- Figure 12: MEA Pipeline Services Market Revenue (Million), by Country 2024 & 2032
- Figure 13: MEA Pipeline Services Market Revenue Share (%), by Country 2024 & 2032
- Figure 14: North America Pipeline Services Market Revenue (Million), by Service Type 2024 & 2032
- Figure 15: North America Pipeline Services Market Revenue Share (%), by Service Type 2024 & 2032
- Figure 16: North America Pipeline Services Market Revenue (Million), by Location of Deployment 2024 & 2032
- Figure 17: North America Pipeline Services Market Revenue Share (%), by Location of Deployment 2024 & 2032
- Figure 18: North America Pipeline Services Market Revenue (Million), by Country 2024 & 2032
- Figure 19: North America Pipeline Services Market Revenue Share (%), by Country 2024 & 2032
- Figure 20: Asia Pacific Pipeline Services Market Revenue (Million), by Service Type 2024 & 2032
- Figure 21: Asia Pacific Pipeline Services Market Revenue Share (%), by Service Type 2024 & 2032
- Figure 22: Asia Pacific Pipeline Services Market Revenue (Million), by Location of Deployment 2024 & 2032
- Figure 23: Asia Pacific Pipeline Services Market Revenue Share (%), by Location of Deployment 2024 & 2032
- Figure 24: Asia Pacific Pipeline Services Market Revenue (Million), by Country 2024 & 2032
- Figure 25: Asia Pacific Pipeline Services Market Revenue Share (%), by Country 2024 & 2032
- Figure 26: Europe Pipeline Services Market Revenue (Million), by Service Type 2024 & 2032
- Figure 27: Europe Pipeline Services Market Revenue Share (%), by Service Type 2024 & 2032
- Figure 28: Europe Pipeline Services Market Revenue (Million), by Location of Deployment 2024 & 2032
- Figure 29: Europe Pipeline Services Market Revenue Share (%), by Location of Deployment 2024 & 2032
- Figure 30: Europe Pipeline Services Market Revenue (Million), by Country 2024 & 2032
- Figure 31: Europe Pipeline Services Market Revenue Share (%), by Country 2024 & 2032
- Figure 32: South America Pipeline Services Market Revenue (Million), by Service Type 2024 & 2032
- Figure 33: South America Pipeline Services Market Revenue Share (%), by Service Type 2024 & 2032
- Figure 34: South America Pipeline Services Market Revenue (Million), by Location of Deployment 2024 & 2032
- Figure 35: South America Pipeline Services Market Revenue Share (%), by Location of Deployment 2024 & 2032
- Figure 36: South America Pipeline Services Market Revenue (Million), by Country 2024 & 2032
- Figure 37: South America Pipeline Services Market Revenue Share (%), by Country 2024 & 2032
- Figure 38: Middle East Pipeline Services Market Revenue (Million), by Service Type 2024 & 2032
- Figure 39: Middle East Pipeline Services Market Revenue Share (%), by Service Type 2024 & 2032
- Figure 40: Middle East Pipeline Services Market Revenue (Million), by Location of Deployment 2024 & 2032
- Figure 41: Middle East Pipeline Services Market Revenue Share (%), by Location of Deployment 2024 & 2032
- Figure 42: Middle East Pipeline Services Market Revenue (Million), by Country 2024 & 2032
- Figure 43: Middle East Pipeline Services Market Revenue Share (%), by Country 2024 & 2032
List of Tables
- Table 1: Global Pipeline Services Market Revenue Million Forecast, by Region 2019 & 2032
- Table 2: Global Pipeline Services Market Revenue Million Forecast, by Service Type 2019 & 2032
- Table 3: Global Pipeline Services Market Revenue Million Forecast, by Location of Deployment 2019 & 2032
- Table 4: Global Pipeline Services Market Revenue Million Forecast, by Region 2019 & 2032
- Table 5: Global Pipeline Services Market Revenue Million Forecast, by Country 2019 & 2032
- Table 6: United States Pipeline Services Market Revenue (Million) Forecast, by Application 2019 & 2032
- Table 7: Canada Pipeline Services Market Revenue (Million) Forecast, by Application 2019 & 2032
- Table 8: Mexico Pipeline Services Market Revenue (Million) Forecast, by Application 2019 & 2032
- Table 9: Global Pipeline Services Market Revenue Million Forecast, by Country 2019 & 2032
- Table 10: Germany Pipeline Services Market Revenue (Million) Forecast, by Application 2019 & 2032
- Table 11: United Kingdom Pipeline Services Market Revenue (Million) Forecast, by Application 2019 & 2032
- Table 12: France Pipeline Services Market Revenue (Million) Forecast, by Application 2019 & 2032
- Table 13: Spain Pipeline Services Market Revenue (Million) Forecast, by Application 2019 & 2032
- Table 14: Italy Pipeline Services Market Revenue (Million) Forecast, by Application 2019 & 2032
- Table 15: Spain Pipeline Services Market Revenue (Million) Forecast, by Application 2019 & 2032
- Table 16: Belgium Pipeline Services Market Revenue (Million) Forecast, by Application 2019 & 2032
- Table 17: Netherland Pipeline Services Market Revenue (Million) Forecast, by Application 2019 & 2032
- Table 18: Nordics Pipeline Services Market Revenue (Million) Forecast, by Application 2019 & 2032
- Table 19: Rest of Europe Pipeline Services Market Revenue (Million) Forecast, by Application 2019 & 2032
- Table 20: Global Pipeline Services Market Revenue Million Forecast, by Country 2019 & 2032
- Table 21: China Pipeline Services Market Revenue (Million) Forecast, by Application 2019 & 2032
- Table 22: Japan Pipeline Services Market Revenue (Million) Forecast, by Application 2019 & 2032
- Table 23: India Pipeline Services Market Revenue (Million) Forecast, by Application 2019 & 2032
- Table 24: South Korea Pipeline Services Market Revenue (Million) Forecast, by Application 2019 & 2032
- Table 25: Southeast Asia Pipeline Services Market Revenue (Million) Forecast, by Application 2019 & 2032
- Table 26: Australia Pipeline Services Market Revenue (Million) Forecast, by Application 2019 & 2032
- Table 27: Indonesia Pipeline Services Market Revenue (Million) Forecast, by Application 2019 & 2032
- Table 28: Phillipes Pipeline Services Market Revenue (Million) Forecast, by Application 2019 & 2032
- Table 29: Singapore Pipeline Services Market Revenue (Million) Forecast, by Application 2019 & 2032
- Table 30: Thailandc Pipeline Services Market Revenue (Million) Forecast, by Application 2019 & 2032
- Table 31: Rest of Asia Pacific Pipeline Services Market Revenue (Million) Forecast, by Application 2019 & 2032
- Table 32: Global Pipeline Services Market Revenue Million Forecast, by Country 2019 & 2032
- Table 33: Brazil Pipeline Services Market Revenue (Million) Forecast, by Application 2019 & 2032
- Table 34: Argentina Pipeline Services Market Revenue (Million) Forecast, by Application 2019 & 2032
- Table 35: Peru Pipeline Services Market Revenue (Million) Forecast, by Application 2019 & 2032
- Table 36: Chile Pipeline Services Market Revenue (Million) Forecast, by Application 2019 & 2032
- Table 37: Colombia Pipeline Services Market Revenue (Million) Forecast, by Application 2019 & 2032
- Table 38: Ecuador Pipeline Services Market Revenue (Million) Forecast, by Application 2019 & 2032
- Table 39: Venezuela Pipeline Services Market Revenue (Million) Forecast, by Application 2019 & 2032
- Table 40: Rest of South America Pipeline Services Market Revenue (Million) Forecast, by Application 2019 & 2032
- Table 41: Global Pipeline Services Market Revenue Million Forecast, by Country 2019 & 2032
- Table 42: United States Pipeline Services Market Revenue (Million) Forecast, by Application 2019 & 2032
- Table 43: Canada Pipeline Services Market Revenue (Million) Forecast, by Application 2019 & 2032
- Table 44: Mexico Pipeline Services Market Revenue (Million) Forecast, by Application 2019 & 2032
- Table 45: Global Pipeline Services Market Revenue Million Forecast, by Country 2019 & 2032
- Table 46: United Arab Emirates Pipeline Services Market Revenue (Million) Forecast, by Application 2019 & 2032
- Table 47: Saudi Arabia Pipeline Services Market Revenue (Million) Forecast, by Application 2019 & 2032
- Table 48: South Africa Pipeline Services Market Revenue (Million) Forecast, by Application 2019 & 2032
- Table 49: Rest of Middle East and Africa Pipeline Services Market Revenue (Million) Forecast, by Application 2019 & 2032
- Table 50: Global Pipeline Services Market Revenue Million Forecast, by Service Type 2019 & 2032
- Table 51: Global Pipeline Services Market Revenue Million Forecast, by Location of Deployment 2019 & 2032
- Table 52: Global Pipeline Services Market Revenue Million Forecast, by Country 2019 & 2032
- Table 53: Global Pipeline Services Market Revenue Million Forecast, by Service Type 2019 & 2032
- Table 54: Global Pipeline Services Market Revenue Million Forecast, by Location of Deployment 2019 & 2032
- Table 55: Global Pipeline Services Market Revenue Million Forecast, by Country 2019 & 2032
- Table 56: Global Pipeline Services Market Revenue Million Forecast, by Service Type 2019 & 2032
- Table 57: Global Pipeline Services Market Revenue Million Forecast, by Location of Deployment 2019 & 2032
- Table 58: Global Pipeline Services Market Revenue Million Forecast, by Country 2019 & 2032
- Table 59: Global Pipeline Services Market Revenue Million Forecast, by Service Type 2019 & 2032
- Table 60: Global Pipeline Services Market Revenue Million Forecast, by Location of Deployment 2019 & 2032
- Table 61: Global Pipeline Services Market Revenue Million Forecast, by Country 2019 & 2032
- Table 62: Global Pipeline Services Market Revenue Million Forecast, by Service Type 2019 & 2032
- Table 63: Global Pipeline Services Market Revenue Million Forecast, by Location of Deployment 2019 & 2032
- Table 64: Global Pipeline Services Market Revenue Million Forecast, by Country 2019 & 2032
Frequently Asked Questions
1. What is the projected Compound Annual Growth Rate (CAGR) of the Pipeline Services Market?
The projected CAGR is approximately > 3.90%.
2. Which companies are prominent players in the Pipeline Services Market?
Key companies in the market include Sunland Construction Inc, Intertek Group PLC, Tenaris SA, EnerMech Ltd, Larsen & Toubro Limited, IKM Gruppen AS, Ledcor Group, Baker Hughes Co, STATS Group, T D Williamson*List Not Exhaustive, Barnard Construction Company Inc, Snelson Companies Inc, Oil States Industries Inc, Pumpco Inc.
3. What are the main segments of the Pipeline Services Market?
The market segments include Service Type, Location of Deployment.
4. Can you provide details about the market size?
The market size is estimated to be USD XX Million as of 2022.
5. What are some drivers contributing to market growth?
4.; Rapid Recovery in the Oil and Gas and Mining Industries4.; Surge in the Construction Industry.
6. What are the notable trends driving market growth?
Intelligent Pigging to be a Significant Market.
7. Are there any restraints impacting market growth?
4.; High Maintenance and Operation Costs of Submersible Pump Restrain the Market.
8. Can you provide examples of recent developments in the market?
N/A
9. What pricing options are available for accessing the report?
Pricing options include single-user, multi-user, and enterprise licenses priced at USD 4750, USD 5250, and USD 8750 respectively.
10. Is the market size provided in terms of value or volume?
The market size is provided in terms of value, measured in Million.
11. Are there any specific market keywords associated with the report?
Yes, the market keyword associated with the report is "Pipeline Services Market," which aids in identifying and referencing the specific market segment covered.
12. How do I determine which pricing option suits my needs best?
The pricing options vary based on user requirements and access needs. Individual users may opt for single-user licenses, while businesses requiring broader access may choose multi-user or enterprise licenses for cost-effective access to the report.
13. Are there any additional resources or data provided in the Pipeline Services Market report?
While the report offers comprehensive insights, it's advisable to review the specific contents or supplementary materials provided to ascertain if additional resources or data are available.
14. How can I stay updated on further developments or reports in the Pipeline Services Market?
To stay informed about further developments, trends, and reports in the Pipeline Services Market, consider subscribing to industry newsletters, following relevant companies and organizations, or regularly checking reputable industry news sources and publications.
Methodology
Step 1 - Identification of Relevant Samples Size from Population Database


Step 2 - Approaches for Defining Global Market Size (Value, Volume* & Price*)

Note*: In applicable scenarios
Step 3 - Data Sources
Primary Research
- Web Analytics
- Survey Reports
- Research Institute
- Latest Research Reports
- Opinion Leaders
Secondary Research
- Annual Reports
- White Paper
- Latest Press Release
- Industry Association
- Paid Database
- Investor Presentations

Step 4 - Data Triangulation
Involves using different sources of information in order to increase the validity of a study
These sources are likely to be stakeholders in a program - participants, other researchers, program staff, other community members, and so on.
Then we put all data in single framework & apply various statistical tools to find out the dynamic on the market.
During the analysis stage, feedback from the stakeholder groups would be compared to determine areas of agreement as well as areas of divergence


