
Key Insights
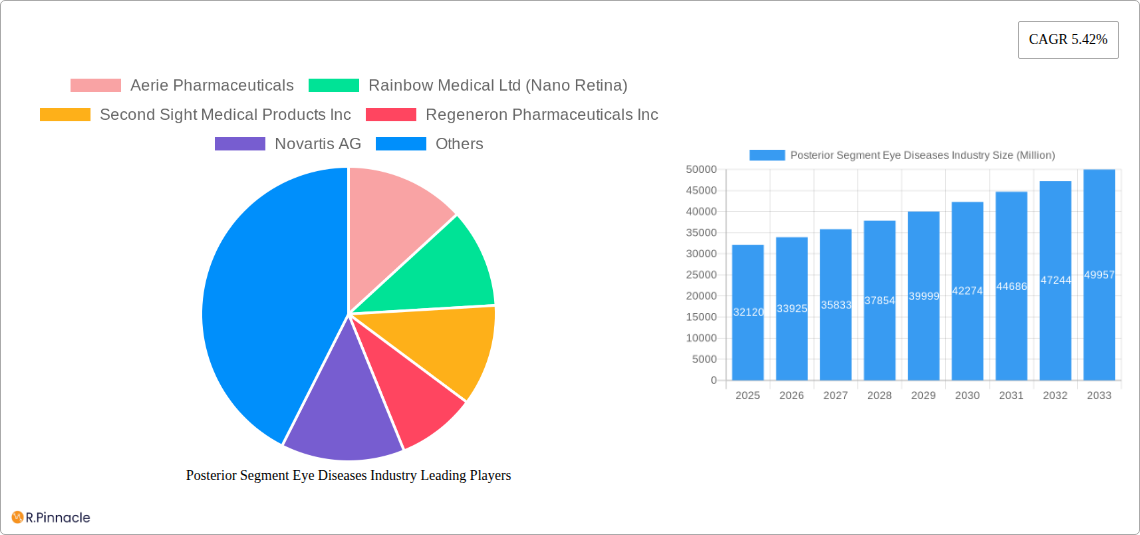
The posterior segment eye diseases market, valued at $32.12 billion in 2025, is projected to experience robust growth, driven by rising prevalence of age-related macular degeneration (AMD), diabetic retinopathy, and glaucoma. A significant factor contributing to this growth is the aging global population, increasing susceptibility to these conditions. Technological advancements in diagnostic tools and treatment modalities, including the development of novel biologics and minimally invasive surgical devices, are further accelerating market expansion. The market is segmented by product type (drugs, biologics, and devices) and application (AMD, glaucoma, diabetic retinopathy, and other applications). While drug therapies continue to dominate the market share, the biologics segment is anticipated to witness substantial growth owing to their targeted therapeutic action and improved efficacy. The increasing adoption of telemedicine and remote patient monitoring for early disease detection and management is also influencing market dynamics. Competition within the market is intense, with leading players like Novartis, Regeneron, and Roche investing heavily in research and development to introduce innovative therapies and expand their market presence. Geographic variations in market penetration exist, with North America and Europe currently holding the largest market shares due to high healthcare expenditure and advanced healthcare infrastructure. However, Asia-Pacific is poised for significant growth, driven by increasing awareness and rising disposable incomes.
The forecast period of 2025-2033 suggests a continued upward trajectory for the posterior segment eye diseases market, fueled by ongoing research into novel therapeutic approaches, including gene therapy and stem cell therapy. These emerging therapies hold the potential to revolutionize treatment strategies, leading to improved patient outcomes and further driving market expansion. Regulatory approvals for new drugs and devices will play a crucial role in shaping the market landscape. The market will also see increased competition from both established players and emerging biotechnology companies. Successful market penetration will hinge on factors such as pricing strategies, reimbursement policies, and effective marketing campaigns targeting both healthcare professionals and patients. The overall growth trajectory points toward a promising future for this market, marked by innovation, competition, and improved healthcare accessibility.
Posterior Segment Eye Diseases Industry Report: 2019-2033
This comprehensive report provides a detailed analysis of the Posterior Segment Eye Diseases industry, offering valuable insights for industry professionals, investors, and researchers. With a focus on market dynamics, technological advancements, and competitive landscapes, this report covers the period from 2019 to 2033, with a base year of 2025 and a forecast period spanning 2025-2033. The report projects a market value exceeding xx Million by 2033, presenting significant growth opportunities.
Posterior Segment Eye Diseases Industry Market Structure & Innovation Trends
This section analyzes the market structure of the posterior segment eye diseases industry, focusing on market concentration, innovation drivers, and regulatory frameworks. The industry is characterized by a moderately concentrated market with key players holding significant market share. For instance, Novartis AG and Regeneron Pharmaceuticals Inc. collectively hold an estimated xx% market share in 2025, while smaller players like Aerie Pharmaceuticals and Rainbow Medical Ltd (Nano Retina) focus on niche segments.
- Market Concentration: The market is moderately consolidated, with a few large players dominating. Smaller companies are often focused on specific disease areas or innovative treatment approaches.
- Innovation Drivers: The primary drivers of innovation are the increasing prevalence of age-related eye diseases, advancements in gene therapy, and the development of personalized medicine approaches.
- Regulatory Frameworks: Stringent regulatory pathways for new drug approvals influence the speed of market entry and overall market dynamics. Regulatory bodies like the FDA play a crucial role.
- Product Substitutes: Generic drugs and biosimilars are increasing, leading to competitive pressures and price reductions.
- End-User Demographics: The aging global population is a key driver of market expansion.
- M&A Activities: The industry has witnessed significant M&A activity in recent years, driven by the need to expand product portfolios and gain access to new technologies. Estimated M&A deal value in the historical period (2019-2024) was approximately xx Million.
Posterior Segment Eye Diseases Industry Market Dynamics & Trends
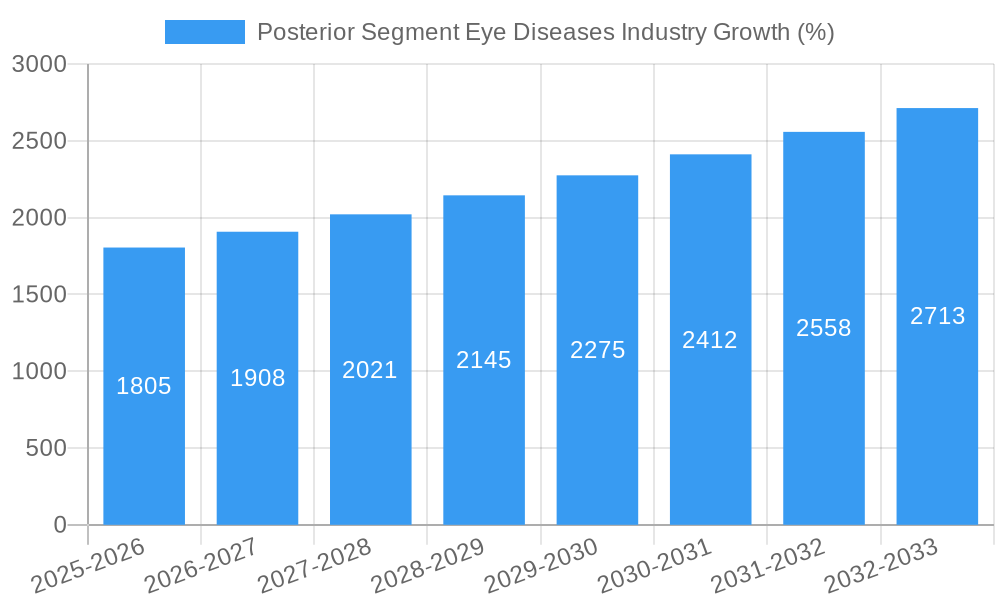
The posterior segment eye diseases market exhibits robust growth, driven by several factors. The rising prevalence of age-related macular degeneration (AMD), glaucoma, and diabetic retinopathy, coupled with an aging global population, is a key factor. Technological advancements, including gene therapy and targeted drug delivery systems, are further fueling market expansion. The market is expected to experience a CAGR of xx% during the forecast period (2025-2033), reaching a projected value of xx Million by 2033.
Increased consumer awareness of eye health and improved access to diagnostic tools contribute to this growth. However, high treatment costs and the complex regulatory landscape represent significant challenges. The competitive dynamics are intense, with established pharmaceutical companies competing with innovative biotech firms. Market penetration of novel therapies is steadily increasing, with gene therapy showing significant potential for future growth.
Dominant Regions & Segments in Posterior Segment Eye Diseases Industry
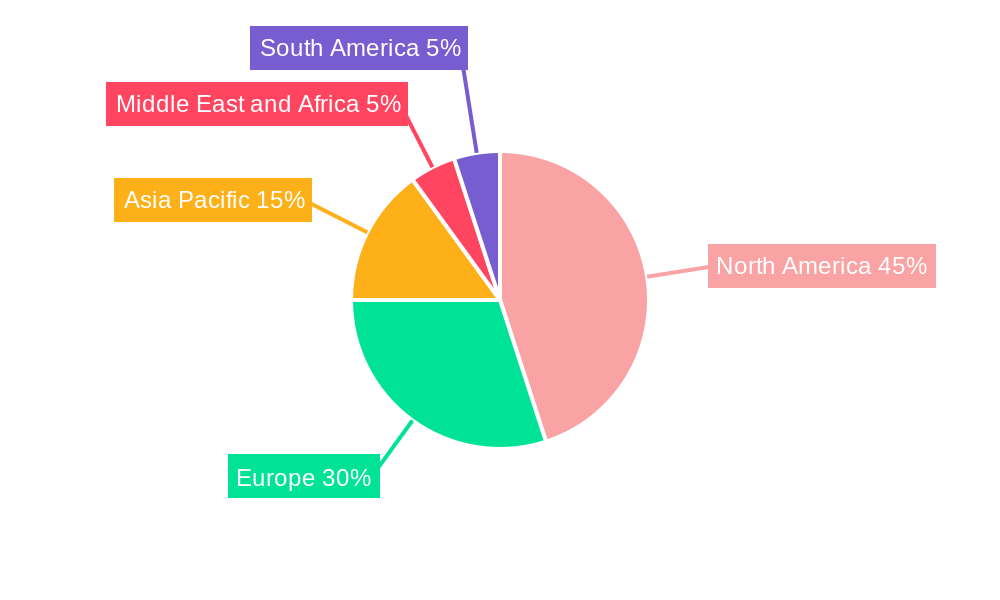
North America currently dominates the posterior segment eye diseases market, driven by higher healthcare expenditure, advanced healthcare infrastructure, and a substantial aging population. However, the Asia-Pacific region is poised for substantial growth due to rising prevalence of eye diseases and increased healthcare investment.
- Leading Region: North America
- Leading Segments:
- Product: Drugs currently hold the largest market share, followed by biologics and devices. The drugs segment is further divided into small molecule drugs, biologics, and other therapies. The biologics segment shows promising growth, driven by innovative therapies. Devices are a growing segment with new technologies.
- Application: Macular degeneration represents the largest application segment, followed by glaucoma and diabetic retinopathy. The "other applications" segment encompasses other less prevalent posterior segment diseases.
Key Drivers in Dominant Regions:
- North America: High healthcare expenditure, robust healthcare infrastructure, advanced research and development activities.
- Europe: Growing prevalence of age-related diseases, government funding for healthcare initiatives.
- Asia-Pacific: Rapidly increasing prevalence of eye diseases, rising disposable incomes, increasing healthcare expenditure.
Posterior Segment Eye Diseases Industry Product Innovations
Recent years have witnessed significant advancements in the posterior segment eye diseases treatment landscape. This includes the development of novel therapies targeting specific disease pathways, such as anti-VEGF therapies for AMD and gene therapies for inherited retinal diseases. Improved drug delivery systems are enhancing treatment efficacy and patient compliance. The focus is on developing personalized therapies tailored to individual patient needs, leading to improved treatment outcomes.
Report Scope & Segmentation Analysis
This report offers a comprehensive segmentation analysis of the posterior segment eye diseases market based on product (drugs, biologics, devices), application (macular degeneration, glaucoma, diabetic retinopathy, other applications), and geography. Each segment’s growth trajectory, market size, and competitive landscape is analyzed extensively, providing a clear understanding of the current and future market outlook. For example, the drug segment is projected to grow at a xx% CAGR, while the biologics segment is expected to witness faster growth due to the introduction of novel therapies. The market size for macular degeneration is substantial and is expected to maintain its dominance throughout the forecast period.
Key Drivers of Posterior Segment Eye Diseases Industry Growth
Several factors are driving growth in the posterior segment eye diseases industry. These include the increasing prevalence of age-related eye diseases, technological advancements leading to more effective treatments, and rising healthcare expenditure globally. Furthermore, the aging global population significantly contributes to the expanding patient pool requiring treatment. Government initiatives and funding for research and development further propel innovation and market expansion.
Challenges in the Posterior Segment Eye Diseases Industry Sector
The posterior segment eye diseases industry faces several challenges, including the high cost of treatments, stringent regulatory approvals impacting time to market, and the emergence of generic and biosimilar competition. Supply chain disruptions can lead to drug shortages, while the development of highly specialized therapies requires significant investment and expertise. The intensity of competition among established and emerging players also presents a continuous challenge.
Emerging Opportunities in Posterior Segment Eye Diseases Industry
Several opportunities exist for growth in the posterior segment eye diseases industry. These include the development of personalized medicine approaches, the exploration of new therapeutic modalities such as gene therapy, and the expansion into emerging markets. The increased adoption of telehealth and remote monitoring technologies also presents new opportunities for delivering care and improving patient outcomes. The potential for developing less invasive and more effective treatment options remains significant.
Leading Players in the Posterior Segment Eye Diseases Industry Market
- Aerie Pharmaceuticals
- Rainbow Medical Ltd (Nano Retina)
- Second Sight Medical Products Inc
- Regeneron Pharmaceuticals Inc
- Novartis AG
- Merck & Co Inc
- Santen Pharmaceuticals
- Abbvie Inc (Allergen PLC)
- F Hoffmann-La Roche
- Alcon Inc
- Bausch Health Companies Inc
Key Developments in Posterior Segment Eye Diseases Industry
- June 2022: Amring Pharmaceuticals Inc. received US FDA approval for generic Timolol Maleate Ophthalmic Solution. This approval increased competition in the generic market for glaucoma treatments.
- April 2022: Sandoz launched a generic combination eyedrop (brimonidine tartrate/timolol maleate), increasing competition and potentially lowering prices for patients with ocular hypertension.
Future Outlook for Posterior Segment Eye Diseases Industry Market
The future outlook for the posterior segment eye diseases market is positive, driven by continuous innovation in treatment modalities, an expanding patient pool, and increased investment in research and development. The development of novel therapies, improved drug delivery systems, and the expansion into emerging markets promise substantial growth potential. Strategic collaborations and acquisitions will shape the competitive landscape and drive market consolidation in the coming years.
Posterior Segment Eye Diseases Industry Segmentation
-
1. Product
-
1.1. Drugs
- 1.1.1. Small Molecules
- 1.1.2. Biologics
-
1.2. Devices
- 1.2.1. Therapeutic Devices
- 1.2.2. Diagnostic Devices
-
1.1. Drugs
-
2. Application
- 2.1. Macular Degeneration
- 2.2. Glaucoma
- 2.3. Diabetic Retinopathy
- 2.4. Other Applications
Posterior Segment Eye Diseases Industry Segmentation By Geography
-
1. North America
- 1.1. United States
- 1.2. Canada
- 1.3. Mexico
-
2. Europe
- 2.1. Germany
- 2.2. United Kingdom
- 2.3. France
- 2.4. Italy
- 2.5. Spain
- 2.6. Rest of Europe
-
3. Asia Pacific
- 3.1. China
- 3.2. Japan
- 3.3. India
- 3.4. Australia
- 3.5. South Korea
- 3.6. Rest of Asia Pacific
-
4. Middle East and Africa
- 4.1. GCC
- 4.2. South Africa
- 4.3. Rest of Middle East and Africa
-
5. South America
- 5.1. Brazil
- 5.2. Argentina
- 5.3. Rest of South America
Posterior Segment Eye Diseases Industry REPORT HIGHLIGHTS
| Aspects | Details |
|---|---|
| Study Period | 2019-2033 |
| Base Year | 2024 |
| Estimated Year | 2025 |
| Forecast Period | 2025-2033 |
| Historical Period | 2019-2024 |
| Growth Rate | CAGR of 5.42% from 2019-2033 |
| Segmentation |
|
Table of Contents
- 1. Introduction
- 1.1. Research Scope
- 1.2. Market Segmentation
- 1.3. Research Methodology
- 1.4. Definitions and Assumptions
- 2. Executive Summary
- 2.1. Introduction
- 3. Market Dynamics
- 3.1. Introduction
- 3.2. Market Drivers
- 3.2.1. Increasing Burden of Back of the Eye Disorders; Growing R&D for New Therapies for the Treatment of Posterior Segment Eye Disorders
- 3.3. Market Restrains
- 3.3.1. Stringent Regulatory Policies
- 3.4. Market Trends
- 3.4.1. Small Molecules by Drugs Segment is Expected to Hold a Significant Market Share Over the Forecast Period
- 4. Market Factor Analysis
- 4.1. Porters Five Forces
- 4.2. Supply/Value Chain
- 4.3. PESTEL analysis
- 4.4. Market Entropy
- 4.5. Patent/Trademark Analysis
- 5. Global Posterior Segment Eye Diseases Industry Analysis, Insights and Forecast, 2019-2031
- 5.1. Market Analysis, Insights and Forecast - by Product
- 5.1.1. Drugs
- 5.1.1.1. Small Molecules
- 5.1.1.2. Biologics
- 5.1.2. Devices
- 5.1.2.1. Therapeutic Devices
- 5.1.2.2. Diagnostic Devices
- 5.1.1. Drugs
- 5.2. Market Analysis, Insights and Forecast - by Application
- 5.2.1. Macular Degeneration
- 5.2.2. Glaucoma
- 5.2.3. Diabetic Retinopathy
- 5.2.4. Other Applications
- 5.3. Market Analysis, Insights and Forecast - by Region
- 5.3.1. North America
- 5.3.2. Europe
- 5.3.3. Asia Pacific
- 5.3.4. Middle East and Africa
- 5.3.5. South America
- 5.1. Market Analysis, Insights and Forecast - by Product
- 6. North America Posterior Segment Eye Diseases Industry Analysis, Insights and Forecast, 2019-2031
- 6.1. Market Analysis, Insights and Forecast - by Product
- 6.1.1. Drugs
- 6.1.1.1. Small Molecules
- 6.1.1.2. Biologics
- 6.1.2. Devices
- 6.1.2.1. Therapeutic Devices
- 6.1.2.2. Diagnostic Devices
- 6.1.1. Drugs
- 6.2. Market Analysis, Insights and Forecast - by Application
- 6.2.1. Macular Degeneration
- 6.2.2. Glaucoma
- 6.2.3. Diabetic Retinopathy
- 6.2.4. Other Applications
- 6.1. Market Analysis, Insights and Forecast - by Product
- 7. Europe Posterior Segment Eye Diseases Industry Analysis, Insights and Forecast, 2019-2031
- 7.1. Market Analysis, Insights and Forecast - by Product
- 7.1.1. Drugs
- 7.1.1.1. Small Molecules
- 7.1.1.2. Biologics
- 7.1.2. Devices
- 7.1.2.1. Therapeutic Devices
- 7.1.2.2. Diagnostic Devices
- 7.1.1. Drugs
- 7.2. Market Analysis, Insights and Forecast - by Application
- 7.2.1. Macular Degeneration
- 7.2.2. Glaucoma
- 7.2.3. Diabetic Retinopathy
- 7.2.4. Other Applications
- 7.1. Market Analysis, Insights and Forecast - by Product
- 8. Asia Pacific Posterior Segment Eye Diseases Industry Analysis, Insights and Forecast, 2019-2031
- 8.1. Market Analysis, Insights and Forecast - by Product
- 8.1.1. Drugs
- 8.1.1.1. Small Molecules
- 8.1.1.2. Biologics
- 8.1.2. Devices
- 8.1.2.1. Therapeutic Devices
- 8.1.2.2. Diagnostic Devices
- 8.1.1. Drugs
- 8.2. Market Analysis, Insights and Forecast - by Application
- 8.2.1. Macular Degeneration
- 8.2.2. Glaucoma
- 8.2.3. Diabetic Retinopathy
- 8.2.4. Other Applications
- 8.1. Market Analysis, Insights and Forecast - by Product
- 9. Middle East and Africa Posterior Segment Eye Diseases Industry Analysis, Insights and Forecast, 2019-2031
- 9.1. Market Analysis, Insights and Forecast - by Product
- 9.1.1. Drugs
- 9.1.1.1. Small Molecules
- 9.1.1.2. Biologics
- 9.1.2. Devices
- 9.1.2.1. Therapeutic Devices
- 9.1.2.2. Diagnostic Devices
- 9.1.1. Drugs
- 9.2. Market Analysis, Insights and Forecast - by Application
- 9.2.1. Macular Degeneration
- 9.2.2. Glaucoma
- 9.2.3. Diabetic Retinopathy
- 9.2.4. Other Applications
- 9.1. Market Analysis, Insights and Forecast - by Product
- 10. South America Posterior Segment Eye Diseases Industry Analysis, Insights and Forecast, 2019-2031
- 10.1. Market Analysis, Insights and Forecast - by Product
- 10.1.1. Drugs
- 10.1.1.1. Small Molecules
- 10.1.1.2. Biologics
- 10.1.2. Devices
- 10.1.2.1. Therapeutic Devices
- 10.1.2.2. Diagnostic Devices
- 10.1.1. Drugs
- 10.2. Market Analysis, Insights and Forecast - by Application
- 10.2.1. Macular Degeneration
- 10.2.2. Glaucoma
- 10.2.3. Diabetic Retinopathy
- 10.2.4. Other Applications
- 10.1. Market Analysis, Insights and Forecast - by Product
- 11. North America Posterior Segment Eye Diseases Industry Analysis, Insights and Forecast, 2019-2031
- 11.1. Market Analysis, Insights and Forecast - By Country/Sub-region
- 11.1.1. undefined
- 12. Europe Posterior Segment Eye Diseases Industry Analysis, Insights and Forecast, 2019-2031
- 12.1. Market Analysis, Insights and Forecast - By Country/Sub-region
- 12.1.1. undefined
- 13. Asia Pacific Posterior Segment Eye Diseases Industry Analysis, Insights and Forecast, 2019-2031
- 13.1. Market Analysis, Insights and Forecast - By Country/Sub-region
- 13.1.1. undefined
- 14. Middle East and Africa Posterior Segment Eye Diseases Industry Analysis, Insights and Forecast, 2019-2031
- 14.1. Market Analysis, Insights and Forecast - By Country/Sub-region
- 14.1.1. undefined
- 15. South America Posterior Segment Eye Diseases Industry Analysis, Insights and Forecast, 2019-2031
- 15.1. Market Analysis, Insights and Forecast - By Country/Sub-region
- 15.1.1. undefined
- 16. Competitive Analysis
- 16.1. Global Market Share Analysis 2024
- 16.2. Company Profiles
- 16.2.1 Aerie Pharmaceuticals
- 16.2.1.1. Overview
- 16.2.1.2. Products
- 16.2.1.3. SWOT Analysis
- 16.2.1.4. Recent Developments
- 16.2.1.5. Financials (Based on Availability)
- 16.2.2 Rainbow Medical Ltd (Nano Retina)
- 16.2.2.1. Overview
- 16.2.2.2. Products
- 16.2.2.3. SWOT Analysis
- 16.2.2.4. Recent Developments
- 16.2.2.5. Financials (Based on Availability)
- 16.2.3 Second Sight Medical Products Inc
- 16.2.3.1. Overview
- 16.2.3.2. Products
- 16.2.3.3. SWOT Analysis
- 16.2.3.4. Recent Developments
- 16.2.3.5. Financials (Based on Availability)
- 16.2.4 Regeneron Pharmaceuticals Inc
- 16.2.4.1. Overview
- 16.2.4.2. Products
- 16.2.4.3. SWOT Analysis
- 16.2.4.4. Recent Developments
- 16.2.4.5. Financials (Based on Availability)
- 16.2.5 Novartis AG
- 16.2.5.1. Overview
- 16.2.5.2. Products
- 16.2.5.3. SWOT Analysis
- 16.2.5.4. Recent Developments
- 16.2.5.5. Financials (Based on Availability)
- 16.2.6 Merck & Co Inc
- 16.2.6.1. Overview
- 16.2.6.2. Products
- 16.2.6.3. SWOT Analysis
- 16.2.6.4. Recent Developments
- 16.2.6.5. Financials (Based on Availability)
- 16.2.7 Santen Pharmaceuticals
- 16.2.7.1. Overview
- 16.2.7.2. Products
- 16.2.7.3. SWOT Analysis
- 16.2.7.4. Recent Developments
- 16.2.7.5. Financials (Based on Availability)
- 16.2.8 Abbvie Inc (Allergen PLC)
- 16.2.8.1. Overview
- 16.2.8.2. Products
- 16.2.8.3. SWOT Analysis
- 16.2.8.4. Recent Developments
- 16.2.8.5. Financials (Based on Availability)
- 16.2.9 F Hoffmann-La Roche
- 16.2.9.1. Overview
- 16.2.9.2. Products
- 16.2.9.3. SWOT Analysis
- 16.2.9.4. Recent Developments
- 16.2.9.5. Financials (Based on Availability)
- 16.2.10 Alcon Inc
- 16.2.10.1. Overview
- 16.2.10.2. Products
- 16.2.10.3. SWOT Analysis
- 16.2.10.4. Recent Developments
- 16.2.10.5. Financials (Based on Availability)
- 16.2.11 Bausch Health Companies Inc
- 16.2.11.1. Overview
- 16.2.11.2. Products
- 16.2.11.3. SWOT Analysis
- 16.2.11.4. Recent Developments
- 16.2.11.5. Financials (Based on Availability)
- 16.2.1 Aerie Pharmaceuticals
List of Figures
- Figure 1: Global Posterior Segment Eye Diseases Industry Revenue Breakdown (Million, %) by Region 2024 & 2032
- Figure 2: Global Posterior Segment Eye Diseases Industry Volume Breakdown (K Unit, %) by Region 2024 & 2032
- Figure 3: North America Posterior Segment Eye Diseases Industry Revenue (Million), by Country 2024 & 2032
- Figure 4: North America Posterior Segment Eye Diseases Industry Volume (K Unit), by Country 2024 & 2032
- Figure 5: North America Posterior Segment Eye Diseases Industry Revenue Share (%), by Country 2024 & 2032
- Figure 6: North America Posterior Segment Eye Diseases Industry Volume Share (%), by Country 2024 & 2032
- Figure 7: Europe Posterior Segment Eye Diseases Industry Revenue (Million), by Country 2024 & 2032
- Figure 8: Europe Posterior Segment Eye Diseases Industry Volume (K Unit), by Country 2024 & 2032
- Figure 9: Europe Posterior Segment Eye Diseases Industry Revenue Share (%), by Country 2024 & 2032
- Figure 10: Europe Posterior Segment Eye Diseases Industry Volume Share (%), by Country 2024 & 2032
- Figure 11: Asia Pacific Posterior Segment Eye Diseases Industry Revenue (Million), by Country 2024 & 2032
- Figure 12: Asia Pacific Posterior Segment Eye Diseases Industry Volume (K Unit), by Country 2024 & 2032
- Figure 13: Asia Pacific Posterior Segment Eye Diseases Industry Revenue Share (%), by Country 2024 & 2032
- Figure 14: Asia Pacific Posterior Segment Eye Diseases Industry Volume Share (%), by Country 2024 & 2032
- Figure 15: Middle East and Africa Posterior Segment Eye Diseases Industry Revenue (Million), by Country 2024 & 2032
- Figure 16: Middle East and Africa Posterior Segment Eye Diseases Industry Volume (K Unit), by Country 2024 & 2032
- Figure 17: Middle East and Africa Posterior Segment Eye Diseases Industry Revenue Share (%), by Country 2024 & 2032
- Figure 18: Middle East and Africa Posterior Segment Eye Diseases Industry Volume Share (%), by Country 2024 & 2032
- Figure 19: South America Posterior Segment Eye Diseases Industry Revenue (Million), by Country 2024 & 2032
- Figure 20: South America Posterior Segment Eye Diseases Industry Volume (K Unit), by Country 2024 & 2032
- Figure 21: South America Posterior Segment Eye Diseases Industry Revenue Share (%), by Country 2024 & 2032
- Figure 22: South America Posterior Segment Eye Diseases Industry Volume Share (%), by Country 2024 & 2032
- Figure 23: North America Posterior Segment Eye Diseases Industry Revenue (Million), by Product 2024 & 2032
- Figure 24: North America Posterior Segment Eye Diseases Industry Volume (K Unit), by Product 2024 & 2032
- Figure 25: North America Posterior Segment Eye Diseases Industry Revenue Share (%), by Product 2024 & 2032
- Figure 26: North America Posterior Segment Eye Diseases Industry Volume Share (%), by Product 2024 & 2032
- Figure 27: North America Posterior Segment Eye Diseases Industry Revenue (Million), by Application 2024 & 2032
- Figure 28: North America Posterior Segment Eye Diseases Industry Volume (K Unit), by Application 2024 & 2032
- Figure 29: North America Posterior Segment Eye Diseases Industry Revenue Share (%), by Application 2024 & 2032
- Figure 30: North America Posterior Segment Eye Diseases Industry Volume Share (%), by Application 2024 & 2032
- Figure 31: North America Posterior Segment Eye Diseases Industry Revenue (Million), by Country 2024 & 2032
- Figure 32: North America Posterior Segment Eye Diseases Industry Volume (K Unit), by Country 2024 & 2032
- Figure 33: North America Posterior Segment Eye Diseases Industry Revenue Share (%), by Country 2024 & 2032
- Figure 34: North America Posterior Segment Eye Diseases Industry Volume Share (%), by Country 2024 & 2032
- Figure 35: Europe Posterior Segment Eye Diseases Industry Revenue (Million), by Product 2024 & 2032
- Figure 36: Europe Posterior Segment Eye Diseases Industry Volume (K Unit), by Product 2024 & 2032
- Figure 37: Europe Posterior Segment Eye Diseases Industry Revenue Share (%), by Product 2024 & 2032
- Figure 38: Europe Posterior Segment Eye Diseases Industry Volume Share (%), by Product 2024 & 2032
- Figure 39: Europe Posterior Segment Eye Diseases Industry Revenue (Million), by Application 2024 & 2032
- Figure 40: Europe Posterior Segment Eye Diseases Industry Volume (K Unit), by Application 2024 & 2032
- Figure 41: Europe Posterior Segment Eye Diseases Industry Revenue Share (%), by Application 2024 & 2032
- Figure 42: Europe Posterior Segment Eye Diseases Industry Volume Share (%), by Application 2024 & 2032
- Figure 43: Europe Posterior Segment Eye Diseases Industry Revenue (Million), by Country 2024 & 2032
- Figure 44: Europe Posterior Segment Eye Diseases Industry Volume (K Unit), by Country 2024 & 2032
- Figure 45: Europe Posterior Segment Eye Diseases Industry Revenue Share (%), by Country 2024 & 2032
- Figure 46: Europe Posterior Segment Eye Diseases Industry Volume Share (%), by Country 2024 & 2032
- Figure 47: Asia Pacific Posterior Segment Eye Diseases Industry Revenue (Million), by Product 2024 & 2032
- Figure 48: Asia Pacific Posterior Segment Eye Diseases Industry Volume (K Unit), by Product 2024 & 2032
- Figure 49: Asia Pacific Posterior Segment Eye Diseases Industry Revenue Share (%), by Product 2024 & 2032
- Figure 50: Asia Pacific Posterior Segment Eye Diseases Industry Volume Share (%), by Product 2024 & 2032
- Figure 51: Asia Pacific Posterior Segment Eye Diseases Industry Revenue (Million), by Application 2024 & 2032
- Figure 52: Asia Pacific Posterior Segment Eye Diseases Industry Volume (K Unit), by Application 2024 & 2032
- Figure 53: Asia Pacific Posterior Segment Eye Diseases Industry Revenue Share (%), by Application 2024 & 2032
- Figure 54: Asia Pacific Posterior Segment Eye Diseases Industry Volume Share (%), by Application 2024 & 2032
- Figure 55: Asia Pacific Posterior Segment Eye Diseases Industry Revenue (Million), by Country 2024 & 2032
- Figure 56: Asia Pacific Posterior Segment Eye Diseases Industry Volume (K Unit), by Country 2024 & 2032
- Figure 57: Asia Pacific Posterior Segment Eye Diseases Industry Revenue Share (%), by Country 2024 & 2032
- Figure 58: Asia Pacific Posterior Segment Eye Diseases Industry Volume Share (%), by Country 2024 & 2032
- Figure 59: Middle East and Africa Posterior Segment Eye Diseases Industry Revenue (Million), by Product 2024 & 2032
- Figure 60: Middle East and Africa Posterior Segment Eye Diseases Industry Volume (K Unit), by Product 2024 & 2032
- Figure 61: Middle East and Africa Posterior Segment Eye Diseases Industry Revenue Share (%), by Product 2024 & 2032
- Figure 62: Middle East and Africa Posterior Segment Eye Diseases Industry Volume Share (%), by Product 2024 & 2032
- Figure 63: Middle East and Africa Posterior Segment Eye Diseases Industry Revenue (Million), by Application 2024 & 2032
- Figure 64: Middle East and Africa Posterior Segment Eye Diseases Industry Volume (K Unit), by Application 2024 & 2032
- Figure 65: Middle East and Africa Posterior Segment Eye Diseases Industry Revenue Share (%), by Application 2024 & 2032
- Figure 66: Middle East and Africa Posterior Segment Eye Diseases Industry Volume Share (%), by Application 2024 & 2032
- Figure 67: Middle East and Africa Posterior Segment Eye Diseases Industry Revenue (Million), by Country 2024 & 2032
- Figure 68: Middle East and Africa Posterior Segment Eye Diseases Industry Volume (K Unit), by Country 2024 & 2032
- Figure 69: Middle East and Africa Posterior Segment Eye Diseases Industry Revenue Share (%), by Country 2024 & 2032
- Figure 70: Middle East and Africa Posterior Segment Eye Diseases Industry Volume Share (%), by Country 2024 & 2032
- Figure 71: South America Posterior Segment Eye Diseases Industry Revenue (Million), by Product 2024 & 2032
- Figure 72: South America Posterior Segment Eye Diseases Industry Volume (K Unit), by Product 2024 & 2032
- Figure 73: South America Posterior Segment Eye Diseases Industry Revenue Share (%), by Product 2024 & 2032
- Figure 74: South America Posterior Segment Eye Diseases Industry Volume Share (%), by Product 2024 & 2032
- Figure 75: South America Posterior Segment Eye Diseases Industry Revenue (Million), by Application 2024 & 2032
- Figure 76: South America Posterior Segment Eye Diseases Industry Volume (K Unit), by Application 2024 & 2032
- Figure 77: South America Posterior Segment Eye Diseases Industry Revenue Share (%), by Application 2024 & 2032
- Figure 78: South America Posterior Segment Eye Diseases Industry Volume Share (%), by Application 2024 & 2032
- Figure 79: South America Posterior Segment Eye Diseases Industry Revenue (Million), by Country 2024 & 2032
- Figure 80: South America Posterior Segment Eye Diseases Industry Volume (K Unit), by Country 2024 & 2032
- Figure 81: South America Posterior Segment Eye Diseases Industry Revenue Share (%), by Country 2024 & 2032
- Figure 82: South America Posterior Segment Eye Diseases Industry Volume Share (%), by Country 2024 & 2032
List of Tables
- Table 1: Global Posterior Segment Eye Diseases Industry Revenue Million Forecast, by Region 2019 & 2032
- Table 2: Global Posterior Segment Eye Diseases Industry Volume K Unit Forecast, by Region 2019 & 2032
- Table 3: Global Posterior Segment Eye Diseases Industry Revenue Million Forecast, by Product 2019 & 2032
- Table 4: Global Posterior Segment Eye Diseases Industry Volume K Unit Forecast, by Product 2019 & 2032
- Table 5: Global Posterior Segment Eye Diseases Industry Revenue Million Forecast, by Application 2019 & 2032
- Table 6: Global Posterior Segment Eye Diseases Industry Volume K Unit Forecast, by Application 2019 & 2032
- Table 7: Global Posterior Segment Eye Diseases Industry Revenue Million Forecast, by Region 2019 & 2032
- Table 8: Global Posterior Segment Eye Diseases Industry Volume K Unit Forecast, by Region 2019 & 2032
- Table 9: Global Posterior Segment Eye Diseases Industry Revenue Million Forecast, by Country 2019 & 2032
- Table 10: Global Posterior Segment Eye Diseases Industry Volume K Unit Forecast, by Country 2019 & 2032
- Table 11: Global Posterior Segment Eye Diseases Industry Revenue Million Forecast, by Country 2019 & 2032
- Table 12: Global Posterior Segment Eye Diseases Industry Volume K Unit Forecast, by Country 2019 & 2032
- Table 13: Global Posterior Segment Eye Diseases Industry Revenue Million Forecast, by Country 2019 & 2032
- Table 14: Global Posterior Segment Eye Diseases Industry Volume K Unit Forecast, by Country 2019 & 2032
- Table 15: Global Posterior Segment Eye Diseases Industry Revenue Million Forecast, by Country 2019 & 2032
- Table 16: Global Posterior Segment Eye Diseases Industry Volume K Unit Forecast, by Country 2019 & 2032
- Table 17: Global Posterior Segment Eye Diseases Industry Revenue Million Forecast, by Country 2019 & 2032
- Table 18: Global Posterior Segment Eye Diseases Industry Volume K Unit Forecast, by Country 2019 & 2032
- Table 19: Global Posterior Segment Eye Diseases Industry Revenue Million Forecast, by Product 2019 & 2032
- Table 20: Global Posterior Segment Eye Diseases Industry Volume K Unit Forecast, by Product 2019 & 2032
- Table 21: Global Posterior Segment Eye Diseases Industry Revenue Million Forecast, by Application 2019 & 2032
- Table 22: Global Posterior Segment Eye Diseases Industry Volume K Unit Forecast, by Application 2019 & 2032
- Table 23: Global Posterior Segment Eye Diseases Industry Revenue Million Forecast, by Country 2019 & 2032
- Table 24: Global Posterior Segment Eye Diseases Industry Volume K Unit Forecast, by Country 2019 & 2032
- Table 25: United States Posterior Segment Eye Diseases Industry Revenue (Million) Forecast, by Application 2019 & 2032
- Table 26: United States Posterior Segment Eye Diseases Industry Volume (K Unit) Forecast, by Application 2019 & 2032
- Table 27: Canada Posterior Segment Eye Diseases Industry Revenue (Million) Forecast, by Application 2019 & 2032
- Table 28: Canada Posterior Segment Eye Diseases Industry Volume (K Unit) Forecast, by Application 2019 & 2032
- Table 29: Mexico Posterior Segment Eye Diseases Industry Revenue (Million) Forecast, by Application 2019 & 2032
- Table 30: Mexico Posterior Segment Eye Diseases Industry Volume (K Unit) Forecast, by Application 2019 & 2032
- Table 31: Global Posterior Segment Eye Diseases Industry Revenue Million Forecast, by Product 2019 & 2032
- Table 32: Global Posterior Segment Eye Diseases Industry Volume K Unit Forecast, by Product 2019 & 2032
- Table 33: Global Posterior Segment Eye Diseases Industry Revenue Million Forecast, by Application 2019 & 2032
- Table 34: Global Posterior Segment Eye Diseases Industry Volume K Unit Forecast, by Application 2019 & 2032
- Table 35: Global Posterior Segment Eye Diseases Industry Revenue Million Forecast, by Country 2019 & 2032
- Table 36: Global Posterior Segment Eye Diseases Industry Volume K Unit Forecast, by Country 2019 & 2032
- Table 37: Germany Posterior Segment Eye Diseases Industry Revenue (Million) Forecast, by Application 2019 & 2032
- Table 38: Germany Posterior Segment Eye Diseases Industry Volume (K Unit) Forecast, by Application 2019 & 2032
- Table 39: United Kingdom Posterior Segment Eye Diseases Industry Revenue (Million) Forecast, by Application 2019 & 2032
- Table 40: United Kingdom Posterior Segment Eye Diseases Industry Volume (K Unit) Forecast, by Application 2019 & 2032
- Table 41: France Posterior Segment Eye Diseases Industry Revenue (Million) Forecast, by Application 2019 & 2032
- Table 42: France Posterior Segment Eye Diseases Industry Volume (K Unit) Forecast, by Application 2019 & 2032
- Table 43: Italy Posterior Segment Eye Diseases Industry Revenue (Million) Forecast, by Application 2019 & 2032
- Table 44: Italy Posterior Segment Eye Diseases Industry Volume (K Unit) Forecast, by Application 2019 & 2032
- Table 45: Spain Posterior Segment Eye Diseases Industry Revenue (Million) Forecast, by Application 2019 & 2032
- Table 46: Spain Posterior Segment Eye Diseases Industry Volume (K Unit) Forecast, by Application 2019 & 2032
- Table 47: Rest of Europe Posterior Segment Eye Diseases Industry Revenue (Million) Forecast, by Application 2019 & 2032
- Table 48: Rest of Europe Posterior Segment Eye Diseases Industry Volume (K Unit) Forecast, by Application 2019 & 2032
- Table 49: Global Posterior Segment Eye Diseases Industry Revenue Million Forecast, by Product 2019 & 2032
- Table 50: Global Posterior Segment Eye Diseases Industry Volume K Unit Forecast, by Product 2019 & 2032
- Table 51: Global Posterior Segment Eye Diseases Industry Revenue Million Forecast, by Application 2019 & 2032
- Table 52: Global Posterior Segment Eye Diseases Industry Volume K Unit Forecast, by Application 2019 & 2032
- Table 53: Global Posterior Segment Eye Diseases Industry Revenue Million Forecast, by Country 2019 & 2032
- Table 54: Global Posterior Segment Eye Diseases Industry Volume K Unit Forecast, by Country 2019 & 2032
- Table 55: China Posterior Segment Eye Diseases Industry Revenue (Million) Forecast, by Application 2019 & 2032
- Table 56: China Posterior Segment Eye Diseases Industry Volume (K Unit) Forecast, by Application 2019 & 2032
- Table 57: Japan Posterior Segment Eye Diseases Industry Revenue (Million) Forecast, by Application 2019 & 2032
- Table 58: Japan Posterior Segment Eye Diseases Industry Volume (K Unit) Forecast, by Application 2019 & 2032
- Table 59: India Posterior Segment Eye Diseases Industry Revenue (Million) Forecast, by Application 2019 & 2032
- Table 60: India Posterior Segment Eye Diseases Industry Volume (K Unit) Forecast, by Application 2019 & 2032
- Table 61: Australia Posterior Segment Eye Diseases Industry Revenue (Million) Forecast, by Application 2019 & 2032
- Table 62: Australia Posterior Segment Eye Diseases Industry Volume (K Unit) Forecast, by Application 2019 & 2032
- Table 63: South Korea Posterior Segment Eye Diseases Industry Revenue (Million) Forecast, by Application 2019 & 2032
- Table 64: South Korea Posterior Segment Eye Diseases Industry Volume (K Unit) Forecast, by Application 2019 & 2032
- Table 65: Rest of Asia Pacific Posterior Segment Eye Diseases Industry Revenue (Million) Forecast, by Application 2019 & 2032
- Table 66: Rest of Asia Pacific Posterior Segment Eye Diseases Industry Volume (K Unit) Forecast, by Application 2019 & 2032
- Table 67: Global Posterior Segment Eye Diseases Industry Revenue Million Forecast, by Product 2019 & 2032
- Table 68: Global Posterior Segment Eye Diseases Industry Volume K Unit Forecast, by Product 2019 & 2032
- Table 69: Global Posterior Segment Eye Diseases Industry Revenue Million Forecast, by Application 2019 & 2032
- Table 70: Global Posterior Segment Eye Diseases Industry Volume K Unit Forecast, by Application 2019 & 2032
- Table 71: Global Posterior Segment Eye Diseases Industry Revenue Million Forecast, by Country 2019 & 2032
- Table 72: Global Posterior Segment Eye Diseases Industry Volume K Unit Forecast, by Country 2019 & 2032
- Table 73: GCC Posterior Segment Eye Diseases Industry Revenue (Million) Forecast, by Application 2019 & 2032
- Table 74: GCC Posterior Segment Eye Diseases Industry Volume (K Unit) Forecast, by Application 2019 & 2032
- Table 75: South Africa Posterior Segment Eye Diseases Industry Revenue (Million) Forecast, by Application 2019 & 2032
- Table 76: South Africa Posterior Segment Eye Diseases Industry Volume (K Unit) Forecast, by Application 2019 & 2032
- Table 77: Rest of Middle East and Africa Posterior Segment Eye Diseases Industry Revenue (Million) Forecast, by Application 2019 & 2032
- Table 78: Rest of Middle East and Africa Posterior Segment Eye Diseases Industry Volume (K Unit) Forecast, by Application 2019 & 2032
- Table 79: Global Posterior Segment Eye Diseases Industry Revenue Million Forecast, by Product 2019 & 2032
- Table 80: Global Posterior Segment Eye Diseases Industry Volume K Unit Forecast, by Product 2019 & 2032
- Table 81: Global Posterior Segment Eye Diseases Industry Revenue Million Forecast, by Application 2019 & 2032
- Table 82: Global Posterior Segment Eye Diseases Industry Volume K Unit Forecast, by Application 2019 & 2032
- Table 83: Global Posterior Segment Eye Diseases Industry Revenue Million Forecast, by Country 2019 & 2032
- Table 84: Global Posterior Segment Eye Diseases Industry Volume K Unit Forecast, by Country 2019 & 2032
- Table 85: Brazil Posterior Segment Eye Diseases Industry Revenue (Million) Forecast, by Application 2019 & 2032
- Table 86: Brazil Posterior Segment Eye Diseases Industry Volume (K Unit) Forecast, by Application 2019 & 2032
- Table 87: Argentina Posterior Segment Eye Diseases Industry Revenue (Million) Forecast, by Application 2019 & 2032
- Table 88: Argentina Posterior Segment Eye Diseases Industry Volume (K Unit) Forecast, by Application 2019 & 2032
- Table 89: Rest of South America Posterior Segment Eye Diseases Industry Revenue (Million) Forecast, by Application 2019 & 2032
- Table 90: Rest of South America Posterior Segment Eye Diseases Industry Volume (K Unit) Forecast, by Application 2019 & 2032
Frequently Asked Questions
1. What is the projected Compound Annual Growth Rate (CAGR) of the Posterior Segment Eye Diseases Industry?
The projected CAGR is approximately 5.42%.
2. Which companies are prominent players in the Posterior Segment Eye Diseases Industry?
Key companies in the market include Aerie Pharmaceuticals, Rainbow Medical Ltd (Nano Retina), Second Sight Medical Products Inc, Regeneron Pharmaceuticals Inc, Novartis AG, Merck & Co Inc, Santen Pharmaceuticals, Abbvie Inc (Allergen PLC), F Hoffmann-La Roche, Alcon Inc, Bausch Health Companies Inc.
3. What are the main segments of the Posterior Segment Eye Diseases Industry?
The market segments include Product, Application.
4. Can you provide details about the market size?
The market size is estimated to be USD 32.12 Million as of 2022.
5. What are some drivers contributing to market growth?
Increasing Burden of Back of the Eye Disorders; Growing R&D for New Therapies for the Treatment of Posterior Segment Eye Disorders.
6. What are the notable trends driving market growth?
Small Molecules by Drugs Segment is Expected to Hold a Significant Market Share Over the Forecast Period.
7. Are there any restraints impacting market growth?
Stringent Regulatory Policies.
8. Can you provide examples of recent developments in the market?
In June 2022, Amring Pharmaceuticals Inc. (Amring) received the US FDA approval for generic Timolol Maleate Ophthalmic Solution, USP 0.5%, 60 pack of 0.3mL unit dose vials (AT3 rated generic equivalent of Timoptic in Ocudose).
9. What pricing options are available for accessing the report?
Pricing options include single-user, multi-user, and enterprise licenses priced at USD 4750, USD 5250, and USD 8750 respectively.
10. Is the market size provided in terms of value or volume?
The market size is provided in terms of value, measured in Million and volume, measured in K Unit.
11. Are there any specific market keywords associated with the report?
Yes, the market keyword associated with the report is "Posterior Segment Eye Diseases Industry," which aids in identifying and referencing the specific market segment covered.
12. How do I determine which pricing option suits my needs best?
The pricing options vary based on user requirements and access needs. Individual users may opt for single-user licenses, while businesses requiring broader access may choose multi-user or enterprise licenses for cost-effective access to the report.
13. Are there any additional resources or data provided in the Posterior Segment Eye Diseases Industry report?
While the report offers comprehensive insights, it's advisable to review the specific contents or supplementary materials provided to ascertain if additional resources or data are available.
14. How can I stay updated on further developments or reports in the Posterior Segment Eye Diseases Industry?
To stay informed about further developments, trends, and reports in the Posterior Segment Eye Diseases Industry, consider subscribing to industry newsletters, following relevant companies and organizations, or regularly checking reputable industry news sources and publications.
Methodology
Step 1 - Identification of Relevant Samples Size from Population Database


Step 2 - Approaches for Defining Global Market Size (Value, Volume* & Price*)

Note*: In applicable scenarios
Step 3 - Data Sources
Primary Research
- Web Analytics
- Survey Reports
- Research Institute
- Latest Research Reports
- Opinion Leaders
Secondary Research
- Annual Reports
- White Paper
- Latest Press Release
- Industry Association
- Paid Database
- Investor Presentations

Step 4 - Data Triangulation
Involves using different sources of information in order to increase the validity of a study
These sources are likely to be stakeholders in a program - participants, other researchers, program staff, other community members, and so on.
Then we put all data in single framework & apply various statistical tools to find out the dynamic on the market.
During the analysis stage, feedback from the stakeholder groups would be compared to determine areas of agreement as well as areas of divergence


