
Key Insights
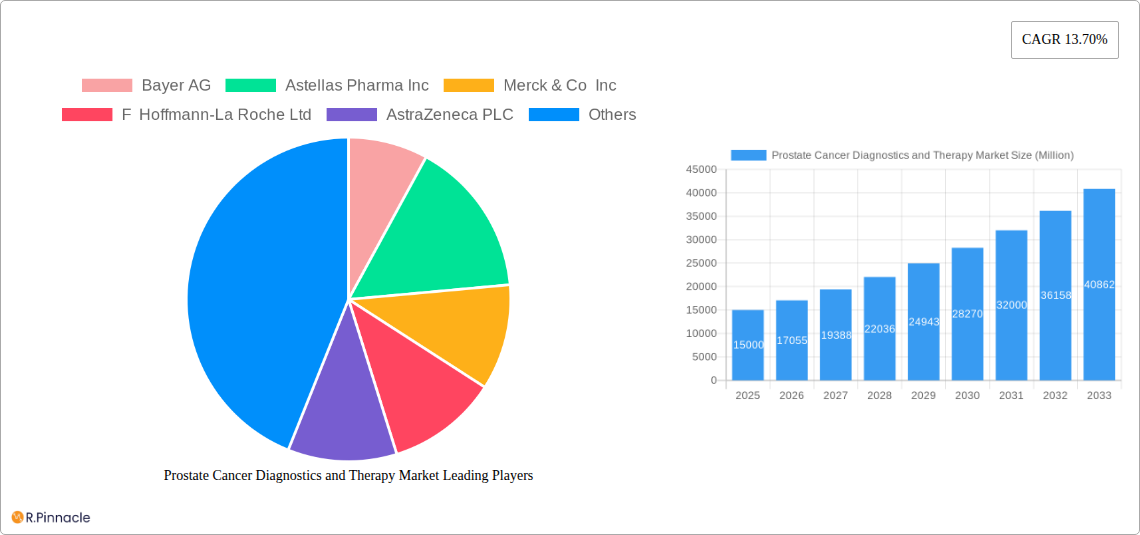
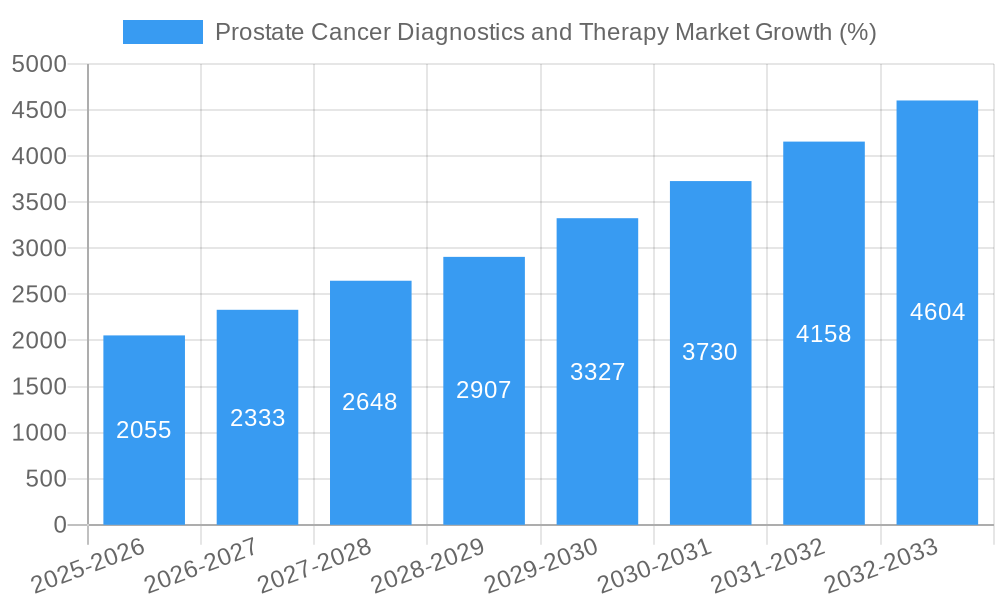
The global Prostate Cancer Diagnostics and Therapy market is experiencing robust growth, projected to reach a substantial size by 2033. A Compound Annual Growth Rate (CAGR) of 13.70% from 2025 to 2033 indicates a significant expansion driven by several key factors. The rising prevalence of prostate cancer, particularly in aging populations across North America, Europe, and Asia Pacific, fuels demand for advanced diagnostic tools and effective therapeutic interventions. Technological advancements in areas such as prostate-specific antigen (PSA) testing, improved imaging techniques (like MRI and PET scans offering earlier and more accurate detection), and the development of novel hormone therapies and targeted therapies are significantly contributing to market growth. Furthermore, increased awareness campaigns and improved healthcare infrastructure in developing economies are expanding access to diagnostic and treatment options, further propelling market expansion. However, high treatment costs, particularly for advanced therapies, and potential side effects associated with certain treatments pose challenges to market growth. The market segmentation reveals a strong focus on diagnostic modalities, including PSA testing, urine analysis, and advanced imaging. Therapeutic segments are dominated by hormone therapy and chemotherapy, with a growing interest in innovative treatment approaches.
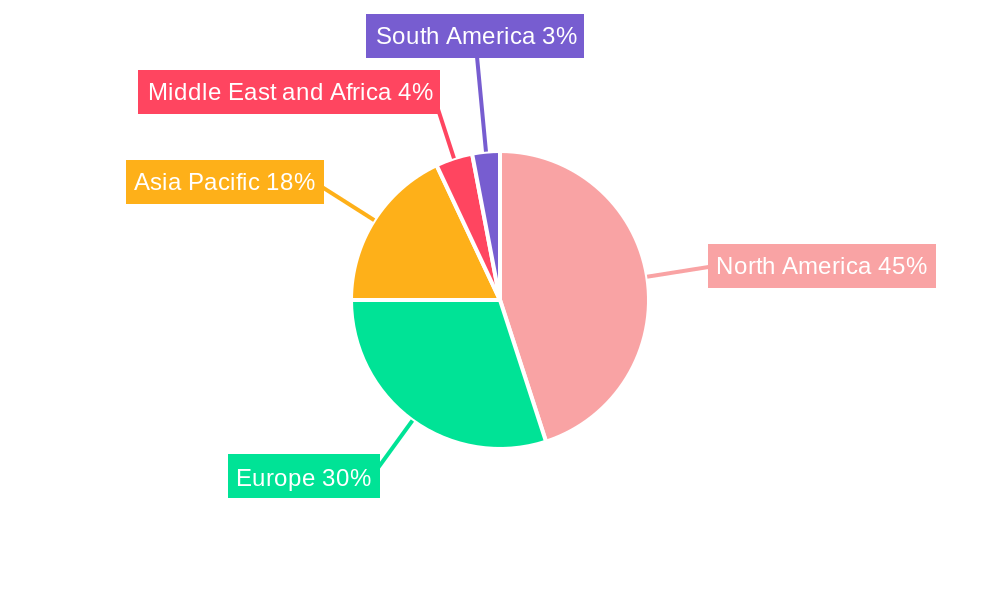
The market's geographical distribution shows a significant concentration in North America and Europe, primarily due to higher healthcare expenditure, advanced medical infrastructure, and a higher prevalence of prostate cancer. However, Asia Pacific is demonstrating rapid growth, driven by a rising geriatric population and increasing healthcare investments. Key players such as Bayer AG, Astellas Pharma Inc., Merck & Co. Inc., and others are heavily invested in research and development, aiming to improve diagnostic accuracy and develop more effective and less invasive treatment options. The competitive landscape is characterized by a mix of established pharmaceutical companies and medical device manufacturers, leading to ongoing innovation and expansion of treatment choices for prostate cancer patients. The forecast period (2025-2033) presents significant opportunities for growth, especially for companies focusing on targeted therapies, personalized medicine, and innovative diagnostic approaches that improve early detection and treatment outcomes.
Prostate Cancer Diagnostics and Therapy Market: A Comprehensive Report (2019-2033)
This in-depth report provides a comprehensive analysis of the Prostate Cancer Diagnostics and Therapy market, offering invaluable insights for industry professionals, investors, and researchers. The study period covers 2019-2033, with 2025 serving as the base and estimated year. The forecast period spans 2025-2033, and the historical period encompasses 2019-2024. Key players analyzed include Bayer AG, Astellas Pharma Inc, Merck & Co Inc, F Hoffmann-La Roche Ltd, AstraZeneca PLC, Abbvie Inc, Thermo Fisher Scientific, Koninklijke Philips NV, Johnson & Johnson Services Inc, Ipsen SA, Sanofi-Aventis, and Pfizer Inc.
Prostate Cancer Diagnostics and Therapy Market Structure & Innovation Trends
This section analyzes the market's competitive landscape, encompassing market concentration, innovation drivers, regulatory influences, substitute products, end-user demographics, and mergers and acquisitions (M&A) activity. The market exhibits a moderately consolidated structure, with several large multinational pharmaceutical and medical device companies holding significant market share. For example, the top five players collectively hold an estimated xx% market share in 2025. Innovation is primarily driven by advancements in diagnostic imaging technologies (e.g., multiparametric MRI, PSMA PET), development of novel therapeutics targeting specific cancer pathways, and improvements in personalized medicine approaches. Regulatory frameworks, including FDA approvals and reimbursement policies, significantly influence market dynamics. The presence of alternative therapies and treatment options creates competitive pressure. The end-user demographic predominantly comprises older men, with a growing emphasis on early detection and prevention strategies. M&A activity in the sector has been moderate, with deal values averaging approximately xx Million in recent years.
Prostate Cancer Diagnostics and Therapy Market Market Dynamics & Trends
The Prostate Cancer Diagnostics and Therapy market is characterized by robust growth, driven by several factors. The increasing prevalence of prostate cancer globally, coupled with rising awareness and improved diagnostic capabilities, fuels market expansion. Technological advancements, such as liquid biopsies and advanced imaging techniques, are transforming diagnostic practices and enhancing treatment efficacy. Furthermore, the shift towards personalized medicine, incorporating genetic and molecular profiling, is influencing treatment strategies and improving patient outcomes. However, high treatment costs and access barriers in certain regions present challenges. The market is expected to exhibit a CAGR of xx% during the forecast period (2025-2033), with market penetration for advanced diagnostic tools increasing from xx% in 2025 to xx% by 2033. Competitive dynamics are primarily driven by innovation, pricing strategies, and strategic partnerships.
Dominant Regions & Segments in Prostate Cancer Diagnostics and Therapy Market
North America currently holds the largest market share, driven by high healthcare expenditure, advanced infrastructure, and a higher prevalence of prostate cancer. Within the segments:
- Diagnosis: Diagnostic imaging (MRI, PET scans) is the fastest-growing segment due to increased accuracy and early detection capabilities. Prostate-specific antigen (PSA) testing remains a cornerstone diagnostic tool, although its limitations are increasingly recognized.
- Treatment: Hormone therapy continues to be a dominant treatment modality, although the emergence of novel targeted therapies is expanding treatment options and improving outcomes. Chemotherapy remains a significant treatment option for advanced stages of the disease.
- Type: Prostatic adenocarcinoma accounts for the vast majority of prostate cancer cases, driving the largest segment of the market.
Key drivers contributing to regional dominance include:
- North America: Robust healthcare infrastructure, high healthcare expenditure, and advanced research facilities.
- Europe: Well-established healthcare systems and increasing adoption of advanced diagnostic and therapeutic technologies.
- Asia-Pacific: Rising prevalence of prostate cancer and increasing healthcare investment.
Prostate Cancer Diagnostics and Therapy Market Product Innovations
Recent years have witnessed significant product innovations, including advancements in PSMA-targeted therapies (like Pluvicto, approved in March 2022), improved diagnostic imaging modalities, and the development of novel biomarkers for early detection. These innovations enhance diagnostic accuracy, improve treatment efficacy, and personalize treatment approaches, resulting in improved patient outcomes and a growing market. The trend towards minimally invasive procedures and personalized medicine further drives innovation.
Report Scope & Segmentation Analysis
The report segments the market by modality (diagnosis and treatment), clinical laboratory examinations (PSA testing, urine testing), diagnostic imaging, therapeutics (hormone therapy, chemotherapy, other treatments), and cancer type (benign prostatic hyperplasia, prostatic adenocarcinoma, small cell carcinoma, other types). Each segment's growth projections, market size, and competitive dynamics are meticulously analyzed. For instance, the diagnostic imaging segment is expected to witness significant growth owing to technological advancements. The prostatic adenocarcinoma segment dominates due to its high prevalence.
Key Drivers of Prostate Cancer Diagnostics and Therapy Market Growth
Several factors drive market growth:
- Rising Prostate Cancer Prevalence: The global incidence of prostate cancer continues to rise.
- Technological Advancements: Innovations in diagnostics and therapeutics.
- Increased Awareness and Early Detection: Improved screening and awareness programs lead to earlier diagnosis.
- Government Initiatives and Funding: Investment in research and development.
Challenges in the Prostate Cancer Diagnostics and Therapy Market Sector
Challenges include:
- High Treatment Costs: Financial barriers for patients and healthcare systems.
- Limited Access to Advanced Therapies: Unequal access in various regions.
- Regulatory Hurdles: Complex approval processes and reimbursement policies.
- Drug Resistance: Development of resistance to existing therapies.
Emerging Opportunities in Prostate Cancer Diagnostics and Therapy Market
Emerging opportunities include:
- Liquid Biopsies: Non-invasive diagnostic techniques for early detection and monitoring.
- Immunotherapy: Targeting immune responses for more effective treatment.
- Personalized Medicine: Tailoring treatment to individual patient characteristics.
- Telehealth and Remote Monitoring: Improving access to care, especially in underserved areas.
Leading Players in the Prostate Cancer Diagnostics and Therapy Market Market
- Bayer AG
- Astellas Pharma Inc
- Merck & Co Inc
- F Hoffmann-La Roche Ltd
- AstraZeneca PLC
- Abbvie Inc
- Thermo Fisher Scientific
- Koninklijke Philips NV
- Johnson & Johnson Services Inc
- Ipsen SA
- Sanofi-Aventis
- Pfizer Inc
Key Developments in Prostate Cancer Diagnostics and Therapy Market Industry
- April 2022: Launch of the Mount Sinai Robert F. Smith Mobile Prostate Cancer Screening Unit, improving access to screening, particularly within the Black community.
- March 2022: FDA approval of Novartis's Pluvicto for the treatment of PSMA-positive metastatic castration-resistant prostate cancer, marking a significant advancement in targeted therapy.
Future Outlook for Prostate Cancer Diagnostics and Therapy Market Market
The future of the Prostate Cancer Diagnostics and Therapy market is promising, driven by continuous innovation in diagnostics and therapeutics. The increasing prevalence of prostate cancer, coupled with technological advancements and a growing focus on early detection and personalized medicine, will fuel market expansion. Strategic partnerships, investments in R&D, and the development of novel therapies will further shape the market landscape, creating significant opportunities for growth and innovation in the coming years.
Prostate Cancer Diagnostics and Therapy Market Segmentation
-
1. Type
- 1.1. Benign Prostatic Hyperplasia
- 1.2. Prostatic Adenocarcinoma
- 1.3. Small Cell Carcinoma
- 1.4. Other Types
-
2. Modality
-
2.1. Diagnosis
- 2.1.1. Tissue Biopsy
- 2.1.2. Transrectal Ultrasound
-
2.1.3. Clinical Laboratory Examination
- 2.1.3.1. Prostate-specific Antigen Testing
- 2.1.3.2. Urine Testing
- 2.1.4. Diagnostic Imaging
-
2.2. Treatment
- 2.2.1. Surgery
- 2.2.2. Radiation Therapy
-
2.2.3. Therapeutics
- 2.2.3.1. Hormone Therapy
- 2.2.3.2. Chemotherapy
- 2.2.3.3. Other Treatments
-
2.1. Diagnosis
Prostate Cancer Diagnostics and Therapy Market Segmentation By Geography
-
1. North America
- 1.1. United States
- 1.2. Canada
- 1.3. Mexico
-
2. Europe
- 2.1. Germany
- 2.2. United Kingdom
- 2.3. France
- 2.4. Italy
- 2.5. Spain
- 2.6. Rest of Europe
-
3. Asia Pacific
- 3.1. China
- 3.2. Japan
- 3.3. India
- 3.4. Australia
- 3.5. South Korea
- 3.6. Rest of Asia Pacific
-
4. Middle East and Africa
- 4.1. GCC
- 4.2. South Africa
- 4.3. Rest of Middle East and Africa
-
5. South America
- 5.1. Brazil
- 5.2. Argentina
- 5.3. Rest of South America
Prostate Cancer Diagnostics and Therapy Market REPORT HIGHLIGHTS
| Aspects | Details |
|---|---|
| Study Period | 2019-2033 |
| Base Year | 2024 |
| Estimated Year | 2025 |
| Forecast Period | 2025-2033 |
| Historical Period | 2019-2024 |
| Growth Rate | CAGR of 13.70% from 2019-2033 |
| Segmentation |
|
Table of Contents
- 1. Introduction
- 1.1. Research Scope
- 1.2. Market Segmentation
- 1.3. Research Methodology
- 1.4. Definitions and Assumptions
- 2. Executive Summary
- 2.1. Introduction
- 3. Market Dynamics
- 3.1. Introduction
- 3.2. Market Drivers
- 3.2.1. Rising Aging Population and High Prevalence Rate of Prostate Cancer; Innovation in Drugs and Developments in Genomics and Proteomics; Increasing Government Initiatives for Cancer Awareness
- 3.3. Market Restrains
- 3.3.1. High Cost of Prostate Cancer Drugs; Low Success Rate of Clinical Trials
- 3.4. Market Trends
- 3.4.1. The Transrectal Ultrasound (TRUS) Segment is Expected to Grow at Rapid Pace Over the Forecast Period
- 4. Market Factor Analysis
- 4.1. Porters Five Forces
- 4.2. Supply/Value Chain
- 4.3. PESTEL analysis
- 4.4. Market Entropy
- 4.5. Patent/Trademark Analysis
- 5. Global Prostate Cancer Diagnostics and Therapy Market Analysis, Insights and Forecast, 2019-2031
- 5.1. Market Analysis, Insights and Forecast - by Type
- 5.1.1. Benign Prostatic Hyperplasia
- 5.1.2. Prostatic Adenocarcinoma
- 5.1.3. Small Cell Carcinoma
- 5.1.4. Other Types
- 5.2. Market Analysis, Insights and Forecast - by Modality
- 5.2.1. Diagnosis
- 5.2.1.1. Tissue Biopsy
- 5.2.1.2. Transrectal Ultrasound
- 5.2.1.3. Clinical Laboratory Examination
- 5.2.1.3.1. Prostate-specific Antigen Testing
- 5.2.1.3.2. Urine Testing
- 5.2.1.4. Diagnostic Imaging
- 5.2.2. Treatment
- 5.2.2.1. Surgery
- 5.2.2.2. Radiation Therapy
- 5.2.2.3. Therapeutics
- 5.2.2.3.1. Hormone Therapy
- 5.2.2.3.2. Chemotherapy
- 5.2.2.3.3. Other Treatments
- 5.2.1. Diagnosis
- 5.3. Market Analysis, Insights and Forecast - by Region
- 5.3.1. North America
- 5.3.2. Europe
- 5.3.3. Asia Pacific
- 5.3.4. Middle East and Africa
- 5.3.5. South America
- 5.1. Market Analysis, Insights and Forecast - by Type
- 6. North America Prostate Cancer Diagnostics and Therapy Market Analysis, Insights and Forecast, 2019-2031
- 6.1. Market Analysis, Insights and Forecast - by Type
- 6.1.1. Benign Prostatic Hyperplasia
- 6.1.2. Prostatic Adenocarcinoma
- 6.1.3. Small Cell Carcinoma
- 6.1.4. Other Types
- 6.2. Market Analysis, Insights and Forecast - by Modality
- 6.2.1. Diagnosis
- 6.2.1.1. Tissue Biopsy
- 6.2.1.2. Transrectal Ultrasound
- 6.2.1.3. Clinical Laboratory Examination
- 6.2.1.3.1. Prostate-specific Antigen Testing
- 6.2.1.3.2. Urine Testing
- 6.2.1.4. Diagnostic Imaging
- 6.2.2. Treatment
- 6.2.2.1. Surgery
- 6.2.2.2. Radiation Therapy
- 6.2.2.3. Therapeutics
- 6.2.2.3.1. Hormone Therapy
- 6.2.2.3.2. Chemotherapy
- 6.2.2.3.3. Other Treatments
- 6.2.1. Diagnosis
- 6.1. Market Analysis, Insights and Forecast - by Type
- 7. Europe Prostate Cancer Diagnostics and Therapy Market Analysis, Insights and Forecast, 2019-2031
- 7.1. Market Analysis, Insights and Forecast - by Type
- 7.1.1. Benign Prostatic Hyperplasia
- 7.1.2. Prostatic Adenocarcinoma
- 7.1.3. Small Cell Carcinoma
- 7.1.4. Other Types
- 7.2. Market Analysis, Insights and Forecast - by Modality
- 7.2.1. Diagnosis
- 7.2.1.1. Tissue Biopsy
- 7.2.1.2. Transrectal Ultrasound
- 7.2.1.3. Clinical Laboratory Examination
- 7.2.1.3.1. Prostate-specific Antigen Testing
- 7.2.1.3.2. Urine Testing
- 7.2.1.4. Diagnostic Imaging
- 7.2.2. Treatment
- 7.2.2.1. Surgery
- 7.2.2.2. Radiation Therapy
- 7.2.2.3. Therapeutics
- 7.2.2.3.1. Hormone Therapy
- 7.2.2.3.2. Chemotherapy
- 7.2.2.3.3. Other Treatments
- 7.2.1. Diagnosis
- 7.1. Market Analysis, Insights and Forecast - by Type
- 8. Asia Pacific Prostate Cancer Diagnostics and Therapy Market Analysis, Insights and Forecast, 2019-2031
- 8.1. Market Analysis, Insights and Forecast - by Type
- 8.1.1. Benign Prostatic Hyperplasia
- 8.1.2. Prostatic Adenocarcinoma
- 8.1.3. Small Cell Carcinoma
- 8.1.4. Other Types
- 8.2. Market Analysis, Insights and Forecast - by Modality
- 8.2.1. Diagnosis
- 8.2.1.1. Tissue Biopsy
- 8.2.1.2. Transrectal Ultrasound
- 8.2.1.3. Clinical Laboratory Examination
- 8.2.1.3.1. Prostate-specific Antigen Testing
- 8.2.1.3.2. Urine Testing
- 8.2.1.4. Diagnostic Imaging
- 8.2.2. Treatment
- 8.2.2.1. Surgery
- 8.2.2.2. Radiation Therapy
- 8.2.2.3. Therapeutics
- 8.2.2.3.1. Hormone Therapy
- 8.2.2.3.2. Chemotherapy
- 8.2.2.3.3. Other Treatments
- 8.2.1. Diagnosis
- 8.1. Market Analysis, Insights and Forecast - by Type
- 9. Middle East and Africa Prostate Cancer Diagnostics and Therapy Market Analysis, Insights and Forecast, 2019-2031
- 9.1. Market Analysis, Insights and Forecast - by Type
- 9.1.1. Benign Prostatic Hyperplasia
- 9.1.2. Prostatic Adenocarcinoma
- 9.1.3. Small Cell Carcinoma
- 9.1.4. Other Types
- 9.2. Market Analysis, Insights and Forecast - by Modality
- 9.2.1. Diagnosis
- 9.2.1.1. Tissue Biopsy
- 9.2.1.2. Transrectal Ultrasound
- 9.2.1.3. Clinical Laboratory Examination
- 9.2.1.3.1. Prostate-specific Antigen Testing
- 9.2.1.3.2. Urine Testing
- 9.2.1.4. Diagnostic Imaging
- 9.2.2. Treatment
- 9.2.2.1. Surgery
- 9.2.2.2. Radiation Therapy
- 9.2.2.3. Therapeutics
- 9.2.2.3.1. Hormone Therapy
- 9.2.2.3.2. Chemotherapy
- 9.2.2.3.3. Other Treatments
- 9.2.1. Diagnosis
- 9.1. Market Analysis, Insights and Forecast - by Type
- 10. South America Prostate Cancer Diagnostics and Therapy Market Analysis, Insights and Forecast, 2019-2031
- 10.1. Market Analysis, Insights and Forecast - by Type
- 10.1.1. Benign Prostatic Hyperplasia
- 10.1.2. Prostatic Adenocarcinoma
- 10.1.3. Small Cell Carcinoma
- 10.1.4. Other Types
- 10.2. Market Analysis, Insights and Forecast - by Modality
- 10.2.1. Diagnosis
- 10.2.1.1. Tissue Biopsy
- 10.2.1.2. Transrectal Ultrasound
- 10.2.1.3. Clinical Laboratory Examination
- 10.2.1.3.1. Prostate-specific Antigen Testing
- 10.2.1.3.2. Urine Testing
- 10.2.1.4. Diagnostic Imaging
- 10.2.2. Treatment
- 10.2.2.1. Surgery
- 10.2.2.2. Radiation Therapy
- 10.2.2.3. Therapeutics
- 10.2.2.3.1. Hormone Therapy
- 10.2.2.3.2. Chemotherapy
- 10.2.2.3.3. Other Treatments
- 10.2.1. Diagnosis
- 10.1. Market Analysis, Insights and Forecast - by Type
- 11. North America Prostate Cancer Diagnostics and Therapy Market Analysis, Insights and Forecast, 2019-2031
- 11.1. Market Analysis, Insights and Forecast - By Country/Sub-region
- 11.1.1 United States
- 11.1.2 Canada
- 11.1.3 Mexico
- 12. Europe Prostate Cancer Diagnostics and Therapy Market Analysis, Insights and Forecast, 2019-2031
- 12.1. Market Analysis, Insights and Forecast - By Country/Sub-region
- 12.1.1 Germany
- 12.1.2 United Kingdom
- 12.1.3 France
- 12.1.4 Italy
- 12.1.5 Spain
- 12.1.6 Rest of Europe
- 13. Asia Pacific Prostate Cancer Diagnostics and Therapy Market Analysis, Insights and Forecast, 2019-2031
- 13.1. Market Analysis, Insights and Forecast - By Country/Sub-region
- 13.1.1 China
- 13.1.2 Japan
- 13.1.3 India
- 13.1.4 Australia
- 13.1.5 South Korea
- 13.1.6 Rest of Asia Pacific
- 14. Middle East and Africa Prostate Cancer Diagnostics and Therapy Market Analysis, Insights and Forecast, 2019-2031
- 14.1. Market Analysis, Insights and Forecast - By Country/Sub-region
- 14.1.1 GCC
- 14.1.2 South Africa
- 14.1.3 Rest of Middle East and Africa
- 15. South America Prostate Cancer Diagnostics and Therapy Market Analysis, Insights and Forecast, 2019-2031
- 15.1. Market Analysis, Insights and Forecast - By Country/Sub-region
- 15.1.1 Brazil
- 15.1.2 Argentina
- 15.1.3 Rest of South America
- 16. Competitive Analysis
- 16.1. Global Market Share Analysis 2024
- 16.2. Company Profiles
- 16.2.1 Bayer AG
- 16.2.1.1. Overview
- 16.2.1.2. Products
- 16.2.1.3. SWOT Analysis
- 16.2.1.4. Recent Developments
- 16.2.1.5. Financials (Based on Availability)
- 16.2.2 Astellas Pharma Inc
- 16.2.2.1. Overview
- 16.2.2.2. Products
- 16.2.2.3. SWOT Analysis
- 16.2.2.4. Recent Developments
- 16.2.2.5. Financials (Based on Availability)
- 16.2.3 Merck & Co Inc
- 16.2.3.1. Overview
- 16.2.3.2. Products
- 16.2.3.3. SWOT Analysis
- 16.2.3.4. Recent Developments
- 16.2.3.5. Financials (Based on Availability)
- 16.2.4 F Hoffmann-La Roche Ltd
- 16.2.4.1. Overview
- 16.2.4.2. Products
- 16.2.4.3. SWOT Analysis
- 16.2.4.4. Recent Developments
- 16.2.4.5. Financials (Based on Availability)
- 16.2.5 AstraZeneca PLC
- 16.2.5.1. Overview
- 16.2.5.2. Products
- 16.2.5.3. SWOT Analysis
- 16.2.5.4. Recent Developments
- 16.2.5.5. Financials (Based on Availability)
- 16.2.6 Abbvie Inc
- 16.2.6.1. Overview
- 16.2.6.2. Products
- 16.2.6.3. SWOT Analysis
- 16.2.6.4. Recent Developments
- 16.2.6.5. Financials (Based on Availability)
- 16.2.7 Thermo Fisher Scientific
- 16.2.7.1. Overview
- 16.2.7.2. Products
- 16.2.7.3. SWOT Analysis
- 16.2.7.4. Recent Developments
- 16.2.7.5. Financials (Based on Availability)
- 16.2.8 Koninklijke Philips NV
- 16.2.8.1. Overview
- 16.2.8.2. Products
- 16.2.8.3. SWOT Analysis
- 16.2.8.4. Recent Developments
- 16.2.8.5. Financials (Based on Availability)
- 16.2.9 Johnson & Johnson Services Inc
- 16.2.9.1. Overview
- 16.2.9.2. Products
- 16.2.9.3. SWOT Analysis
- 16.2.9.4. Recent Developments
- 16.2.9.5. Financials (Based on Availability)
- 16.2.10 Ipsen SA
- 16.2.10.1. Overview
- 16.2.10.2. Products
- 16.2.10.3. SWOT Analysis
- 16.2.10.4. Recent Developments
- 16.2.10.5. Financials (Based on Availability)
- 16.2.11 Sanofi-Aventis
- 16.2.11.1. Overview
- 16.2.11.2. Products
- 16.2.11.3. SWOT Analysis
- 16.2.11.4. Recent Developments
- 16.2.11.5. Financials (Based on Availability)
- 16.2.12 Pfizer Inc
- 16.2.12.1. Overview
- 16.2.12.2. Products
- 16.2.12.3. SWOT Analysis
- 16.2.12.4. Recent Developments
- 16.2.12.5. Financials (Based on Availability)
- 16.2.1 Bayer AG
List of Figures
- Figure 1: Global Prostate Cancer Diagnostics and Therapy Market Revenue Breakdown (Million, %) by Region 2024 & 2032
- Figure 2: Global Prostate Cancer Diagnostics and Therapy Market Volume Breakdown (K Unit, %) by Region 2024 & 2032
- Figure 3: North America Prostate Cancer Diagnostics and Therapy Market Revenue (Million), by Country 2024 & 2032
- Figure 4: North America Prostate Cancer Diagnostics and Therapy Market Volume (K Unit), by Country 2024 & 2032
- Figure 5: North America Prostate Cancer Diagnostics and Therapy Market Revenue Share (%), by Country 2024 & 2032
- Figure 6: North America Prostate Cancer Diagnostics and Therapy Market Volume Share (%), by Country 2024 & 2032
- Figure 7: Europe Prostate Cancer Diagnostics and Therapy Market Revenue (Million), by Country 2024 & 2032
- Figure 8: Europe Prostate Cancer Diagnostics and Therapy Market Volume (K Unit), by Country 2024 & 2032
- Figure 9: Europe Prostate Cancer Diagnostics and Therapy Market Revenue Share (%), by Country 2024 & 2032
- Figure 10: Europe Prostate Cancer Diagnostics and Therapy Market Volume Share (%), by Country 2024 & 2032
- Figure 11: Asia Pacific Prostate Cancer Diagnostics and Therapy Market Revenue (Million), by Country 2024 & 2032
- Figure 12: Asia Pacific Prostate Cancer Diagnostics and Therapy Market Volume (K Unit), by Country 2024 & 2032
- Figure 13: Asia Pacific Prostate Cancer Diagnostics and Therapy Market Revenue Share (%), by Country 2024 & 2032
- Figure 14: Asia Pacific Prostate Cancer Diagnostics and Therapy Market Volume Share (%), by Country 2024 & 2032
- Figure 15: Middle East and Africa Prostate Cancer Diagnostics and Therapy Market Revenue (Million), by Country 2024 & 2032
- Figure 16: Middle East and Africa Prostate Cancer Diagnostics and Therapy Market Volume (K Unit), by Country 2024 & 2032
- Figure 17: Middle East and Africa Prostate Cancer Diagnostics and Therapy Market Revenue Share (%), by Country 2024 & 2032
- Figure 18: Middle East and Africa Prostate Cancer Diagnostics and Therapy Market Volume Share (%), by Country 2024 & 2032
- Figure 19: South America Prostate Cancer Diagnostics and Therapy Market Revenue (Million), by Country 2024 & 2032
- Figure 20: South America Prostate Cancer Diagnostics and Therapy Market Volume (K Unit), by Country 2024 & 2032
- Figure 21: South America Prostate Cancer Diagnostics and Therapy Market Revenue Share (%), by Country 2024 & 2032
- Figure 22: South America Prostate Cancer Diagnostics and Therapy Market Volume Share (%), by Country 2024 & 2032
- Figure 23: North America Prostate Cancer Diagnostics and Therapy Market Revenue (Million), by Type 2024 & 2032
- Figure 24: North America Prostate Cancer Diagnostics and Therapy Market Volume (K Unit), by Type 2024 & 2032
- Figure 25: North America Prostate Cancer Diagnostics and Therapy Market Revenue Share (%), by Type 2024 & 2032
- Figure 26: North America Prostate Cancer Diagnostics and Therapy Market Volume Share (%), by Type 2024 & 2032
- Figure 27: North America Prostate Cancer Diagnostics and Therapy Market Revenue (Million), by Modality 2024 & 2032
- Figure 28: North America Prostate Cancer Diagnostics and Therapy Market Volume (K Unit), by Modality 2024 & 2032
- Figure 29: North America Prostate Cancer Diagnostics and Therapy Market Revenue Share (%), by Modality 2024 & 2032
- Figure 30: North America Prostate Cancer Diagnostics and Therapy Market Volume Share (%), by Modality 2024 & 2032
- Figure 31: North America Prostate Cancer Diagnostics and Therapy Market Revenue (Million), by Country 2024 & 2032
- Figure 32: North America Prostate Cancer Diagnostics and Therapy Market Volume (K Unit), by Country 2024 & 2032
- Figure 33: North America Prostate Cancer Diagnostics and Therapy Market Revenue Share (%), by Country 2024 & 2032
- Figure 34: North America Prostate Cancer Diagnostics and Therapy Market Volume Share (%), by Country 2024 & 2032
- Figure 35: Europe Prostate Cancer Diagnostics and Therapy Market Revenue (Million), by Type 2024 & 2032
- Figure 36: Europe Prostate Cancer Diagnostics and Therapy Market Volume (K Unit), by Type 2024 & 2032
- Figure 37: Europe Prostate Cancer Diagnostics and Therapy Market Revenue Share (%), by Type 2024 & 2032
- Figure 38: Europe Prostate Cancer Diagnostics and Therapy Market Volume Share (%), by Type 2024 & 2032
- Figure 39: Europe Prostate Cancer Diagnostics and Therapy Market Revenue (Million), by Modality 2024 & 2032
- Figure 40: Europe Prostate Cancer Diagnostics and Therapy Market Volume (K Unit), by Modality 2024 & 2032
- Figure 41: Europe Prostate Cancer Diagnostics and Therapy Market Revenue Share (%), by Modality 2024 & 2032
- Figure 42: Europe Prostate Cancer Diagnostics and Therapy Market Volume Share (%), by Modality 2024 & 2032
- Figure 43: Europe Prostate Cancer Diagnostics and Therapy Market Revenue (Million), by Country 2024 & 2032
- Figure 44: Europe Prostate Cancer Diagnostics and Therapy Market Volume (K Unit), by Country 2024 & 2032
- Figure 45: Europe Prostate Cancer Diagnostics and Therapy Market Revenue Share (%), by Country 2024 & 2032
- Figure 46: Europe Prostate Cancer Diagnostics and Therapy Market Volume Share (%), by Country 2024 & 2032
- Figure 47: Asia Pacific Prostate Cancer Diagnostics and Therapy Market Revenue (Million), by Type 2024 & 2032
- Figure 48: Asia Pacific Prostate Cancer Diagnostics and Therapy Market Volume (K Unit), by Type 2024 & 2032
- Figure 49: Asia Pacific Prostate Cancer Diagnostics and Therapy Market Revenue Share (%), by Type 2024 & 2032
- Figure 50: Asia Pacific Prostate Cancer Diagnostics and Therapy Market Volume Share (%), by Type 2024 & 2032
- Figure 51: Asia Pacific Prostate Cancer Diagnostics and Therapy Market Revenue (Million), by Modality 2024 & 2032
- Figure 52: Asia Pacific Prostate Cancer Diagnostics and Therapy Market Volume (K Unit), by Modality 2024 & 2032
- Figure 53: Asia Pacific Prostate Cancer Diagnostics and Therapy Market Revenue Share (%), by Modality 2024 & 2032
- Figure 54: Asia Pacific Prostate Cancer Diagnostics and Therapy Market Volume Share (%), by Modality 2024 & 2032
- Figure 55: Asia Pacific Prostate Cancer Diagnostics and Therapy Market Revenue (Million), by Country 2024 & 2032
- Figure 56: Asia Pacific Prostate Cancer Diagnostics and Therapy Market Volume (K Unit), by Country 2024 & 2032
- Figure 57: Asia Pacific Prostate Cancer Diagnostics and Therapy Market Revenue Share (%), by Country 2024 & 2032
- Figure 58: Asia Pacific Prostate Cancer Diagnostics and Therapy Market Volume Share (%), by Country 2024 & 2032
- Figure 59: Middle East and Africa Prostate Cancer Diagnostics and Therapy Market Revenue (Million), by Type 2024 & 2032
- Figure 60: Middle East and Africa Prostate Cancer Diagnostics and Therapy Market Volume (K Unit), by Type 2024 & 2032
- Figure 61: Middle East and Africa Prostate Cancer Diagnostics and Therapy Market Revenue Share (%), by Type 2024 & 2032
- Figure 62: Middle East and Africa Prostate Cancer Diagnostics and Therapy Market Volume Share (%), by Type 2024 & 2032
- Figure 63: Middle East and Africa Prostate Cancer Diagnostics and Therapy Market Revenue (Million), by Modality 2024 & 2032
- Figure 64: Middle East and Africa Prostate Cancer Diagnostics and Therapy Market Volume (K Unit), by Modality 2024 & 2032
- Figure 65: Middle East and Africa Prostate Cancer Diagnostics and Therapy Market Revenue Share (%), by Modality 2024 & 2032
- Figure 66: Middle East and Africa Prostate Cancer Diagnostics and Therapy Market Volume Share (%), by Modality 2024 & 2032
- Figure 67: Middle East and Africa Prostate Cancer Diagnostics and Therapy Market Revenue (Million), by Country 2024 & 2032
- Figure 68: Middle East and Africa Prostate Cancer Diagnostics and Therapy Market Volume (K Unit), by Country 2024 & 2032
- Figure 69: Middle East and Africa Prostate Cancer Diagnostics and Therapy Market Revenue Share (%), by Country 2024 & 2032
- Figure 70: Middle East and Africa Prostate Cancer Diagnostics and Therapy Market Volume Share (%), by Country 2024 & 2032
- Figure 71: South America Prostate Cancer Diagnostics and Therapy Market Revenue (Million), by Type 2024 & 2032
- Figure 72: South America Prostate Cancer Diagnostics and Therapy Market Volume (K Unit), by Type 2024 & 2032
- Figure 73: South America Prostate Cancer Diagnostics and Therapy Market Revenue Share (%), by Type 2024 & 2032
- Figure 74: South America Prostate Cancer Diagnostics and Therapy Market Volume Share (%), by Type 2024 & 2032
- Figure 75: South America Prostate Cancer Diagnostics and Therapy Market Revenue (Million), by Modality 2024 & 2032
- Figure 76: South America Prostate Cancer Diagnostics and Therapy Market Volume (K Unit), by Modality 2024 & 2032
- Figure 77: South America Prostate Cancer Diagnostics and Therapy Market Revenue Share (%), by Modality 2024 & 2032
- Figure 78: South America Prostate Cancer Diagnostics and Therapy Market Volume Share (%), by Modality 2024 & 2032
- Figure 79: South America Prostate Cancer Diagnostics and Therapy Market Revenue (Million), by Country 2024 & 2032
- Figure 80: South America Prostate Cancer Diagnostics and Therapy Market Volume (K Unit), by Country 2024 & 2032
- Figure 81: South America Prostate Cancer Diagnostics and Therapy Market Revenue Share (%), by Country 2024 & 2032
- Figure 82: South America Prostate Cancer Diagnostics and Therapy Market Volume Share (%), by Country 2024 & 2032
List of Tables
- Table 1: Global Prostate Cancer Diagnostics and Therapy Market Revenue Million Forecast, by Region 2019 & 2032
- Table 2: Global Prostate Cancer Diagnostics and Therapy Market Volume K Unit Forecast, by Region 2019 & 2032
- Table 3: Global Prostate Cancer Diagnostics and Therapy Market Revenue Million Forecast, by Type 2019 & 2032
- Table 4: Global Prostate Cancer Diagnostics and Therapy Market Volume K Unit Forecast, by Type 2019 & 2032
- Table 5: Global Prostate Cancer Diagnostics and Therapy Market Revenue Million Forecast, by Modality 2019 & 2032
- Table 6: Global Prostate Cancer Diagnostics and Therapy Market Volume K Unit Forecast, by Modality 2019 & 2032
- Table 7: Global Prostate Cancer Diagnostics and Therapy Market Revenue Million Forecast, by Region 2019 & 2032
- Table 8: Global Prostate Cancer Diagnostics and Therapy Market Volume K Unit Forecast, by Region 2019 & 2032
- Table 9: Global Prostate Cancer Diagnostics and Therapy Market Revenue Million Forecast, by Country 2019 & 2032
- Table 10: Global Prostate Cancer Diagnostics and Therapy Market Volume K Unit Forecast, by Country 2019 & 2032
- Table 11: United States Prostate Cancer Diagnostics and Therapy Market Revenue (Million) Forecast, by Application 2019 & 2032
- Table 12: United States Prostate Cancer Diagnostics and Therapy Market Volume (K Unit) Forecast, by Application 2019 & 2032
- Table 13: Canada Prostate Cancer Diagnostics and Therapy Market Revenue (Million) Forecast, by Application 2019 & 2032
- Table 14: Canada Prostate Cancer Diagnostics and Therapy Market Volume (K Unit) Forecast, by Application 2019 & 2032
- Table 15: Mexico Prostate Cancer Diagnostics and Therapy Market Revenue (Million) Forecast, by Application 2019 & 2032
- Table 16: Mexico Prostate Cancer Diagnostics and Therapy Market Volume (K Unit) Forecast, by Application 2019 & 2032
- Table 17: Global Prostate Cancer Diagnostics and Therapy Market Revenue Million Forecast, by Country 2019 & 2032
- Table 18: Global Prostate Cancer Diagnostics and Therapy Market Volume K Unit Forecast, by Country 2019 & 2032
- Table 19: Germany Prostate Cancer Diagnostics and Therapy Market Revenue (Million) Forecast, by Application 2019 & 2032
- Table 20: Germany Prostate Cancer Diagnostics and Therapy Market Volume (K Unit) Forecast, by Application 2019 & 2032
- Table 21: United Kingdom Prostate Cancer Diagnostics and Therapy Market Revenue (Million) Forecast, by Application 2019 & 2032
- Table 22: United Kingdom Prostate Cancer Diagnostics and Therapy Market Volume (K Unit) Forecast, by Application 2019 & 2032
- Table 23: France Prostate Cancer Diagnostics and Therapy Market Revenue (Million) Forecast, by Application 2019 & 2032
- Table 24: France Prostate Cancer Diagnostics and Therapy Market Volume (K Unit) Forecast, by Application 2019 & 2032
- Table 25: Italy Prostate Cancer Diagnostics and Therapy Market Revenue (Million) Forecast, by Application 2019 & 2032
- Table 26: Italy Prostate Cancer Diagnostics and Therapy Market Volume (K Unit) Forecast, by Application 2019 & 2032
- Table 27: Spain Prostate Cancer Diagnostics and Therapy Market Revenue (Million) Forecast, by Application 2019 & 2032
- Table 28: Spain Prostate Cancer Diagnostics and Therapy Market Volume (K Unit) Forecast, by Application 2019 & 2032
- Table 29: Rest of Europe Prostate Cancer Diagnostics and Therapy Market Revenue (Million) Forecast, by Application 2019 & 2032
- Table 30: Rest of Europe Prostate Cancer Diagnostics and Therapy Market Volume (K Unit) Forecast, by Application 2019 & 2032
- Table 31: Global Prostate Cancer Diagnostics and Therapy Market Revenue Million Forecast, by Country 2019 & 2032
- Table 32: Global Prostate Cancer Diagnostics and Therapy Market Volume K Unit Forecast, by Country 2019 & 2032
- Table 33: China Prostate Cancer Diagnostics and Therapy Market Revenue (Million) Forecast, by Application 2019 & 2032
- Table 34: China Prostate Cancer Diagnostics and Therapy Market Volume (K Unit) Forecast, by Application 2019 & 2032
- Table 35: Japan Prostate Cancer Diagnostics and Therapy Market Revenue (Million) Forecast, by Application 2019 & 2032
- Table 36: Japan Prostate Cancer Diagnostics and Therapy Market Volume (K Unit) Forecast, by Application 2019 & 2032
- Table 37: India Prostate Cancer Diagnostics and Therapy Market Revenue (Million) Forecast, by Application 2019 & 2032
- Table 38: India Prostate Cancer Diagnostics and Therapy Market Volume (K Unit) Forecast, by Application 2019 & 2032
- Table 39: Australia Prostate Cancer Diagnostics and Therapy Market Revenue (Million) Forecast, by Application 2019 & 2032
- Table 40: Australia Prostate Cancer Diagnostics and Therapy Market Volume (K Unit) Forecast, by Application 2019 & 2032
- Table 41: South Korea Prostate Cancer Diagnostics and Therapy Market Revenue (Million) Forecast, by Application 2019 & 2032
- Table 42: South Korea Prostate Cancer Diagnostics and Therapy Market Volume (K Unit) Forecast, by Application 2019 & 2032
- Table 43: Rest of Asia Pacific Prostate Cancer Diagnostics and Therapy Market Revenue (Million) Forecast, by Application 2019 & 2032
- Table 44: Rest of Asia Pacific Prostate Cancer Diagnostics and Therapy Market Volume (K Unit) Forecast, by Application 2019 & 2032
- Table 45: Global Prostate Cancer Diagnostics and Therapy Market Revenue Million Forecast, by Country 2019 & 2032
- Table 46: Global Prostate Cancer Diagnostics and Therapy Market Volume K Unit Forecast, by Country 2019 & 2032
- Table 47: GCC Prostate Cancer Diagnostics and Therapy Market Revenue (Million) Forecast, by Application 2019 & 2032
- Table 48: GCC Prostate Cancer Diagnostics and Therapy Market Volume (K Unit) Forecast, by Application 2019 & 2032
- Table 49: South Africa Prostate Cancer Diagnostics and Therapy Market Revenue (Million) Forecast, by Application 2019 & 2032
- Table 50: South Africa Prostate Cancer Diagnostics and Therapy Market Volume (K Unit) Forecast, by Application 2019 & 2032
- Table 51: Rest of Middle East and Africa Prostate Cancer Diagnostics and Therapy Market Revenue (Million) Forecast, by Application 2019 & 2032
- Table 52: Rest of Middle East and Africa Prostate Cancer Diagnostics and Therapy Market Volume (K Unit) Forecast, by Application 2019 & 2032
- Table 53: Global Prostate Cancer Diagnostics and Therapy Market Revenue Million Forecast, by Country 2019 & 2032
- Table 54: Global Prostate Cancer Diagnostics and Therapy Market Volume K Unit Forecast, by Country 2019 & 2032
- Table 55: Brazil Prostate Cancer Diagnostics and Therapy Market Revenue (Million) Forecast, by Application 2019 & 2032
- Table 56: Brazil Prostate Cancer Diagnostics and Therapy Market Volume (K Unit) Forecast, by Application 2019 & 2032
- Table 57: Argentina Prostate Cancer Diagnostics and Therapy Market Revenue (Million) Forecast, by Application 2019 & 2032
- Table 58: Argentina Prostate Cancer Diagnostics and Therapy Market Volume (K Unit) Forecast, by Application 2019 & 2032
- Table 59: Rest of South America Prostate Cancer Diagnostics and Therapy Market Revenue (Million) Forecast, by Application 2019 & 2032
- Table 60: Rest of South America Prostate Cancer Diagnostics and Therapy Market Volume (K Unit) Forecast, by Application 2019 & 2032
- Table 61: Global Prostate Cancer Diagnostics and Therapy Market Revenue Million Forecast, by Type 2019 & 2032
- Table 62: Global Prostate Cancer Diagnostics and Therapy Market Volume K Unit Forecast, by Type 2019 & 2032
- Table 63: Global Prostate Cancer Diagnostics and Therapy Market Revenue Million Forecast, by Modality 2019 & 2032
- Table 64: Global Prostate Cancer Diagnostics and Therapy Market Volume K Unit Forecast, by Modality 2019 & 2032
- Table 65: Global Prostate Cancer Diagnostics and Therapy Market Revenue Million Forecast, by Country 2019 & 2032
- Table 66: Global Prostate Cancer Diagnostics and Therapy Market Volume K Unit Forecast, by Country 2019 & 2032
- Table 67: United States Prostate Cancer Diagnostics and Therapy Market Revenue (Million) Forecast, by Application 2019 & 2032
- Table 68: United States Prostate Cancer Diagnostics and Therapy Market Volume (K Unit) Forecast, by Application 2019 & 2032
- Table 69: Canada Prostate Cancer Diagnostics and Therapy Market Revenue (Million) Forecast, by Application 2019 & 2032
- Table 70: Canada Prostate Cancer Diagnostics and Therapy Market Volume (K Unit) Forecast, by Application 2019 & 2032
- Table 71: Mexico Prostate Cancer Diagnostics and Therapy Market Revenue (Million) Forecast, by Application 2019 & 2032
- Table 72: Mexico Prostate Cancer Diagnostics and Therapy Market Volume (K Unit) Forecast, by Application 2019 & 2032
- Table 73: Global Prostate Cancer Diagnostics and Therapy Market Revenue Million Forecast, by Type 2019 & 2032
- Table 74: Global Prostate Cancer Diagnostics and Therapy Market Volume K Unit Forecast, by Type 2019 & 2032
- Table 75: Global Prostate Cancer Diagnostics and Therapy Market Revenue Million Forecast, by Modality 2019 & 2032
- Table 76: Global Prostate Cancer Diagnostics and Therapy Market Volume K Unit Forecast, by Modality 2019 & 2032
- Table 77: Global Prostate Cancer Diagnostics and Therapy Market Revenue Million Forecast, by Country 2019 & 2032
- Table 78: Global Prostate Cancer Diagnostics and Therapy Market Volume K Unit Forecast, by Country 2019 & 2032
- Table 79: Germany Prostate Cancer Diagnostics and Therapy Market Revenue (Million) Forecast, by Application 2019 & 2032
- Table 80: Germany Prostate Cancer Diagnostics and Therapy Market Volume (K Unit) Forecast, by Application 2019 & 2032
- Table 81: United Kingdom Prostate Cancer Diagnostics and Therapy Market Revenue (Million) Forecast, by Application 2019 & 2032
- Table 82: United Kingdom Prostate Cancer Diagnostics and Therapy Market Volume (K Unit) Forecast, by Application 2019 & 2032
- Table 83: France Prostate Cancer Diagnostics and Therapy Market Revenue (Million) Forecast, by Application 2019 & 2032
- Table 84: France Prostate Cancer Diagnostics and Therapy Market Volume (K Unit) Forecast, by Application 2019 & 2032
- Table 85: Italy Prostate Cancer Diagnostics and Therapy Market Revenue (Million) Forecast, by Application 2019 & 2032
- Table 86: Italy Prostate Cancer Diagnostics and Therapy Market Volume (K Unit) Forecast, by Application 2019 & 2032
- Table 87: Spain Prostate Cancer Diagnostics and Therapy Market Revenue (Million) Forecast, by Application 2019 & 2032
- Table 88: Spain Prostate Cancer Diagnostics and Therapy Market Volume (K Unit) Forecast, by Application 2019 & 2032
- Table 89: Rest of Europe Prostate Cancer Diagnostics and Therapy Market Revenue (Million) Forecast, by Application 2019 & 2032
- Table 90: Rest of Europe Prostate Cancer Diagnostics and Therapy Market Volume (K Unit) Forecast, by Application 2019 & 2032
- Table 91: Global Prostate Cancer Diagnostics and Therapy Market Revenue Million Forecast, by Type 2019 & 2032
- Table 92: Global Prostate Cancer Diagnostics and Therapy Market Volume K Unit Forecast, by Type 2019 & 2032
- Table 93: Global Prostate Cancer Diagnostics and Therapy Market Revenue Million Forecast, by Modality 2019 & 2032
- Table 94: Global Prostate Cancer Diagnostics and Therapy Market Volume K Unit Forecast, by Modality 2019 & 2032
- Table 95: Global Prostate Cancer Diagnostics and Therapy Market Revenue Million Forecast, by Country 2019 & 2032
- Table 96: Global Prostate Cancer Diagnostics and Therapy Market Volume K Unit Forecast, by Country 2019 & 2032
- Table 97: China Prostate Cancer Diagnostics and Therapy Market Revenue (Million) Forecast, by Application 2019 & 2032
- Table 98: China Prostate Cancer Diagnostics and Therapy Market Volume (K Unit) Forecast, by Application 2019 & 2032
- Table 99: Japan Prostate Cancer Diagnostics and Therapy Market Revenue (Million) Forecast, by Application 2019 & 2032
- Table 100: Japan Prostate Cancer Diagnostics and Therapy Market Volume (K Unit) Forecast, by Application 2019 & 2032
- Table 101: India Prostate Cancer Diagnostics and Therapy Market Revenue (Million) Forecast, by Application 2019 & 2032
- Table 102: India Prostate Cancer Diagnostics and Therapy Market Volume (K Unit) Forecast, by Application 2019 & 2032
- Table 103: Australia Prostate Cancer Diagnostics and Therapy Market Revenue (Million) Forecast, by Application 2019 & 2032
- Table 104: Australia Prostate Cancer Diagnostics and Therapy Market Volume (K Unit) Forecast, by Application 2019 & 2032
- Table 105: South Korea Prostate Cancer Diagnostics and Therapy Market Revenue (Million) Forecast, by Application 2019 & 2032
- Table 106: South Korea Prostate Cancer Diagnostics and Therapy Market Volume (K Unit) Forecast, by Application 2019 & 2032
- Table 107: Rest of Asia Pacific Prostate Cancer Diagnostics and Therapy Market Revenue (Million) Forecast, by Application 2019 & 2032
- Table 108: Rest of Asia Pacific Prostate Cancer Diagnostics and Therapy Market Volume (K Unit) Forecast, by Application 2019 & 2032
- Table 109: Global Prostate Cancer Diagnostics and Therapy Market Revenue Million Forecast, by Type 2019 & 2032
- Table 110: Global Prostate Cancer Diagnostics and Therapy Market Volume K Unit Forecast, by Type 2019 & 2032
- Table 111: Global Prostate Cancer Diagnostics and Therapy Market Revenue Million Forecast, by Modality 2019 & 2032
- Table 112: Global Prostate Cancer Diagnostics and Therapy Market Volume K Unit Forecast, by Modality 2019 & 2032
- Table 113: Global Prostate Cancer Diagnostics and Therapy Market Revenue Million Forecast, by Country 2019 & 2032
- Table 114: Global Prostate Cancer Diagnostics and Therapy Market Volume K Unit Forecast, by Country 2019 & 2032
- Table 115: GCC Prostate Cancer Diagnostics and Therapy Market Revenue (Million) Forecast, by Application 2019 & 2032
- Table 116: GCC Prostate Cancer Diagnostics and Therapy Market Volume (K Unit) Forecast, by Application 2019 & 2032
- Table 117: South Africa Prostate Cancer Diagnostics and Therapy Market Revenue (Million) Forecast, by Application 2019 & 2032
- Table 118: South Africa Prostate Cancer Diagnostics and Therapy Market Volume (K Unit) Forecast, by Application 2019 & 2032
- Table 119: Rest of Middle East and Africa Prostate Cancer Diagnostics and Therapy Market Revenue (Million) Forecast, by Application 2019 & 2032
- Table 120: Rest of Middle East and Africa Prostate Cancer Diagnostics and Therapy Market Volume (K Unit) Forecast, by Application 2019 & 2032
- Table 121: Global Prostate Cancer Diagnostics and Therapy Market Revenue Million Forecast, by Type 2019 & 2032
- Table 122: Global Prostate Cancer Diagnostics and Therapy Market Volume K Unit Forecast, by Type 2019 & 2032
- Table 123: Global Prostate Cancer Diagnostics and Therapy Market Revenue Million Forecast, by Modality 2019 & 2032
- Table 124: Global Prostate Cancer Diagnostics and Therapy Market Volume K Unit Forecast, by Modality 2019 & 2032
- Table 125: Global Prostate Cancer Diagnostics and Therapy Market Revenue Million Forecast, by Country 2019 & 2032
- Table 126: Global Prostate Cancer Diagnostics and Therapy Market Volume K Unit Forecast, by Country 2019 & 2032
- Table 127: Brazil Prostate Cancer Diagnostics and Therapy Market Revenue (Million) Forecast, by Application 2019 & 2032
- Table 128: Brazil Prostate Cancer Diagnostics and Therapy Market Volume (K Unit) Forecast, by Application 2019 & 2032
- Table 129: Argentina Prostate Cancer Diagnostics and Therapy Market Revenue (Million) Forecast, by Application 2019 & 2032
- Table 130: Argentina Prostate Cancer Diagnostics and Therapy Market Volume (K Unit) Forecast, by Application 2019 & 2032
- Table 131: Rest of South America Prostate Cancer Diagnostics and Therapy Market Revenue (Million) Forecast, by Application 2019 & 2032
- Table 132: Rest of South America Prostate Cancer Diagnostics and Therapy Market Volume (K Unit) Forecast, by Application 2019 & 2032
Frequently Asked Questions
1. What is the projected Compound Annual Growth Rate (CAGR) of the Prostate Cancer Diagnostics and Therapy Market?
The projected CAGR is approximately 13.70%.
2. Which companies are prominent players in the Prostate Cancer Diagnostics and Therapy Market?
Key companies in the market include Bayer AG, Astellas Pharma Inc, Merck & Co Inc, F Hoffmann-La Roche Ltd, AstraZeneca PLC, Abbvie Inc, Thermo Fisher Scientific, Koninklijke Philips NV, Johnson & Johnson Services Inc, Ipsen SA, Sanofi-Aventis, Pfizer Inc.
3. What are the main segments of the Prostate Cancer Diagnostics and Therapy Market?
The market segments include Type, Modality.
4. Can you provide details about the market size?
The market size is estimated to be USD XX Million as of 2022.
5. What are some drivers contributing to market growth?
Rising Aging Population and High Prevalence Rate of Prostate Cancer; Innovation in Drugs and Developments in Genomics and Proteomics; Increasing Government Initiatives for Cancer Awareness.
6. What are the notable trends driving market growth?
The Transrectal Ultrasound (TRUS) Segment is Expected to Grow at Rapid Pace Over the Forecast Period.
7. Are there any restraints impacting market growth?
High Cost of Prostate Cancer Drugs; Low Success Rate of Clinical Trials.
8. Can you provide examples of recent developments in the market?
In April 2022, the Milton and Carroll Petrie Department of Urology at Mount Sinai launched the Mount Sinai Robert F. Smith Mobile Prostate Cancer Screening Unit to support prostate health in the Black community.
9. What pricing options are available for accessing the report?
Pricing options include single-user, multi-user, and enterprise licenses priced at USD 4750, USD 5250, and USD 8750 respectively.
10. Is the market size provided in terms of value or volume?
The market size is provided in terms of value, measured in Million and volume, measured in K Unit.
11. Are there any specific market keywords associated with the report?
Yes, the market keyword associated with the report is "Prostate Cancer Diagnostics and Therapy Market," which aids in identifying and referencing the specific market segment covered.
12. How do I determine which pricing option suits my needs best?
The pricing options vary based on user requirements and access needs. Individual users may opt for single-user licenses, while businesses requiring broader access may choose multi-user or enterprise licenses for cost-effective access to the report.
13. Are there any additional resources or data provided in the Prostate Cancer Diagnostics and Therapy Market report?
While the report offers comprehensive insights, it's advisable to review the specific contents or supplementary materials provided to ascertain if additional resources or data are available.
14. How can I stay updated on further developments or reports in the Prostate Cancer Diagnostics and Therapy Market?
To stay informed about further developments, trends, and reports in the Prostate Cancer Diagnostics and Therapy Market, consider subscribing to industry newsletters, following relevant companies and organizations, or regularly checking reputable industry news sources and publications.
Methodology
Step 1 - Identification of Relevant Samples Size from Population Database


Step 2 - Approaches for Defining Global Market Size (Value, Volume* & Price*)

Note*: In applicable scenarios
Step 3 - Data Sources
Primary Research
- Web Analytics
- Survey Reports
- Research Institute
- Latest Research Reports
- Opinion Leaders
Secondary Research
- Annual Reports
- White Paper
- Latest Press Release
- Industry Association
- Paid Database
- Investor Presentations

Step 4 - Data Triangulation
Involves using different sources of information in order to increase the validity of a study
These sources are likely to be stakeholders in a program - participants, other researchers, program staff, other community members, and so on.
Then we put all data in single framework & apply various statistical tools to find out the dynamic on the market.
During the analysis stage, feedback from the stakeholder groups would be compared to determine areas of agreement as well as areas of divergence


