
Key Insights
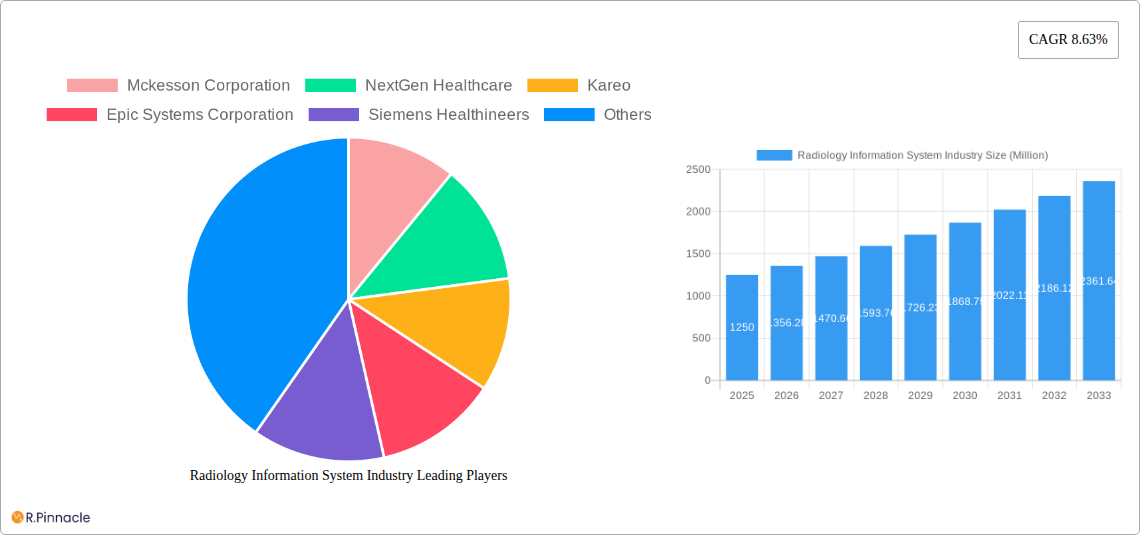
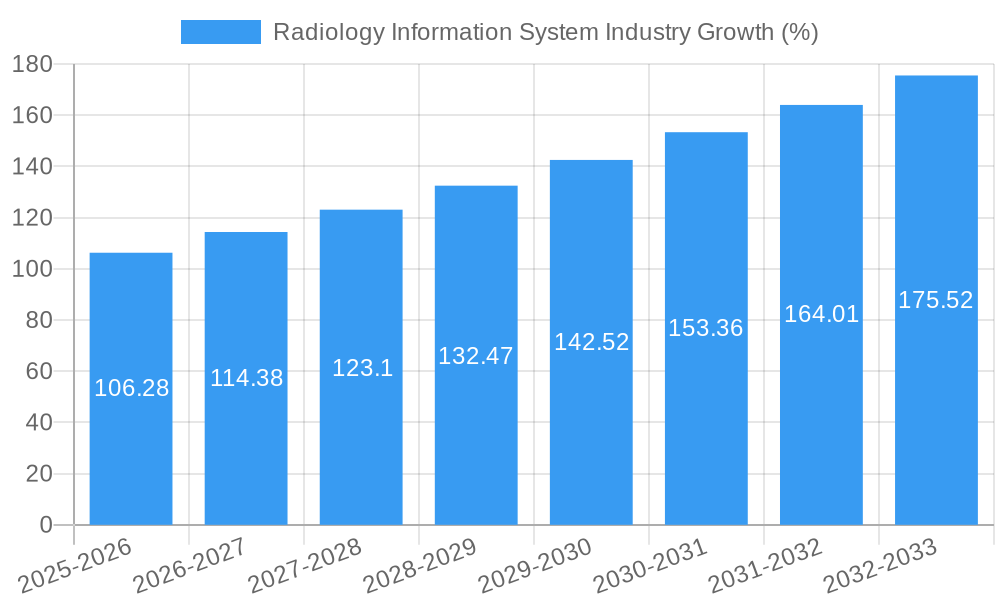
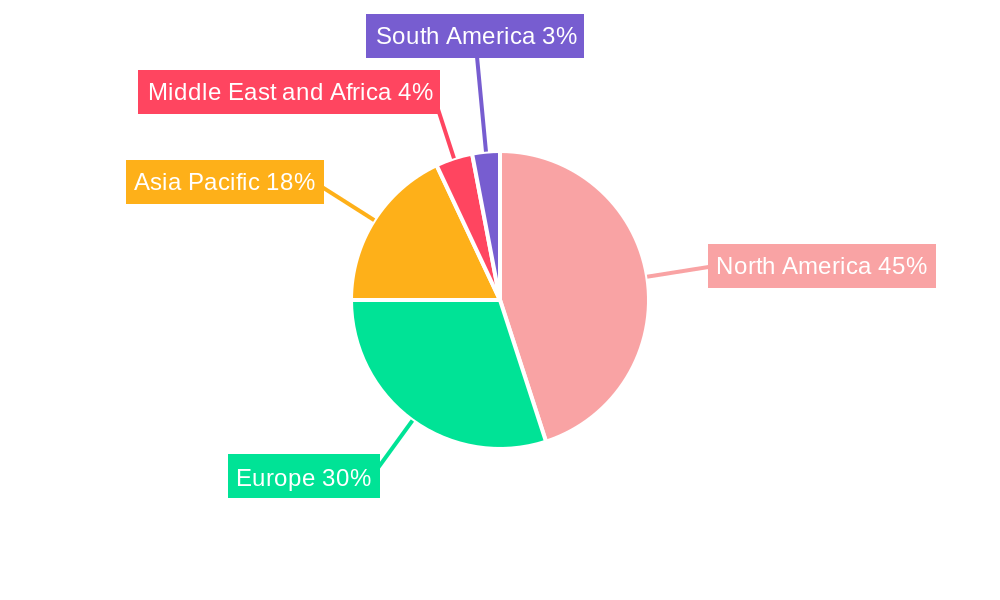
The Radiology Information System (RIS) market, valued at $1.25 billion in 2025, is projected to experience robust growth, driven by several key factors. The increasing adoption of digital imaging technologies in healthcare facilities necessitates efficient systems for managing patient data, image storage, and workflow optimization. This demand fuels the growth of RIS, which streamlines radiology departments, improves diagnostic accuracy, and enhances operational efficiency. Furthermore, the rising prevalence of chronic diseases necessitates increased diagnostic imaging procedures, thus boosting the need for robust RIS solutions. The shift towards cloud-based RIS deployments is a significant trend, offering scalability, cost-effectiveness, and improved accessibility. However, concerns regarding data security and interoperability with existing healthcare IT infrastructure remain key restraints. The market is segmented by system type (integrated vs. stand-alone), deployment mode (on-premise vs. cloud-based), and component (hardware, software, services). North America currently holds a significant market share due to advanced healthcare infrastructure and high adoption rates of digital technologies. However, the Asia-Pacific region is expected to witness significant growth in the coming years, driven by increasing healthcare investments and rising healthcare expenditure. Competition within the market is intense, with major players like McKesson, Siemens Healthineers, and Epic Systems competing with smaller, specialized vendors, creating a dynamic market landscape. The forecast period of 2025-2033 anticipates continued expansion based on ongoing technological advancements, expanding healthcare infrastructure globally, and the increasing focus on improving patient care through efficient data management.
The competitive landscape is marked by a mix of established players and emerging companies, leading to continuous innovation in RIS offerings. The development of AI-powered diagnostic tools integrated within RIS platforms is a rapidly evolving trend. These AI capabilities can assist radiologists in faster interpretation, improving diagnostic accuracy and patient care outcomes. Furthermore, regulatory changes and increasing focus on healthcare data privacy are impacting market dynamics, pushing vendors to adopt robust cybersecurity measures and ensure compliance with data protection regulations. Government initiatives promoting digital healthcare transformation in various regions also contribute to the overall market growth. The long-term outlook for the RIS market remains positive, with significant opportunities for growth in developing economies and further integration with other healthcare IT systems, such as Electronic Health Records (EHRs) and Picture Archiving and Communication Systems (PACS).
Radiology Information System (RIS) Market Report: 2019-2033
This comprehensive report provides a detailed analysis of the Radiology Information System (RIS) industry, offering invaluable insights for industry professionals, investors, and stakeholders. The report covers market size, segmentation, leading players, innovation trends, and future growth projections from 2019 to 2033, with a focus on the estimated year 2025. The study period is 2019-2033, the base year is 2025, the estimated year is 2025, and the forecast period is 2025-2033. The historical period covered is 2019-2024. The total market value is projected to reach xx Million by 2033.
Radiology Information System Industry Market Structure & Innovation Trends
The Radiology Information System (RIS) market is moderately concentrated, with key players like McKesson Corporation, Epic Systems Corporation, and Siemens Healthineers holding significant market share. The exact market share distribution for 2025 is currently being finalized and will be xx%. However, competitive intensity remains high due to ongoing innovation and the entry of new players. Innovation is driven by the increasing demand for improved image management, workflow optimization, and integration with other healthcare IT systems. Regulatory frameworks, such as HIPAA and GDPR, significantly influence RIS development and adoption. The market sees continuous M&A activity, with deal values reaching xx Million in recent years. Substitute technologies, such as cloud-based solutions, are increasingly impacting the traditional on-premise RIS market. The end-user demographics are primarily hospitals, radiology clinics, and imaging centers, with a growing focus on telehealth integration.
- Key Players: McKesson Corporation, Epic Systems Corporation, Siemens Healthineers, GE Healthcare, Cerner Corporation, Koninklijke Philips NV, and others.
- Market Concentration: Moderately concentrated, with top players holding xx% of market share (2025 estimate).
- M&A Activity: Significant activity in recent years, with total deal values exceeding xx Million.
Radiology Information System Industry Market Dynamics & Trends
The RIS market is experiencing robust growth, driven by factors such as the rising prevalence of chronic diseases, increasing demand for advanced imaging technologies, and the growing adoption of electronic health records (EHRs). The Compound Annual Growth Rate (CAGR) for the forecast period (2025-2033) is estimated at xx%. Technological disruptions, such as artificial intelligence (AI) and machine learning (ML) integration, are transforming RIS capabilities. Consumer preferences are shifting towards cloud-based solutions and user-friendly interfaces. Competitive dynamics are shaped by product differentiation, pricing strategies, and strategic partnerships. Market penetration of cloud-based RIS solutions is projected to reach xx% by 2033. The market is also influenced by government initiatives promoting digital healthcare transformation and the increasing focus on value-based care.
Dominant Regions & Segments in Radiology Information System Industry
North America currently dominates the RIS market, driven by factors like high healthcare expenditure, advanced technological infrastructure, and a strong regulatory environment. Within North America, the United States holds the largest market share.
- Leading Region: North America
- Leading Segment (Type): Integrated Radiology Information Systems are experiencing faster growth due to their comprehensive capabilities.
- Leading Segment (Deployment Mode): Cloud-based RIS is gaining traction due to scalability and cost-effectiveness. On-premise deployments still maintain a significant share due to security concerns.
- Leading Segment (Component): Software is the largest component, followed by services and hardware.
Key Drivers:
- North America: High healthcare spending, advanced technology adoption, robust regulatory framework.
- Europe: Increasing investments in healthcare IT infrastructure, growing adoption of digital health initiatives.
- Asia Pacific: Rising healthcare expenditure, increasing prevalence of chronic diseases, government support for healthcare modernization.
Radiology Information System Industry Product Innovations
Recent product developments focus on enhancing image management, workflow efficiency, and integration capabilities. The integration of AI and ML for automated image analysis and reporting is a key trend. Vendors are also focusing on developing user-friendly interfaces and mobile accessibility to improve radiologist productivity. These innovations offer competitive advantages through improved diagnostic accuracy, reduced operational costs, and enhanced patient care.
Report Scope & Segmentation Analysis
This report segments the RIS market based on type (Integrated, Stand-alone), deployment mode (On-premise, Cloud-based), and component (Hardware, Software, Services). Each segment's growth projections, market sizes, and competitive dynamics are analyzed. For instance, the cloud-based RIS segment is expected to exhibit a higher CAGR compared to on-premise solutions due to increasing demand for flexible and scalable solutions. The software component is projected to hold the largest market share, driven by the increasing demand for advanced features and functionalities.
Key Drivers of Radiology Information System Industry Growth
The RIS market growth is propelled by several factors, including: the increasing prevalence of chronic diseases leading to a higher demand for diagnostic imaging, the rising adoption of EHRs requiring seamless integration with RIS, and government initiatives promoting the digitization of healthcare records and improved patient care. Technological advancements in AI and ML are also crucial, enabling improved image analysis and workflow automation.
Challenges in the Radiology Information System Industry Sector
Challenges include the high initial investment costs for implementing RIS systems, the complexity of integrating RIS with existing healthcare IT infrastructure, and data security and privacy concerns related to handling sensitive patient information. Furthermore, ensuring regulatory compliance across various jurisdictions can also pose significant challenges. The competitive landscape also presents a challenge, necessitating continuous innovation and strategic partnerships. These factors, if not effectively addressed, can hinder market growth.
Emerging Opportunities in Radiology Information System Industry
Emerging opportunities lie in the expansion of telehealth services and the increasing demand for remote diagnostic capabilities. The integration of AI and ML into RIS systems offers vast potential for improving diagnostic accuracy and efficiency. The increasing adoption of cloud-based solutions provides opportunities for scalability and cost-effectiveness. Finally, the growth of specialized RIS solutions for specific radiology modalities represents a significant opportunity.
Leading Players in the Radiology Information System Industry Market
- Mckesson Corporation
- NextGen Healthcare
- Kareo
- Epic Systems Corporation
- Siemens Healthineers
- GE Healthcare
- Varian Medical Systems Inc
- IBM (Merge Healthcare Incorporated)
- Cerner Corporation
- Koninklijke Philips NV
- Medinformatix Inc
- Allscripts Healthcare Solutions Inc
- patientNOW Inc
- Konica Minolta Healthcare Americas Inc
- Practice Fusion
Key Developments in Radiology Information System Industry
- March 2022: Intelerad Medical Systems launched the Enterprise Imaging and Informatics Suite at HIMSS22, offering a new medical image management option.
- February 2022: Carestream Health India launched the DRX Compass, a digital radiology solution enhancing radiologist efficiency.
Future Outlook for Radiology Information System Industry Market
The RIS market is poised for continued growth, driven by technological advancements, increasing adoption of cloud-based solutions, and the expanding demand for efficient image management. Strategic partnerships and collaborations will play a significant role in shaping the future market landscape. The focus on AI-powered solutions and improved user experience will further accelerate market expansion, providing significant opportunities for both established players and new entrants.
Radiology Information System Industry Segmentation
-
1. Type
- 1.1. Integrated Radiology Information System
- 1.2. Stand-alone Radiology Information System
-
2. Deployment Mode
- 2.1. On-premise
- 2.2. Cloud-based
-
3. Component
- 3.1. Hardware
- 3.2. Software
- 3.3. Services
Radiology Information System Industry Segmentation By Geography
-
1. North America
- 1.1. United States
- 1.2. Canada
- 1.3. Mexico
-
2. Europe
- 2.1. Germany
- 2.2. United Kingdom
- 2.3. France
- 2.4. Italy
- 2.5. Spain
- 2.6. Rest of Europe
-
3. Asia Pacific
- 3.1. China
- 3.2. Japan
- 3.3. India
- 3.4. Australia
- 3.5. South Korea
- 3.6. Rest of Asia Pacific
-
4. Middle East and Africa
- 4.1. GCC
- 4.2. South Africa
- 4.3. Rest of Middle East and Africa
-
5. South America
- 5.1. Brazil
- 5.2. Argentina
- 5.3. Rest of South America
Radiology Information System Industry REPORT HIGHLIGHTS
| Aspects | Details |
|---|---|
| Study Period | 2019-2033 |
| Base Year | 2024 |
| Estimated Year | 2025 |
| Forecast Period | 2025-2033 |
| Historical Period | 2019-2024 |
| Growth Rate | CAGR of 8.63% from 2019-2033 |
| Segmentation |
|
Table of Contents
- 1. Introduction
- 1.1. Research Scope
- 1.2. Market Segmentation
- 1.3. Research Methodology
- 1.4. Definitions and Assumptions
- 2. Executive Summary
- 2.1. Introduction
- 3. Market Dynamics
- 3.1. Introduction
- 3.2. Market Drivers
- 3.2.1. Improved Healthcare Information Technology Systems; Growth in the Incidence Rate of Chronic Diseases; Increase in Government Funding for Cancer-related Research
- 3.3. Market Restrains
- 3.3.1. High Cost of the Installation; Scarcity of Skilled Labor
- 3.4. Market Trends
- 3.4.1. The Cloud-based Segment is Expected to Witness High Growth over the Forecast Period
- 4. Market Factor Analysis
- 4.1. Porters Five Forces
- 4.2. Supply/Value Chain
- 4.3. PESTEL analysis
- 4.4. Market Entropy
- 4.5. Patent/Trademark Analysis
- 5. Global Radiology Information System Industry Analysis, Insights and Forecast, 2019-2031
- 5.1. Market Analysis, Insights and Forecast - by Type
- 5.1.1. Integrated Radiology Information System
- 5.1.2. Stand-alone Radiology Information System
- 5.2. Market Analysis, Insights and Forecast - by Deployment Mode
- 5.2.1. On-premise
- 5.2.2. Cloud-based
- 5.3. Market Analysis, Insights and Forecast - by Component
- 5.3.1. Hardware
- 5.3.2. Software
- 5.3.3. Services
- 5.4. Market Analysis, Insights and Forecast - by Region
- 5.4.1. North America
- 5.4.2. Europe
- 5.4.3. Asia Pacific
- 5.4.4. Middle East and Africa
- 5.4.5. South America
- 5.1. Market Analysis, Insights and Forecast - by Type
- 6. North America Radiology Information System Industry Analysis, Insights and Forecast, 2019-2031
- 6.1. Market Analysis, Insights and Forecast - by Type
- 6.1.1. Integrated Radiology Information System
- 6.1.2. Stand-alone Radiology Information System
- 6.2. Market Analysis, Insights and Forecast - by Deployment Mode
- 6.2.1. On-premise
- 6.2.2. Cloud-based
- 6.3. Market Analysis, Insights and Forecast - by Component
- 6.3.1. Hardware
- 6.3.2. Software
- 6.3.3. Services
- 6.1. Market Analysis, Insights and Forecast - by Type
- 7. Europe Radiology Information System Industry Analysis, Insights and Forecast, 2019-2031
- 7.1. Market Analysis, Insights and Forecast - by Type
- 7.1.1. Integrated Radiology Information System
- 7.1.2. Stand-alone Radiology Information System
- 7.2. Market Analysis, Insights and Forecast - by Deployment Mode
- 7.2.1. On-premise
- 7.2.2. Cloud-based
- 7.3. Market Analysis, Insights and Forecast - by Component
- 7.3.1. Hardware
- 7.3.2. Software
- 7.3.3. Services
- 7.1. Market Analysis, Insights and Forecast - by Type
- 8. Asia Pacific Radiology Information System Industry Analysis, Insights and Forecast, 2019-2031
- 8.1. Market Analysis, Insights and Forecast - by Type
- 8.1.1. Integrated Radiology Information System
- 8.1.2. Stand-alone Radiology Information System
- 8.2. Market Analysis, Insights and Forecast - by Deployment Mode
- 8.2.1. On-premise
- 8.2.2. Cloud-based
- 8.3. Market Analysis, Insights and Forecast - by Component
- 8.3.1. Hardware
- 8.3.2. Software
- 8.3.3. Services
- 8.1. Market Analysis, Insights and Forecast - by Type
- 9. Middle East and Africa Radiology Information System Industry Analysis, Insights and Forecast, 2019-2031
- 9.1. Market Analysis, Insights and Forecast - by Type
- 9.1.1. Integrated Radiology Information System
- 9.1.2. Stand-alone Radiology Information System
- 9.2. Market Analysis, Insights and Forecast - by Deployment Mode
- 9.2.1. On-premise
- 9.2.2. Cloud-based
- 9.3. Market Analysis, Insights and Forecast - by Component
- 9.3.1. Hardware
- 9.3.2. Software
- 9.3.3. Services
- 9.1. Market Analysis, Insights and Forecast - by Type
- 10. South America Radiology Information System Industry Analysis, Insights and Forecast, 2019-2031
- 10.1. Market Analysis, Insights and Forecast - by Type
- 10.1.1. Integrated Radiology Information System
- 10.1.2. Stand-alone Radiology Information System
- 10.2. Market Analysis, Insights and Forecast - by Deployment Mode
- 10.2.1. On-premise
- 10.2.2. Cloud-based
- 10.3. Market Analysis, Insights and Forecast - by Component
- 10.3.1. Hardware
- 10.3.2. Software
- 10.3.3. Services
- 10.1. Market Analysis, Insights and Forecast - by Type
- 11. North America Radiology Information System Industry Analysis, Insights and Forecast, 2019-2031
- 11.1. Market Analysis, Insights and Forecast - By Country/Sub-region
- 11.1.1 United States
- 11.1.2 Canada
- 11.1.3 Mexico
- 12. Europe Radiology Information System Industry Analysis, Insights and Forecast, 2019-2031
- 12.1. Market Analysis, Insights and Forecast - By Country/Sub-region
- 12.1.1 Germany
- 12.1.2 United Kingdom
- 12.1.3 France
- 12.1.4 Italy
- 12.1.5 Spain
- 12.1.6 Rest of Europe
- 13. Asia Pacific Radiology Information System Industry Analysis, Insights and Forecast, 2019-2031
- 13.1. Market Analysis, Insights and Forecast - By Country/Sub-region
- 13.1.1 China
- 13.1.2 Japan
- 13.1.3 India
- 13.1.4 Australia
- 13.1.5 South Korea
- 13.1.6 Rest of Asia Pacific
- 14. Middle East and Africa Radiology Information System Industry Analysis, Insights and Forecast, 2019-2031
- 14.1. Market Analysis, Insights and Forecast - By Country/Sub-region
- 14.1.1 GCC
- 14.1.2 South Africa
- 14.1.3 Rest of Middle East and Africa
- 15. South America Radiology Information System Industry Analysis, Insights and Forecast, 2019-2031
- 15.1. Market Analysis, Insights and Forecast - By Country/Sub-region
- 15.1.1 Brazil
- 15.1.2 Argentina
- 15.1.3 Rest of South America
- 16. Competitive Analysis
- 16.1. Global Market Share Analysis 2024
- 16.2. Company Profiles
- 16.2.1 Mckesson Corporation
- 16.2.1.1. Overview
- 16.2.1.2. Products
- 16.2.1.3. SWOT Analysis
- 16.2.1.4. Recent Developments
- 16.2.1.5. Financials (Based on Availability)
- 16.2.2 NextGen Healthcare
- 16.2.2.1. Overview
- 16.2.2.2. Products
- 16.2.2.3. SWOT Analysis
- 16.2.2.4. Recent Developments
- 16.2.2.5. Financials (Based on Availability)
- 16.2.3 Kareo
- 16.2.3.1. Overview
- 16.2.3.2. Products
- 16.2.3.3. SWOT Analysis
- 16.2.3.4. Recent Developments
- 16.2.3.5. Financials (Based on Availability)
- 16.2.4 Epic Systems Corporation
- 16.2.4.1. Overview
- 16.2.4.2. Products
- 16.2.4.3. SWOT Analysis
- 16.2.4.4. Recent Developments
- 16.2.4.5. Financials (Based on Availability)
- 16.2.5 Siemens Healthineers
- 16.2.5.1. Overview
- 16.2.5.2. Products
- 16.2.5.3. SWOT Analysis
- 16.2.5.4. Recent Developments
- 16.2.5.5. Financials (Based on Availability)
- 16.2.6 GE Healthcare
- 16.2.6.1. Overview
- 16.2.6.2. Products
- 16.2.6.3. SWOT Analysis
- 16.2.6.4. Recent Developments
- 16.2.6.5. Financials (Based on Availability)
- 16.2.7 Varian Medical Systems Inc
- 16.2.7.1. Overview
- 16.2.7.2. Products
- 16.2.7.3. SWOT Analysis
- 16.2.7.4. Recent Developments
- 16.2.7.5. Financials (Based on Availability)
- 16.2.8 IBM (Merge Healthcare Incorporated)
- 16.2.8.1. Overview
- 16.2.8.2. Products
- 16.2.8.3. SWOT Analysis
- 16.2.8.4. Recent Developments
- 16.2.8.5. Financials (Based on Availability)
- 16.2.9 Cerner Corporation
- 16.2.9.1. Overview
- 16.2.9.2. Products
- 16.2.9.3. SWOT Analysis
- 16.2.9.4. Recent Developments
- 16.2.9.5. Financials (Based on Availability)
- 16.2.10 Koninklijke Philips NV
- 16.2.10.1. Overview
- 16.2.10.2. Products
- 16.2.10.3. SWOT Analysis
- 16.2.10.4. Recent Developments
- 16.2.10.5. Financials (Based on Availability)
- 16.2.11 Medinformatix Inc
- 16.2.11.1. Overview
- 16.2.11.2. Products
- 16.2.11.3. SWOT Analysis
- 16.2.11.4. Recent Developments
- 16.2.11.5. Financials (Based on Availability)
- 16.2.12 Allscripts Healthcare Solutions Inc
- 16.2.12.1. Overview
- 16.2.12.2. Products
- 16.2.12.3. SWOT Analysis
- 16.2.12.4. Recent Developments
- 16.2.12.5. Financials (Based on Availability)
- 16.2.13 patientNOW Inc
- 16.2.13.1. Overview
- 16.2.13.2. Products
- 16.2.13.3. SWOT Analysis
- 16.2.13.4. Recent Developments
- 16.2.13.5. Financials (Based on Availability)
- 16.2.14 Konica Minolta Healthcare Americas Inc
- 16.2.14.1. Overview
- 16.2.14.2. Products
- 16.2.14.3. SWOT Analysis
- 16.2.14.4. Recent Developments
- 16.2.14.5. Financials (Based on Availability)
- 16.2.15 Practice Fusion
- 16.2.15.1. Overview
- 16.2.15.2. Products
- 16.2.15.3. SWOT Analysis
- 16.2.15.4. Recent Developments
- 16.2.15.5. Financials (Based on Availability)
- 16.2.1 Mckesson Corporation
List of Figures
- Figure 1: Global Radiology Information System Industry Revenue Breakdown (Million, %) by Region 2024 & 2032
- Figure 2: Global Radiology Information System Industry Volume Breakdown (K Unit, %) by Region 2024 & 2032
- Figure 3: North America Radiology Information System Industry Revenue (Million), by Country 2024 & 2032
- Figure 4: North America Radiology Information System Industry Volume (K Unit), by Country 2024 & 2032
- Figure 5: North America Radiology Information System Industry Revenue Share (%), by Country 2024 & 2032
- Figure 6: North America Radiology Information System Industry Volume Share (%), by Country 2024 & 2032
- Figure 7: Europe Radiology Information System Industry Revenue (Million), by Country 2024 & 2032
- Figure 8: Europe Radiology Information System Industry Volume (K Unit), by Country 2024 & 2032
- Figure 9: Europe Radiology Information System Industry Revenue Share (%), by Country 2024 & 2032
- Figure 10: Europe Radiology Information System Industry Volume Share (%), by Country 2024 & 2032
- Figure 11: Asia Pacific Radiology Information System Industry Revenue (Million), by Country 2024 & 2032
- Figure 12: Asia Pacific Radiology Information System Industry Volume (K Unit), by Country 2024 & 2032
- Figure 13: Asia Pacific Radiology Information System Industry Revenue Share (%), by Country 2024 & 2032
- Figure 14: Asia Pacific Radiology Information System Industry Volume Share (%), by Country 2024 & 2032
- Figure 15: Middle East and Africa Radiology Information System Industry Revenue (Million), by Country 2024 & 2032
- Figure 16: Middle East and Africa Radiology Information System Industry Volume (K Unit), by Country 2024 & 2032
- Figure 17: Middle East and Africa Radiology Information System Industry Revenue Share (%), by Country 2024 & 2032
- Figure 18: Middle East and Africa Radiology Information System Industry Volume Share (%), by Country 2024 & 2032
- Figure 19: South America Radiology Information System Industry Revenue (Million), by Country 2024 & 2032
- Figure 20: South America Radiology Information System Industry Volume (K Unit), by Country 2024 & 2032
- Figure 21: South America Radiology Information System Industry Revenue Share (%), by Country 2024 & 2032
- Figure 22: South America Radiology Information System Industry Volume Share (%), by Country 2024 & 2032
- Figure 23: North America Radiology Information System Industry Revenue (Million), by Type 2024 & 2032
- Figure 24: North America Radiology Information System Industry Volume (K Unit), by Type 2024 & 2032
- Figure 25: North America Radiology Information System Industry Revenue Share (%), by Type 2024 & 2032
- Figure 26: North America Radiology Information System Industry Volume Share (%), by Type 2024 & 2032
- Figure 27: North America Radiology Information System Industry Revenue (Million), by Deployment Mode 2024 & 2032
- Figure 28: North America Radiology Information System Industry Volume (K Unit), by Deployment Mode 2024 & 2032
- Figure 29: North America Radiology Information System Industry Revenue Share (%), by Deployment Mode 2024 & 2032
- Figure 30: North America Radiology Information System Industry Volume Share (%), by Deployment Mode 2024 & 2032
- Figure 31: North America Radiology Information System Industry Revenue (Million), by Component 2024 & 2032
- Figure 32: North America Radiology Information System Industry Volume (K Unit), by Component 2024 & 2032
- Figure 33: North America Radiology Information System Industry Revenue Share (%), by Component 2024 & 2032
- Figure 34: North America Radiology Information System Industry Volume Share (%), by Component 2024 & 2032
- Figure 35: North America Radiology Information System Industry Revenue (Million), by Country 2024 & 2032
- Figure 36: North America Radiology Information System Industry Volume (K Unit), by Country 2024 & 2032
- Figure 37: North America Radiology Information System Industry Revenue Share (%), by Country 2024 & 2032
- Figure 38: North America Radiology Information System Industry Volume Share (%), by Country 2024 & 2032
- Figure 39: Europe Radiology Information System Industry Revenue (Million), by Type 2024 & 2032
- Figure 40: Europe Radiology Information System Industry Volume (K Unit), by Type 2024 & 2032
- Figure 41: Europe Radiology Information System Industry Revenue Share (%), by Type 2024 & 2032
- Figure 42: Europe Radiology Information System Industry Volume Share (%), by Type 2024 & 2032
- Figure 43: Europe Radiology Information System Industry Revenue (Million), by Deployment Mode 2024 & 2032
- Figure 44: Europe Radiology Information System Industry Volume (K Unit), by Deployment Mode 2024 & 2032
- Figure 45: Europe Radiology Information System Industry Revenue Share (%), by Deployment Mode 2024 & 2032
- Figure 46: Europe Radiology Information System Industry Volume Share (%), by Deployment Mode 2024 & 2032
- Figure 47: Europe Radiology Information System Industry Revenue (Million), by Component 2024 & 2032
- Figure 48: Europe Radiology Information System Industry Volume (K Unit), by Component 2024 & 2032
- Figure 49: Europe Radiology Information System Industry Revenue Share (%), by Component 2024 & 2032
- Figure 50: Europe Radiology Information System Industry Volume Share (%), by Component 2024 & 2032
- Figure 51: Europe Radiology Information System Industry Revenue (Million), by Country 2024 & 2032
- Figure 52: Europe Radiology Information System Industry Volume (K Unit), by Country 2024 & 2032
- Figure 53: Europe Radiology Information System Industry Revenue Share (%), by Country 2024 & 2032
- Figure 54: Europe Radiology Information System Industry Volume Share (%), by Country 2024 & 2032
- Figure 55: Asia Pacific Radiology Information System Industry Revenue (Million), by Type 2024 & 2032
- Figure 56: Asia Pacific Radiology Information System Industry Volume (K Unit), by Type 2024 & 2032
- Figure 57: Asia Pacific Radiology Information System Industry Revenue Share (%), by Type 2024 & 2032
- Figure 58: Asia Pacific Radiology Information System Industry Volume Share (%), by Type 2024 & 2032
- Figure 59: Asia Pacific Radiology Information System Industry Revenue (Million), by Deployment Mode 2024 & 2032
- Figure 60: Asia Pacific Radiology Information System Industry Volume (K Unit), by Deployment Mode 2024 & 2032
- Figure 61: Asia Pacific Radiology Information System Industry Revenue Share (%), by Deployment Mode 2024 & 2032
- Figure 62: Asia Pacific Radiology Information System Industry Volume Share (%), by Deployment Mode 2024 & 2032
- Figure 63: Asia Pacific Radiology Information System Industry Revenue (Million), by Component 2024 & 2032
- Figure 64: Asia Pacific Radiology Information System Industry Volume (K Unit), by Component 2024 & 2032
- Figure 65: Asia Pacific Radiology Information System Industry Revenue Share (%), by Component 2024 & 2032
- Figure 66: Asia Pacific Radiology Information System Industry Volume Share (%), by Component 2024 & 2032
- Figure 67: Asia Pacific Radiology Information System Industry Revenue (Million), by Country 2024 & 2032
- Figure 68: Asia Pacific Radiology Information System Industry Volume (K Unit), by Country 2024 & 2032
- Figure 69: Asia Pacific Radiology Information System Industry Revenue Share (%), by Country 2024 & 2032
- Figure 70: Asia Pacific Radiology Information System Industry Volume Share (%), by Country 2024 & 2032
- Figure 71: Middle East and Africa Radiology Information System Industry Revenue (Million), by Type 2024 & 2032
- Figure 72: Middle East and Africa Radiology Information System Industry Volume (K Unit), by Type 2024 & 2032
- Figure 73: Middle East and Africa Radiology Information System Industry Revenue Share (%), by Type 2024 & 2032
- Figure 74: Middle East and Africa Radiology Information System Industry Volume Share (%), by Type 2024 & 2032
- Figure 75: Middle East and Africa Radiology Information System Industry Revenue (Million), by Deployment Mode 2024 & 2032
- Figure 76: Middle East and Africa Radiology Information System Industry Volume (K Unit), by Deployment Mode 2024 & 2032
- Figure 77: Middle East and Africa Radiology Information System Industry Revenue Share (%), by Deployment Mode 2024 & 2032
- Figure 78: Middle East and Africa Radiology Information System Industry Volume Share (%), by Deployment Mode 2024 & 2032
- Figure 79: Middle East and Africa Radiology Information System Industry Revenue (Million), by Component 2024 & 2032
- Figure 80: Middle East and Africa Radiology Information System Industry Volume (K Unit), by Component 2024 & 2032
- Figure 81: Middle East and Africa Radiology Information System Industry Revenue Share (%), by Component 2024 & 2032
- Figure 82: Middle East and Africa Radiology Information System Industry Volume Share (%), by Component 2024 & 2032
- Figure 83: Middle East and Africa Radiology Information System Industry Revenue (Million), by Country 2024 & 2032
- Figure 84: Middle East and Africa Radiology Information System Industry Volume (K Unit), by Country 2024 & 2032
- Figure 85: Middle East and Africa Radiology Information System Industry Revenue Share (%), by Country 2024 & 2032
- Figure 86: Middle East and Africa Radiology Information System Industry Volume Share (%), by Country 2024 & 2032
- Figure 87: South America Radiology Information System Industry Revenue (Million), by Type 2024 & 2032
- Figure 88: South America Radiology Information System Industry Volume (K Unit), by Type 2024 & 2032
- Figure 89: South America Radiology Information System Industry Revenue Share (%), by Type 2024 & 2032
- Figure 90: South America Radiology Information System Industry Volume Share (%), by Type 2024 & 2032
- Figure 91: South America Radiology Information System Industry Revenue (Million), by Deployment Mode 2024 & 2032
- Figure 92: South America Radiology Information System Industry Volume (K Unit), by Deployment Mode 2024 & 2032
- Figure 93: South America Radiology Information System Industry Revenue Share (%), by Deployment Mode 2024 & 2032
- Figure 94: South America Radiology Information System Industry Volume Share (%), by Deployment Mode 2024 & 2032
- Figure 95: South America Radiology Information System Industry Revenue (Million), by Component 2024 & 2032
- Figure 96: South America Radiology Information System Industry Volume (K Unit), by Component 2024 & 2032
- Figure 97: South America Radiology Information System Industry Revenue Share (%), by Component 2024 & 2032
- Figure 98: South America Radiology Information System Industry Volume Share (%), by Component 2024 & 2032
- Figure 99: South America Radiology Information System Industry Revenue (Million), by Country 2024 & 2032
- Figure 100: South America Radiology Information System Industry Volume (K Unit), by Country 2024 & 2032
- Figure 101: South America Radiology Information System Industry Revenue Share (%), by Country 2024 & 2032
- Figure 102: South America Radiology Information System Industry Volume Share (%), by Country 2024 & 2032
List of Tables
- Table 1: Global Radiology Information System Industry Revenue Million Forecast, by Region 2019 & 2032
- Table 2: Global Radiology Information System Industry Volume K Unit Forecast, by Region 2019 & 2032
- Table 3: Global Radiology Information System Industry Revenue Million Forecast, by Type 2019 & 2032
- Table 4: Global Radiology Information System Industry Volume K Unit Forecast, by Type 2019 & 2032
- Table 5: Global Radiology Information System Industry Revenue Million Forecast, by Deployment Mode 2019 & 2032
- Table 6: Global Radiology Information System Industry Volume K Unit Forecast, by Deployment Mode 2019 & 2032
- Table 7: Global Radiology Information System Industry Revenue Million Forecast, by Component 2019 & 2032
- Table 8: Global Radiology Information System Industry Volume K Unit Forecast, by Component 2019 & 2032
- Table 9: Global Radiology Information System Industry Revenue Million Forecast, by Region 2019 & 2032
- Table 10: Global Radiology Information System Industry Volume K Unit Forecast, by Region 2019 & 2032
- Table 11: Global Radiology Information System Industry Revenue Million Forecast, by Country 2019 & 2032
- Table 12: Global Radiology Information System Industry Volume K Unit Forecast, by Country 2019 & 2032
- Table 13: United States Radiology Information System Industry Revenue (Million) Forecast, by Application 2019 & 2032
- Table 14: United States Radiology Information System Industry Volume (K Unit) Forecast, by Application 2019 & 2032
- Table 15: Canada Radiology Information System Industry Revenue (Million) Forecast, by Application 2019 & 2032
- Table 16: Canada Radiology Information System Industry Volume (K Unit) Forecast, by Application 2019 & 2032
- Table 17: Mexico Radiology Information System Industry Revenue (Million) Forecast, by Application 2019 & 2032
- Table 18: Mexico Radiology Information System Industry Volume (K Unit) Forecast, by Application 2019 & 2032
- Table 19: Global Radiology Information System Industry Revenue Million Forecast, by Country 2019 & 2032
- Table 20: Global Radiology Information System Industry Volume K Unit Forecast, by Country 2019 & 2032
- Table 21: Germany Radiology Information System Industry Revenue (Million) Forecast, by Application 2019 & 2032
- Table 22: Germany Radiology Information System Industry Volume (K Unit) Forecast, by Application 2019 & 2032
- Table 23: United Kingdom Radiology Information System Industry Revenue (Million) Forecast, by Application 2019 & 2032
- Table 24: United Kingdom Radiology Information System Industry Volume (K Unit) Forecast, by Application 2019 & 2032
- Table 25: France Radiology Information System Industry Revenue (Million) Forecast, by Application 2019 & 2032
- Table 26: France Radiology Information System Industry Volume (K Unit) Forecast, by Application 2019 & 2032
- Table 27: Italy Radiology Information System Industry Revenue (Million) Forecast, by Application 2019 & 2032
- Table 28: Italy Radiology Information System Industry Volume (K Unit) Forecast, by Application 2019 & 2032
- Table 29: Spain Radiology Information System Industry Revenue (Million) Forecast, by Application 2019 & 2032
- Table 30: Spain Radiology Information System Industry Volume (K Unit) Forecast, by Application 2019 & 2032
- Table 31: Rest of Europe Radiology Information System Industry Revenue (Million) Forecast, by Application 2019 & 2032
- Table 32: Rest of Europe Radiology Information System Industry Volume (K Unit) Forecast, by Application 2019 & 2032
- Table 33: Global Radiology Information System Industry Revenue Million Forecast, by Country 2019 & 2032
- Table 34: Global Radiology Information System Industry Volume K Unit Forecast, by Country 2019 & 2032
- Table 35: China Radiology Information System Industry Revenue (Million) Forecast, by Application 2019 & 2032
- Table 36: China Radiology Information System Industry Volume (K Unit) Forecast, by Application 2019 & 2032
- Table 37: Japan Radiology Information System Industry Revenue (Million) Forecast, by Application 2019 & 2032
- Table 38: Japan Radiology Information System Industry Volume (K Unit) Forecast, by Application 2019 & 2032
- Table 39: India Radiology Information System Industry Revenue (Million) Forecast, by Application 2019 & 2032
- Table 40: India Radiology Information System Industry Volume (K Unit) Forecast, by Application 2019 & 2032
- Table 41: Australia Radiology Information System Industry Revenue (Million) Forecast, by Application 2019 & 2032
- Table 42: Australia Radiology Information System Industry Volume (K Unit) Forecast, by Application 2019 & 2032
- Table 43: South Korea Radiology Information System Industry Revenue (Million) Forecast, by Application 2019 & 2032
- Table 44: South Korea Radiology Information System Industry Volume (K Unit) Forecast, by Application 2019 & 2032
- Table 45: Rest of Asia Pacific Radiology Information System Industry Revenue (Million) Forecast, by Application 2019 & 2032
- Table 46: Rest of Asia Pacific Radiology Information System Industry Volume (K Unit) Forecast, by Application 2019 & 2032
- Table 47: Global Radiology Information System Industry Revenue Million Forecast, by Country 2019 & 2032
- Table 48: Global Radiology Information System Industry Volume K Unit Forecast, by Country 2019 & 2032
- Table 49: GCC Radiology Information System Industry Revenue (Million) Forecast, by Application 2019 & 2032
- Table 50: GCC Radiology Information System Industry Volume (K Unit) Forecast, by Application 2019 & 2032
- Table 51: South Africa Radiology Information System Industry Revenue (Million) Forecast, by Application 2019 & 2032
- Table 52: South Africa Radiology Information System Industry Volume (K Unit) Forecast, by Application 2019 & 2032
- Table 53: Rest of Middle East and Africa Radiology Information System Industry Revenue (Million) Forecast, by Application 2019 & 2032
- Table 54: Rest of Middle East and Africa Radiology Information System Industry Volume (K Unit) Forecast, by Application 2019 & 2032
- Table 55: Global Radiology Information System Industry Revenue Million Forecast, by Country 2019 & 2032
- Table 56: Global Radiology Information System Industry Volume K Unit Forecast, by Country 2019 & 2032
- Table 57: Brazil Radiology Information System Industry Revenue (Million) Forecast, by Application 2019 & 2032
- Table 58: Brazil Radiology Information System Industry Volume (K Unit) Forecast, by Application 2019 & 2032
- Table 59: Argentina Radiology Information System Industry Revenue (Million) Forecast, by Application 2019 & 2032
- Table 60: Argentina Radiology Information System Industry Volume (K Unit) Forecast, by Application 2019 & 2032
- Table 61: Rest of South America Radiology Information System Industry Revenue (Million) Forecast, by Application 2019 & 2032
- Table 62: Rest of South America Radiology Information System Industry Volume (K Unit) Forecast, by Application 2019 & 2032
- Table 63: Global Radiology Information System Industry Revenue Million Forecast, by Type 2019 & 2032
- Table 64: Global Radiology Information System Industry Volume K Unit Forecast, by Type 2019 & 2032
- Table 65: Global Radiology Information System Industry Revenue Million Forecast, by Deployment Mode 2019 & 2032
- Table 66: Global Radiology Information System Industry Volume K Unit Forecast, by Deployment Mode 2019 & 2032
- Table 67: Global Radiology Information System Industry Revenue Million Forecast, by Component 2019 & 2032
- Table 68: Global Radiology Information System Industry Volume K Unit Forecast, by Component 2019 & 2032
- Table 69: Global Radiology Information System Industry Revenue Million Forecast, by Country 2019 & 2032
- Table 70: Global Radiology Information System Industry Volume K Unit Forecast, by Country 2019 & 2032
- Table 71: United States Radiology Information System Industry Revenue (Million) Forecast, by Application 2019 & 2032
- Table 72: United States Radiology Information System Industry Volume (K Unit) Forecast, by Application 2019 & 2032
- Table 73: Canada Radiology Information System Industry Revenue (Million) Forecast, by Application 2019 & 2032
- Table 74: Canada Radiology Information System Industry Volume (K Unit) Forecast, by Application 2019 & 2032
- Table 75: Mexico Radiology Information System Industry Revenue (Million) Forecast, by Application 2019 & 2032
- Table 76: Mexico Radiology Information System Industry Volume (K Unit) Forecast, by Application 2019 & 2032
- Table 77: Global Radiology Information System Industry Revenue Million Forecast, by Type 2019 & 2032
- Table 78: Global Radiology Information System Industry Volume K Unit Forecast, by Type 2019 & 2032
- Table 79: Global Radiology Information System Industry Revenue Million Forecast, by Deployment Mode 2019 & 2032
- Table 80: Global Radiology Information System Industry Volume K Unit Forecast, by Deployment Mode 2019 & 2032
- Table 81: Global Radiology Information System Industry Revenue Million Forecast, by Component 2019 & 2032
- Table 82: Global Radiology Information System Industry Volume K Unit Forecast, by Component 2019 & 2032
- Table 83: Global Radiology Information System Industry Revenue Million Forecast, by Country 2019 & 2032
- Table 84: Global Radiology Information System Industry Volume K Unit Forecast, by Country 2019 & 2032
- Table 85: Germany Radiology Information System Industry Revenue (Million) Forecast, by Application 2019 & 2032
- Table 86: Germany Radiology Information System Industry Volume (K Unit) Forecast, by Application 2019 & 2032
- Table 87: United Kingdom Radiology Information System Industry Revenue (Million) Forecast, by Application 2019 & 2032
- Table 88: United Kingdom Radiology Information System Industry Volume (K Unit) Forecast, by Application 2019 & 2032
- Table 89: France Radiology Information System Industry Revenue (Million) Forecast, by Application 2019 & 2032
- Table 90: France Radiology Information System Industry Volume (K Unit) Forecast, by Application 2019 & 2032
- Table 91: Italy Radiology Information System Industry Revenue (Million) Forecast, by Application 2019 & 2032
- Table 92: Italy Radiology Information System Industry Volume (K Unit) Forecast, by Application 2019 & 2032
- Table 93: Spain Radiology Information System Industry Revenue (Million) Forecast, by Application 2019 & 2032
- Table 94: Spain Radiology Information System Industry Volume (K Unit) Forecast, by Application 2019 & 2032
- Table 95: Rest of Europe Radiology Information System Industry Revenue (Million) Forecast, by Application 2019 & 2032
- Table 96: Rest of Europe Radiology Information System Industry Volume (K Unit) Forecast, by Application 2019 & 2032
- Table 97: Global Radiology Information System Industry Revenue Million Forecast, by Type 2019 & 2032
- Table 98: Global Radiology Information System Industry Volume K Unit Forecast, by Type 2019 & 2032
- Table 99: Global Radiology Information System Industry Revenue Million Forecast, by Deployment Mode 2019 & 2032
- Table 100: Global Radiology Information System Industry Volume K Unit Forecast, by Deployment Mode 2019 & 2032
- Table 101: Global Radiology Information System Industry Revenue Million Forecast, by Component 2019 & 2032
- Table 102: Global Radiology Information System Industry Volume K Unit Forecast, by Component 2019 & 2032
- Table 103: Global Radiology Information System Industry Revenue Million Forecast, by Country 2019 & 2032
- Table 104: Global Radiology Information System Industry Volume K Unit Forecast, by Country 2019 & 2032
- Table 105: China Radiology Information System Industry Revenue (Million) Forecast, by Application 2019 & 2032
- Table 106: China Radiology Information System Industry Volume (K Unit) Forecast, by Application 2019 & 2032
- Table 107: Japan Radiology Information System Industry Revenue (Million) Forecast, by Application 2019 & 2032
- Table 108: Japan Radiology Information System Industry Volume (K Unit) Forecast, by Application 2019 & 2032
- Table 109: India Radiology Information System Industry Revenue (Million) Forecast, by Application 2019 & 2032
- Table 110: India Radiology Information System Industry Volume (K Unit) Forecast, by Application 2019 & 2032
- Table 111: Australia Radiology Information System Industry Revenue (Million) Forecast, by Application 2019 & 2032
- Table 112: Australia Radiology Information System Industry Volume (K Unit) Forecast, by Application 2019 & 2032
- Table 113: South Korea Radiology Information System Industry Revenue (Million) Forecast, by Application 2019 & 2032
- Table 114: South Korea Radiology Information System Industry Volume (K Unit) Forecast, by Application 2019 & 2032
- Table 115: Rest of Asia Pacific Radiology Information System Industry Revenue (Million) Forecast, by Application 2019 & 2032
- Table 116: Rest of Asia Pacific Radiology Information System Industry Volume (K Unit) Forecast, by Application 2019 & 2032
- Table 117: Global Radiology Information System Industry Revenue Million Forecast, by Type 2019 & 2032
- Table 118: Global Radiology Information System Industry Volume K Unit Forecast, by Type 2019 & 2032
- Table 119: Global Radiology Information System Industry Revenue Million Forecast, by Deployment Mode 2019 & 2032
- Table 120: Global Radiology Information System Industry Volume K Unit Forecast, by Deployment Mode 2019 & 2032
- Table 121: Global Radiology Information System Industry Revenue Million Forecast, by Component 2019 & 2032
- Table 122: Global Radiology Information System Industry Volume K Unit Forecast, by Component 2019 & 2032
- Table 123: Global Radiology Information System Industry Revenue Million Forecast, by Country 2019 & 2032
- Table 124: Global Radiology Information System Industry Volume K Unit Forecast, by Country 2019 & 2032
- Table 125: GCC Radiology Information System Industry Revenue (Million) Forecast, by Application 2019 & 2032
- Table 126: GCC Radiology Information System Industry Volume (K Unit) Forecast, by Application 2019 & 2032
- Table 127: South Africa Radiology Information System Industry Revenue (Million) Forecast, by Application 2019 & 2032
- Table 128: South Africa Radiology Information System Industry Volume (K Unit) Forecast, by Application 2019 & 2032
- Table 129: Rest of Middle East and Africa Radiology Information System Industry Revenue (Million) Forecast, by Application 2019 & 2032
- Table 130: Rest of Middle East and Africa Radiology Information System Industry Volume (K Unit) Forecast, by Application 2019 & 2032
- Table 131: Global Radiology Information System Industry Revenue Million Forecast, by Type 2019 & 2032
- Table 132: Global Radiology Information System Industry Volume K Unit Forecast, by Type 2019 & 2032
- Table 133: Global Radiology Information System Industry Revenue Million Forecast, by Deployment Mode 2019 & 2032
- Table 134: Global Radiology Information System Industry Volume K Unit Forecast, by Deployment Mode 2019 & 2032
- Table 135: Global Radiology Information System Industry Revenue Million Forecast, by Component 2019 & 2032
- Table 136: Global Radiology Information System Industry Volume K Unit Forecast, by Component 2019 & 2032
- Table 137: Global Radiology Information System Industry Revenue Million Forecast, by Country 2019 & 2032
- Table 138: Global Radiology Information System Industry Volume K Unit Forecast, by Country 2019 & 2032
- Table 139: Brazil Radiology Information System Industry Revenue (Million) Forecast, by Application 2019 & 2032
- Table 140: Brazil Radiology Information System Industry Volume (K Unit) Forecast, by Application 2019 & 2032
- Table 141: Argentina Radiology Information System Industry Revenue (Million) Forecast, by Application 2019 & 2032
- Table 142: Argentina Radiology Information System Industry Volume (K Unit) Forecast, by Application 2019 & 2032
- Table 143: Rest of South America Radiology Information System Industry Revenue (Million) Forecast, by Application 2019 & 2032
- Table 144: Rest of South America Radiology Information System Industry Volume (K Unit) Forecast, by Application 2019 & 2032
Frequently Asked Questions
1. What is the projected Compound Annual Growth Rate (CAGR) of the Radiology Information System Industry?
The projected CAGR is approximately 8.63%.
2. Which companies are prominent players in the Radiology Information System Industry?
Key companies in the market include Mckesson Corporation, NextGen Healthcare, Kareo, Epic Systems Corporation, Siemens Healthineers, GE Healthcare, Varian Medical Systems Inc, IBM (Merge Healthcare Incorporated), Cerner Corporation, Koninklijke Philips NV, Medinformatix Inc, Allscripts Healthcare Solutions Inc, patientNOW Inc, Konica Minolta Healthcare Americas Inc , Practice Fusion.
3. What are the main segments of the Radiology Information System Industry?
The market segments include Type, Deployment Mode, Component.
4. Can you provide details about the market size?
The market size is estimated to be USD 1.25 Million as of 2022.
5. What are some drivers contributing to market growth?
Improved Healthcare Information Technology Systems; Growth in the Incidence Rate of Chronic Diseases; Increase in Government Funding for Cancer-related Research.
6. What are the notable trends driving market growth?
The Cloud-based Segment is Expected to Witness High Growth over the Forecast Period.
7. Are there any restraints impacting market growth?
High Cost of the Installation; Scarcity of Skilled Labor.
8. Can you provide examples of recent developments in the market?
In March 2022, Intelerad Medical Systems launched the Enterprise Imaging and Informatics Suite at the 2022 Healthcare Information and Management Systems Society (HIMSS) Global Health Conference and Exhibition, which may provide radiologists with an emerging option for medical image management.
9. What pricing options are available for accessing the report?
Pricing options include single-user, multi-user, and enterprise licenses priced at USD 4750, USD 5250, and USD 8750 respectively.
10. Is the market size provided in terms of value or volume?
The market size is provided in terms of value, measured in Million and volume, measured in K Unit.
11. Are there any specific market keywords associated with the report?
Yes, the market keyword associated with the report is "Radiology Information System Industry," which aids in identifying and referencing the specific market segment covered.
12. How do I determine which pricing option suits my needs best?
The pricing options vary based on user requirements and access needs. Individual users may opt for single-user licenses, while businesses requiring broader access may choose multi-user or enterprise licenses for cost-effective access to the report.
13. Are there any additional resources or data provided in the Radiology Information System Industry report?
While the report offers comprehensive insights, it's advisable to review the specific contents or supplementary materials provided to ascertain if additional resources or data are available.
14. How can I stay updated on further developments or reports in the Radiology Information System Industry?
To stay informed about further developments, trends, and reports in the Radiology Information System Industry, consider subscribing to industry newsletters, following relevant companies and organizations, or regularly checking reputable industry news sources and publications.
Methodology
Step 1 - Identification of Relevant Samples Size from Population Database


Step 2 - Approaches for Defining Global Market Size (Value, Volume* & Price*)

Note*: In applicable scenarios
Step 3 - Data Sources
Primary Research
- Web Analytics
- Survey Reports
- Research Institute
- Latest Research Reports
- Opinion Leaders
Secondary Research
- Annual Reports
- White Paper
- Latest Press Release
- Industry Association
- Paid Database
- Investor Presentations

Step 4 - Data Triangulation
Involves using different sources of information in order to increase the validity of a study
These sources are likely to be stakeholders in a program - participants, other researchers, program staff, other community members, and so on.
Then we put all data in single framework & apply various statistical tools to find out the dynamic on the market.
During the analysis stage, feedback from the stakeholder groups would be compared to determine areas of agreement as well as areas of divergence


