
Key Insights
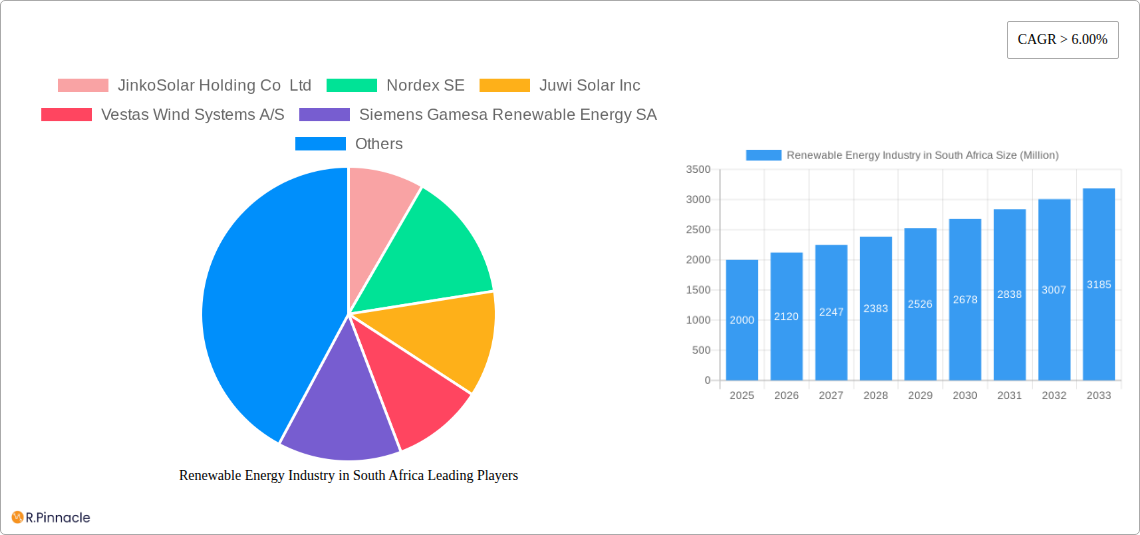
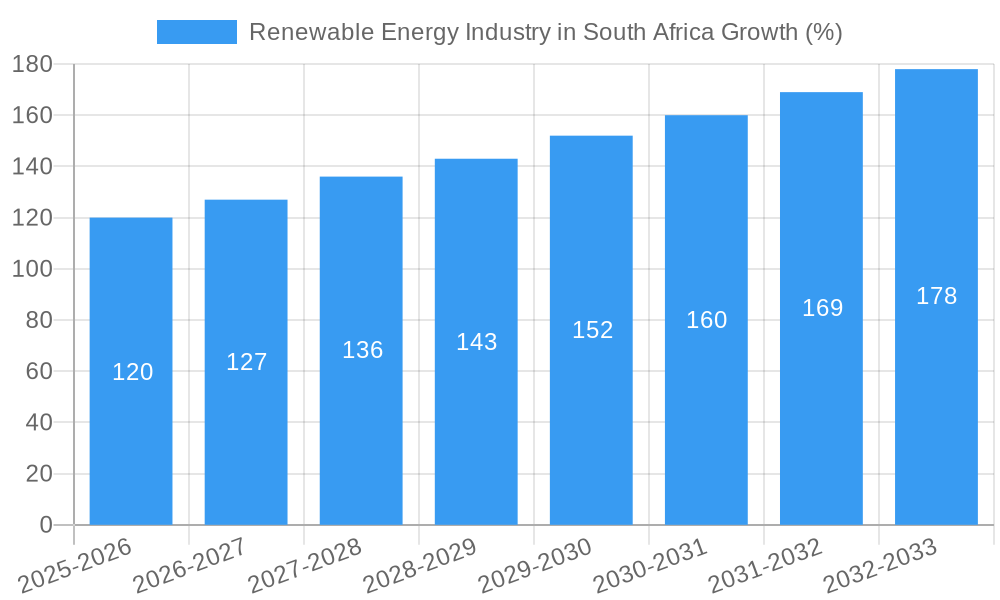
The South African renewable energy market is experiencing robust growth, driven by increasing electricity demand, a commitment to reducing carbon emissions, and government initiatives promoting renewable energy sources. The market's Compound Annual Growth Rate (CAGR) exceeding 6% signifies a consistently expanding sector. While precise market sizing for 2025 is unavailable, considering a global renewable energy market valued in the trillions and a strong South African push towards renewable energy, a conservative estimate places the 2025 market size at approximately $2 billion (or R36 billion based on an exchange rate of R18 to the dollar). This growth is fueled by factors such as the increasing cost-competitiveness of solar and wind power against traditional fossil fuels, coupled with improved energy storage solutions addressing intermittency concerns. Furthermore, South Africa's abundant solar and wind resources provide a strong foundation for sustained expansion. However, challenges remain, including grid infrastructure limitations, financing hurdles for large-scale projects, and potential regulatory uncertainties. Despite these restraints, the long-term outlook for the South African renewable energy market remains positive, with continuous government support and private investment anticipated to fuel substantial growth through 2033. Key players like JinkoSolar, Nordex, Vestas, and Siemens Gamesa are actively involved, leveraging their expertise to shape the sector's trajectory. The market segmentation will likely see a rise in distributed generation (rooftop solar) alongside large-scale utility projects, further diversifying the market landscape.
The continued expansion of the renewable energy sector in South Africa is expected to create numerous opportunities across the value chain. This includes the manufacturing and installation of renewable energy equipment, project development and finance, operation and maintenance services, and skilled labor requirements. The integration of renewable energy sources into the national grid necessitates significant investments in transmission and distribution infrastructure to ensure reliable and efficient electricity supply. Government policy plays a critical role in stimulating growth, with supportive regulatory frameworks and incentives driving private sector participation. The diversification of renewable energy sources, including solar PV, wind, and potentially geothermal and hydropower, will further shape the market dynamics. Long-term success hinges on addressing challenges related to land acquisition, environmental considerations, and community engagement. The next decade will be crucial in determining the extent to which South Africa can leverage its renewable energy potential to achieve its sustainability goals and improve energy security.
Renewable Energy Industry in South Africa: 2019-2033 Market Report
This comprehensive report provides an in-depth analysis of the renewable energy industry in South Africa, covering the period 2019-2033, with a focus on market dynamics, innovation trends, and key players. Leveraging data from the base year 2025 and projecting to 2033, this report is essential for industry professionals, investors, and policymakers seeking to understand the growth trajectory and investment opportunities within this rapidly evolving sector. The report meticulously examines market segmentation, competitive landscape, and emerging trends, offering actionable insights for strategic decision-making.
Renewable Energy Industry in South Africa Market Structure & Innovation Trends
This section analyzes the South African renewable energy market structure, highlighting market concentration, innovation drivers, regulatory frameworks, and competitive dynamics. We examine the influence of product substitutes, end-user demographics, and mergers & acquisitions (M&A) activities, including deal values and market share impacts. The analysis covers the historical period (2019-2024) and provides insights into the projected market structure (2025-2033).
- Market Concentration: Analysis will reveal the market share held by leading players such as JinkoSolar Holding Co Ltd, Nordex SE, Juwi Solar Inc, Vestas Wind Systems A/S, Siemens Gamesa Renewable Energy SA, First Solar Inc, Scatec Solar ASA, Acciona SA, and Juwi AG, among others. The report will quantify the level of concentration and identify any trends towards consolidation or fragmentation.
- Innovation Drivers: This section will explore government policies, technological advancements, and consumer demand influencing innovation in renewable energy technologies. Specific examples of innovative products and services will be included.
- Regulatory Frameworks: A detailed analysis of South Africa’s regulatory landscape impacting the renewable energy sector will be presented, considering its influence on market entry, investment, and technology adoption.
- M&A Activity: The report will document significant M&A transactions within the South African renewable energy sector during the study period, analyzing the driving forces behind these deals and their implications for market structure and competition. Approximate deal values (in Millions of USD) will be provided where available. For example, xx Million USD in deals were observed during the historical period.
Renewable Energy Industry in South Africa Market Dynamics & Trends
This section provides a detailed overview of market dynamics and trends influencing the growth of the South African renewable energy sector. The analysis covers market growth drivers, technological disruptions, consumer preferences, competitive dynamics, and the impact of macroeconomic factors. Key metrics such as Compound Annual Growth Rate (CAGR) and market penetration rates will be provided. The analysis will encompass the historical period (2019-2024), the base year (2025), and the forecast period (2025-2033).
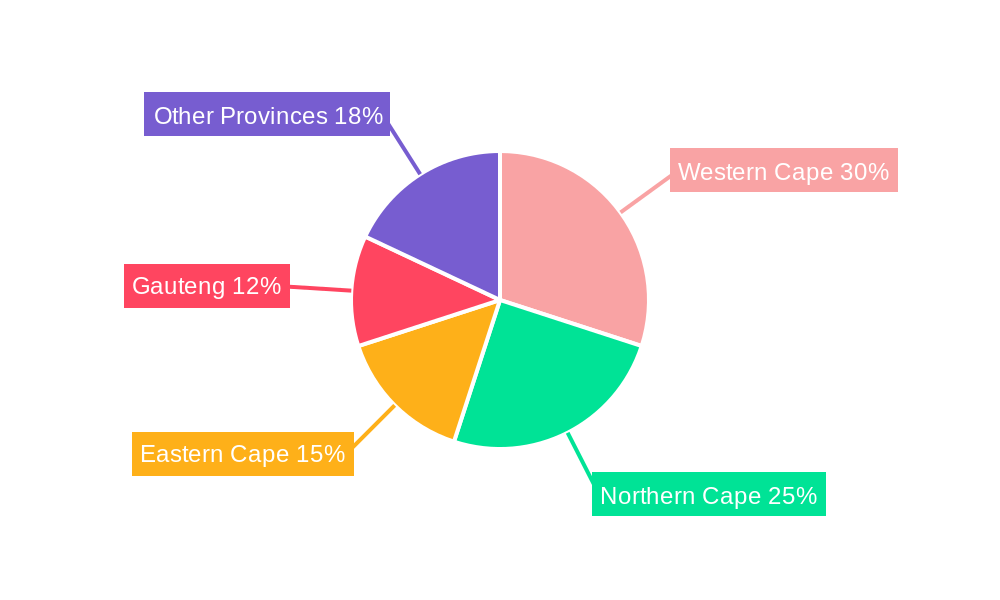
Dominant Regions & Segments in Renewable Energy Industry in South Africa
This section identifies the leading regions and segments within the South African renewable energy market. A detailed analysis of the dominant segment's performance is provided, highlighting key drivers contributing to its success.
- Key Drivers:
- Economic policies supporting renewable energy development.
- Favorable regulatory frameworks.
- Existing infrastructure and grid connectivity.
- Geographic suitability for specific renewable energy technologies.
- Dominance Analysis: This section will provide a comprehensive analysis explaining why a particular region or segment dominates, including factors such as resource availability, government incentives, and private investment. The analysis will consider market size, growth rates, and competitive dynamics across various segments.
Renewable Energy Industry in South Africa Product Innovations
This section summarizes recent product developments, applications, and competitive advantages in the South African renewable energy market. Technological trends and their market fit are highlighted, focusing on innovation in solar, wind, and other renewable technologies.
Report Scope & Segmentation Analysis
This report segments the South African renewable energy market based on technology (solar, wind, hydro, biomass, geothermal), application (residential, commercial, industrial, utility-scale), and geography. Growth projections, market sizes (in Millions of USD), and competitive dynamics are provided for each segment.
Key Drivers of Renewable Energy Industry in South Africa Growth
This section outlines the key factors driving the growth of the renewable energy industry in South Africa. These drivers include technological advancements, supportive government policies and regulations, increasing energy demand, and decreasing costs of renewable energy technologies. Specific examples of these factors will be detailed.
Challenges in the Renewable Energy Industry in South Africa Sector
This section identifies the challenges facing the South African renewable energy sector. These challenges include grid integration issues, regulatory hurdles, supply chain vulnerabilities, and intermittent renewable energy generation. Quantifiable impacts of these challenges will be presented where possible, such as xx Million USD in potential losses due to supply chain issues.
Emerging Opportunities in Renewable Energy Industry in South Africa
This section highlights emerging opportunities within the South African renewable energy sector, including potential for increased investment, the development of new technologies, and the expansion into new market segments.
Leading Players in the Renewable Energy Industry in South Africa Market
- JinkoSolar Holding Co Ltd
- Nordex SE
- Juwi Solar Inc
- Vestas Wind Systems A/S
- Siemens Gamesa Renewable Energy SA
- First Solar Inc
- Scatec Solar ASA
- Acciona SA
- Juwi AG
Key Developments in Renewable Energy Industry in South Africa Industry
- December 2022: The sixth renewable energy auction in South Africa resulted in the lowest bid of USD 0.02689/kWh. Five solar projects with a combined capacity of 860 MW were selected.
- October 2022: The African Development Bank granted USD 2.5 Million to support renewable energy expansion in Mozambique through the Mozambique Renewable Energy Integration Program (MREP).
Future Outlook for Renewable Energy Industry in South Africa Market
The future outlook for the South African renewable energy industry is positive, driven by continued government support, technological advancements, and increasing private sector investment. The market is expected to experience significant growth in the coming years, driven by the need for diversification of the energy mix and the transition towards a more sustainable energy future. This will create significant opportunities for investors, businesses, and stakeholders in the renewable energy value chain.
Renewable Energy Industry in South Africa Segmentation
-
1. Source
- 1.1. Solar
- 1.2. Wind
- 1.3. Others
-
2. Geogrpahy
- 2.1. South Africa
- 2.2. Zambia
- 2.3. Mozambique
- 2.4. Angola
- 2.5. Rest of Southern Africa
Renewable Energy Industry in South Africa Segmentation By Geography
-
1. North America
- 1.1. United States
- 1.2. Canada
- 1.3. Mexico
-
2. South America
- 2.1. Brazil
- 2.2. Argentina
- 2.3. Rest of South America
-
3. Europe
- 3.1. United Kingdom
- 3.2. Germany
- 3.3. France
- 3.4. Italy
- 3.5. Spain
- 3.6. Russia
- 3.7. Benelux
- 3.8. Nordics
- 3.9. Rest of Europe
-
4. Middle East & Africa
- 4.1. Turkey
- 4.2. Israel
- 4.3. GCC
- 4.4. North Africa
- 4.5. South Africa
- 4.6. Rest of Middle East & Africa
-
5. Asia Pacific
- 5.1. China
- 5.2. India
- 5.3. Japan
- 5.4. South Korea
- 5.5. ASEAN
- 5.6. Oceania
- 5.7. Rest of Asia Pacific
Renewable Energy Industry in South Africa REPORT HIGHLIGHTS
| Aspects | Details |
|---|---|
| Study Period | 2019-2033 |
| Base Year | 2024 |
| Estimated Year | 2025 |
| Forecast Period | 2025-2033 |
| Historical Period | 2019-2024 |
| Growth Rate | CAGR of > 6.00% from 2019-2033 |
| Segmentation |
|
Table of Contents
- 1. Introduction
- 1.1. Research Scope
- 1.2. Market Segmentation
- 1.3. Research Methodology
- 1.4. Definitions and Assumptions
- 2. Executive Summary
- 2.1. Introduction
- 3. Market Dynamics
- 3.1. Introduction
- 3.2. Market Drivers
- 3.3. Market Restrains
- 3.4. Market Trends
- 3.4.1. Solar Energy is Expected to Drive the Market
- 4. Market Factor Analysis
- 4.1. Porters Five Forces
- 4.2. Supply/Value Chain
- 4.3. PESTEL analysis
- 4.4. Market Entropy
- 4.5. Patent/Trademark Analysis
- 5. Global Renewable Energy Industry in South Africa Analysis, Insights and Forecast, 2019-2031
- 5.1. Market Analysis, Insights and Forecast - by Source
- 5.1.1. Solar
- 5.1.2. Wind
- 5.1.3. Others
- 5.2. Market Analysis, Insights and Forecast - by Geogrpahy
- 5.2.1. South Africa
- 5.2.2. Zambia
- 5.2.3. Mozambique
- 5.2.4. Angola
- 5.2.5. Rest of Southern Africa
- 5.3. Market Analysis, Insights and Forecast - by Region
- 5.3.1. North America
- 5.3.2. South America
- 5.3.3. Europe
- 5.3.4. Middle East & Africa
- 5.3.5. Asia Pacific
- 5.1. Market Analysis, Insights and Forecast - by Source
- 6. North America Renewable Energy Industry in South Africa Analysis, Insights and Forecast, 2019-2031
- 6.1. Market Analysis, Insights and Forecast - by Source
- 6.1.1. Solar
- 6.1.2. Wind
- 6.1.3. Others
- 6.2. Market Analysis, Insights and Forecast - by Geogrpahy
- 6.2.1. South Africa
- 6.2.2. Zambia
- 6.2.3. Mozambique
- 6.2.4. Angola
- 6.2.5. Rest of Southern Africa
- 6.1. Market Analysis, Insights and Forecast - by Source
- 7. South America Renewable Energy Industry in South Africa Analysis, Insights and Forecast, 2019-2031
- 7.1. Market Analysis, Insights and Forecast - by Source
- 7.1.1. Solar
- 7.1.2. Wind
- 7.1.3. Others
- 7.2. Market Analysis, Insights and Forecast - by Geogrpahy
- 7.2.1. South Africa
- 7.2.2. Zambia
- 7.2.3. Mozambique
- 7.2.4. Angola
- 7.2.5. Rest of Southern Africa
- 7.1. Market Analysis, Insights and Forecast - by Source
- 8. Europe Renewable Energy Industry in South Africa Analysis, Insights and Forecast, 2019-2031
- 8.1. Market Analysis, Insights and Forecast - by Source
- 8.1.1. Solar
- 8.1.2. Wind
- 8.1.3. Others
- 8.2. Market Analysis, Insights and Forecast - by Geogrpahy
- 8.2.1. South Africa
- 8.2.2. Zambia
- 8.2.3. Mozambique
- 8.2.4. Angola
- 8.2.5. Rest of Southern Africa
- 8.1. Market Analysis, Insights and Forecast - by Source
- 9. Middle East & Africa Renewable Energy Industry in South Africa Analysis, Insights and Forecast, 2019-2031
- 9.1. Market Analysis, Insights and Forecast - by Source
- 9.1.1. Solar
- 9.1.2. Wind
- 9.1.3. Others
- 9.2. Market Analysis, Insights and Forecast - by Geogrpahy
- 9.2.1. South Africa
- 9.2.2. Zambia
- 9.2.3. Mozambique
- 9.2.4. Angola
- 9.2.5. Rest of Southern Africa
- 9.1. Market Analysis, Insights and Forecast - by Source
- 10. Asia Pacific Renewable Energy Industry in South Africa Analysis, Insights and Forecast, 2019-2031
- 10.1. Market Analysis, Insights and Forecast - by Source
- 10.1.1. Solar
- 10.1.2. Wind
- 10.1.3. Others
- 10.2. Market Analysis, Insights and Forecast - by Geogrpahy
- 10.2.1. South Africa
- 10.2.2. Zambia
- 10.2.3. Mozambique
- 10.2.4. Angola
- 10.2.5. Rest of Southern Africa
- 10.1. Market Analysis, Insights and Forecast - by Source
- 11. Competitive Analysis
- 11.1. Global Market Share Analysis 2024
- 11.2. Company Profiles
- 11.2.1 JinkoSolar Holding Co Ltd
- 11.2.1.1. Overview
- 11.2.1.2. Products
- 11.2.1.3. SWOT Analysis
- 11.2.1.4. Recent Developments
- 11.2.1.5. Financials (Based on Availability)
- 11.2.2 Nordex SE
- 11.2.2.1. Overview
- 11.2.2.2. Products
- 11.2.2.3. SWOT Analysis
- 11.2.2.4. Recent Developments
- 11.2.2.5. Financials (Based on Availability)
- 11.2.3 Juwi Solar Inc
- 11.2.3.1. Overview
- 11.2.3.2. Products
- 11.2.3.3. SWOT Analysis
- 11.2.3.4. Recent Developments
- 11.2.3.5. Financials (Based on Availability)
- 11.2.4 Vestas Wind Systems A/S
- 11.2.4.1. Overview
- 11.2.4.2. Products
- 11.2.4.3. SWOT Analysis
- 11.2.4.4. Recent Developments
- 11.2.4.5. Financials (Based on Availability)
- 11.2.5 Siemens Gamesa Renewable Energy SA
- 11.2.5.1. Overview
- 11.2.5.2. Products
- 11.2.5.3. SWOT Analysis
- 11.2.5.4. Recent Developments
- 11.2.5.5. Financials (Based on Availability)
- 11.2.6 First Solar Inc
- 11.2.6.1. Overview
- 11.2.6.2. Products
- 11.2.6.3. SWOT Analysis
- 11.2.6.4. Recent Developments
- 11.2.6.5. Financials (Based on Availability)
- 11.2.7 Scatec Solar ASA
- 11.2.7.1. Overview
- 11.2.7.2. Products
- 11.2.7.3. SWOT Analysis
- 11.2.7.4. Recent Developments
- 11.2.7.5. Financials (Based on Availability)
- 11.2.8 Acciona SA
- 11.2.8.1. Overview
- 11.2.8.2. Products
- 11.2.8.3. SWOT Analysis
- 11.2.8.4. Recent Developments
- 11.2.8.5. Financials (Based on Availability)
- 11.2.9 Juwi AG*List Not Exhaustive
- 11.2.9.1. Overview
- 11.2.9.2. Products
- 11.2.9.3. SWOT Analysis
- 11.2.9.4. Recent Developments
- 11.2.9.5. Financials (Based on Availability)
- 11.2.1 JinkoSolar Holding Co Ltd
List of Figures
- Figure 1: Global Renewable Energy Industry in South Africa Revenue Breakdown (Million, %) by Region 2024 & 2032
- Figure 2: North America Renewable Energy Industry in South Africa Revenue (Million), by Source 2024 & 2032
- Figure 3: North America Renewable Energy Industry in South Africa Revenue Share (%), by Source 2024 & 2032
- Figure 4: North America Renewable Energy Industry in South Africa Revenue (Million), by Geogrpahy 2024 & 2032
- Figure 5: North America Renewable Energy Industry in South Africa Revenue Share (%), by Geogrpahy 2024 & 2032
- Figure 6: North America Renewable Energy Industry in South Africa Revenue (Million), by Country 2024 & 2032
- Figure 7: North America Renewable Energy Industry in South Africa Revenue Share (%), by Country 2024 & 2032
- Figure 8: South America Renewable Energy Industry in South Africa Revenue (Million), by Source 2024 & 2032
- Figure 9: South America Renewable Energy Industry in South Africa Revenue Share (%), by Source 2024 & 2032
- Figure 10: South America Renewable Energy Industry in South Africa Revenue (Million), by Geogrpahy 2024 & 2032
- Figure 11: South America Renewable Energy Industry in South Africa Revenue Share (%), by Geogrpahy 2024 & 2032
- Figure 12: South America Renewable Energy Industry in South Africa Revenue (Million), by Country 2024 & 2032
- Figure 13: South America Renewable Energy Industry in South Africa Revenue Share (%), by Country 2024 & 2032
- Figure 14: Europe Renewable Energy Industry in South Africa Revenue (Million), by Source 2024 & 2032
- Figure 15: Europe Renewable Energy Industry in South Africa Revenue Share (%), by Source 2024 & 2032
- Figure 16: Europe Renewable Energy Industry in South Africa Revenue (Million), by Geogrpahy 2024 & 2032
- Figure 17: Europe Renewable Energy Industry in South Africa Revenue Share (%), by Geogrpahy 2024 & 2032
- Figure 18: Europe Renewable Energy Industry in South Africa Revenue (Million), by Country 2024 & 2032
- Figure 19: Europe Renewable Energy Industry in South Africa Revenue Share (%), by Country 2024 & 2032
- Figure 20: Middle East & Africa Renewable Energy Industry in South Africa Revenue (Million), by Source 2024 & 2032
- Figure 21: Middle East & Africa Renewable Energy Industry in South Africa Revenue Share (%), by Source 2024 & 2032
- Figure 22: Middle East & Africa Renewable Energy Industry in South Africa Revenue (Million), by Geogrpahy 2024 & 2032
- Figure 23: Middle East & Africa Renewable Energy Industry in South Africa Revenue Share (%), by Geogrpahy 2024 & 2032
- Figure 24: Middle East & Africa Renewable Energy Industry in South Africa Revenue (Million), by Country 2024 & 2032
- Figure 25: Middle East & Africa Renewable Energy Industry in South Africa Revenue Share (%), by Country 2024 & 2032
- Figure 26: Asia Pacific Renewable Energy Industry in South Africa Revenue (Million), by Source 2024 & 2032
- Figure 27: Asia Pacific Renewable Energy Industry in South Africa Revenue Share (%), by Source 2024 & 2032
- Figure 28: Asia Pacific Renewable Energy Industry in South Africa Revenue (Million), by Geogrpahy 2024 & 2032
- Figure 29: Asia Pacific Renewable Energy Industry in South Africa Revenue Share (%), by Geogrpahy 2024 & 2032
- Figure 30: Asia Pacific Renewable Energy Industry in South Africa Revenue (Million), by Country 2024 & 2032
- Figure 31: Asia Pacific Renewable Energy Industry in South Africa Revenue Share (%), by Country 2024 & 2032
List of Tables
- Table 1: Global Renewable Energy Industry in South Africa Revenue Million Forecast, by Region 2019 & 2032
- Table 2: Global Renewable Energy Industry in South Africa Revenue Million Forecast, by Source 2019 & 2032
- Table 3: Global Renewable Energy Industry in South Africa Revenue Million Forecast, by Geogrpahy 2019 & 2032
- Table 4: Global Renewable Energy Industry in South Africa Revenue Million Forecast, by Region 2019 & 2032
- Table 5: Global Renewable Energy Industry in South Africa Revenue Million Forecast, by Source 2019 & 2032
- Table 6: Global Renewable Energy Industry in South Africa Revenue Million Forecast, by Geogrpahy 2019 & 2032
- Table 7: Global Renewable Energy Industry in South Africa Revenue Million Forecast, by Country 2019 & 2032
- Table 8: United States Renewable Energy Industry in South Africa Revenue (Million) Forecast, by Application 2019 & 2032
- Table 9: Canada Renewable Energy Industry in South Africa Revenue (Million) Forecast, by Application 2019 & 2032
- Table 10: Mexico Renewable Energy Industry in South Africa Revenue (Million) Forecast, by Application 2019 & 2032
- Table 11: Global Renewable Energy Industry in South Africa Revenue Million Forecast, by Source 2019 & 2032
- Table 12: Global Renewable Energy Industry in South Africa Revenue Million Forecast, by Geogrpahy 2019 & 2032
- Table 13: Global Renewable Energy Industry in South Africa Revenue Million Forecast, by Country 2019 & 2032
- Table 14: Brazil Renewable Energy Industry in South Africa Revenue (Million) Forecast, by Application 2019 & 2032
- Table 15: Argentina Renewable Energy Industry in South Africa Revenue (Million) Forecast, by Application 2019 & 2032
- Table 16: Rest of South America Renewable Energy Industry in South Africa Revenue (Million) Forecast, by Application 2019 & 2032
- Table 17: Global Renewable Energy Industry in South Africa Revenue Million Forecast, by Source 2019 & 2032
- Table 18: Global Renewable Energy Industry in South Africa Revenue Million Forecast, by Geogrpahy 2019 & 2032
- Table 19: Global Renewable Energy Industry in South Africa Revenue Million Forecast, by Country 2019 & 2032
- Table 20: United Kingdom Renewable Energy Industry in South Africa Revenue (Million) Forecast, by Application 2019 & 2032
- Table 21: Germany Renewable Energy Industry in South Africa Revenue (Million) Forecast, by Application 2019 & 2032
- Table 22: France Renewable Energy Industry in South Africa Revenue (Million) Forecast, by Application 2019 & 2032
- Table 23: Italy Renewable Energy Industry in South Africa Revenue (Million) Forecast, by Application 2019 & 2032
- Table 24: Spain Renewable Energy Industry in South Africa Revenue (Million) Forecast, by Application 2019 & 2032
- Table 25: Russia Renewable Energy Industry in South Africa Revenue (Million) Forecast, by Application 2019 & 2032
- Table 26: Benelux Renewable Energy Industry in South Africa Revenue (Million) Forecast, by Application 2019 & 2032
- Table 27: Nordics Renewable Energy Industry in South Africa Revenue (Million) Forecast, by Application 2019 & 2032
- Table 28: Rest of Europe Renewable Energy Industry in South Africa Revenue (Million) Forecast, by Application 2019 & 2032
- Table 29: Global Renewable Energy Industry in South Africa Revenue Million Forecast, by Source 2019 & 2032
- Table 30: Global Renewable Energy Industry in South Africa Revenue Million Forecast, by Geogrpahy 2019 & 2032
- Table 31: Global Renewable Energy Industry in South Africa Revenue Million Forecast, by Country 2019 & 2032
- Table 32: Turkey Renewable Energy Industry in South Africa Revenue (Million) Forecast, by Application 2019 & 2032
- Table 33: Israel Renewable Energy Industry in South Africa Revenue (Million) Forecast, by Application 2019 & 2032
- Table 34: GCC Renewable Energy Industry in South Africa Revenue (Million) Forecast, by Application 2019 & 2032
- Table 35: North Africa Renewable Energy Industry in South Africa Revenue (Million) Forecast, by Application 2019 & 2032
- Table 36: South Africa Renewable Energy Industry in South Africa Revenue (Million) Forecast, by Application 2019 & 2032
- Table 37: Rest of Middle East & Africa Renewable Energy Industry in South Africa Revenue (Million) Forecast, by Application 2019 & 2032
- Table 38: Global Renewable Energy Industry in South Africa Revenue Million Forecast, by Source 2019 & 2032
- Table 39: Global Renewable Energy Industry in South Africa Revenue Million Forecast, by Geogrpahy 2019 & 2032
- Table 40: Global Renewable Energy Industry in South Africa Revenue Million Forecast, by Country 2019 & 2032
- Table 41: China Renewable Energy Industry in South Africa Revenue (Million) Forecast, by Application 2019 & 2032
- Table 42: India Renewable Energy Industry in South Africa Revenue (Million) Forecast, by Application 2019 & 2032
- Table 43: Japan Renewable Energy Industry in South Africa Revenue (Million) Forecast, by Application 2019 & 2032
- Table 44: South Korea Renewable Energy Industry in South Africa Revenue (Million) Forecast, by Application 2019 & 2032
- Table 45: ASEAN Renewable Energy Industry in South Africa Revenue (Million) Forecast, by Application 2019 & 2032
- Table 46: Oceania Renewable Energy Industry in South Africa Revenue (Million) Forecast, by Application 2019 & 2032
- Table 47: Rest of Asia Pacific Renewable Energy Industry in South Africa Revenue (Million) Forecast, by Application 2019 & 2032
Frequently Asked Questions
1. What is the projected Compound Annual Growth Rate (CAGR) of the Renewable Energy Industry in South Africa?
The projected CAGR is approximately > 6.00%.
2. Which companies are prominent players in the Renewable Energy Industry in South Africa?
Key companies in the market include JinkoSolar Holding Co Ltd, Nordex SE, Juwi Solar Inc, Vestas Wind Systems A/S, Siemens Gamesa Renewable Energy SA, First Solar Inc, Scatec Solar ASA, Acciona SA, Juwi AG*List Not Exhaustive.
3. What are the main segments of the Renewable Energy Industry in South Africa?
The market segments include Source, Geogrpahy.
4. Can you provide details about the market size?
The market size is estimated to be USD XX Million as of 2022.
5. What are some drivers contributing to market growth?
N/A
6. What are the notable trends driving market growth?
Solar Energy is Expected to Drive the Market.
7. Are there any restraints impacting market growth?
N/A
8. Can you provide examples of recent developments in the market?
December 2022: the sixth renewable auction in South Africa concluded with the lowest bid of USD 0.02689/kWh. South Africa selected five solar projects with a combined capacity of 860 MW.
9. What pricing options are available for accessing the report?
Pricing options include single-user, multi-user, and enterprise licenses priced at USD 4750, USD 5250, and USD 8750 respectively.
10. Is the market size provided in terms of value or volume?
The market size is provided in terms of value, measured in Million.
11. Are there any specific market keywords associated with the report?
Yes, the market keyword associated with the report is "Renewable Energy Industry in South Africa," which aids in identifying and referencing the specific market segment covered.
12. How do I determine which pricing option suits my needs best?
The pricing options vary based on user requirements and access needs. Individual users may opt for single-user licenses, while businesses requiring broader access may choose multi-user or enterprise licenses for cost-effective access to the report.
13. Are there any additional resources or data provided in the Renewable Energy Industry in South Africa report?
While the report offers comprehensive insights, it's advisable to review the specific contents or supplementary materials provided to ascertain if additional resources or data are available.
14. How can I stay updated on further developments or reports in the Renewable Energy Industry in South Africa?
To stay informed about further developments, trends, and reports in the Renewable Energy Industry in South Africa, consider subscribing to industry newsletters, following relevant companies and organizations, or regularly checking reputable industry news sources and publications.
Methodology
Step 1 - Identification of Relevant Samples Size from Population Database


Step 2 - Approaches for Defining Global Market Size (Value, Volume* & Price*)

Note*: In applicable scenarios
Step 3 - Data Sources
Primary Research
- Web Analytics
- Survey Reports
- Research Institute
- Latest Research Reports
- Opinion Leaders
Secondary Research
- Annual Reports
- White Paper
- Latest Press Release
- Industry Association
- Paid Database
- Investor Presentations

Step 4 - Data Triangulation
Involves using different sources of information in order to increase the validity of a study
These sources are likely to be stakeholders in a program - participants, other researchers, program staff, other community members, and so on.
Then we put all data in single framework & apply various statistical tools to find out the dynamic on the market.
During the analysis stage, feedback from the stakeholder groups would be compared to determine areas of agreement as well as areas of divergence


