
Key Insights
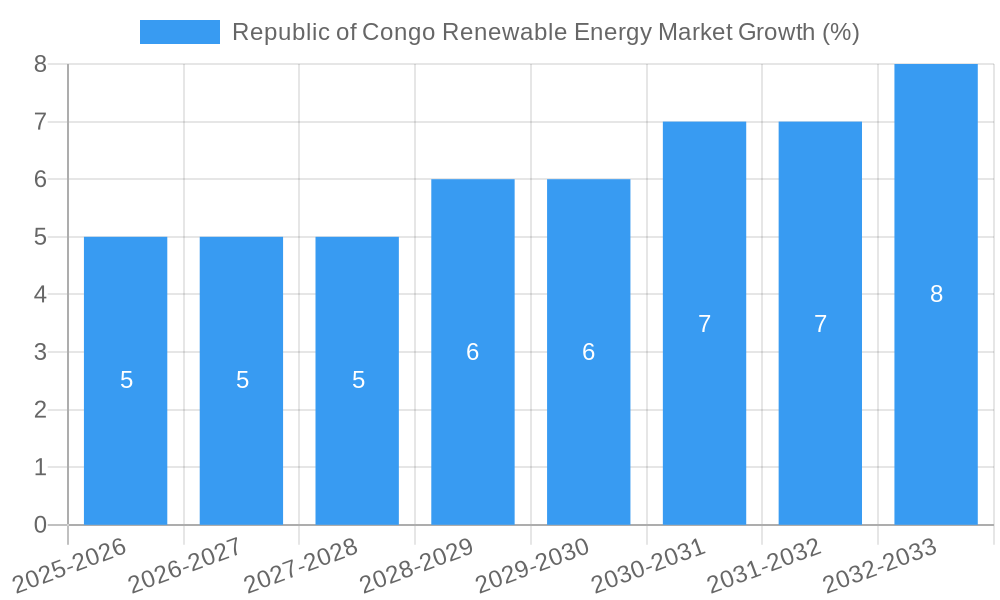
The Republic of Congo's renewable energy market, while currently underdeveloped, presents significant growth potential driven by increasing electricity demand, unreliable grid infrastructure, and a commitment to diversifying its energy mix. The country's abundant hydropower resources, coupled with emerging solar and wind potential, offer opportunities for substantial expansion. While a precise market size for 2025 is unavailable, considering a global CAGR of >0.50% and the substantial untapped potential in the Congo, a reasonable estimate for the 2025 market size could be placed between $50 million and $100 million USD. This estimate considers the relatively small size of the Congolese economy and the nascent stage of renewable energy development. Growth will likely be fueled by investments in both large-scale hydropower projects and smaller-scale solar installations, particularly in rural areas lacking grid access. Government initiatives promoting renewable energy adoption and attracting foreign investment will play a crucial role in accelerating market expansion. Key challenges include securing funding for large-scale projects, developing local expertise in renewable energy technologies, and addressing environmental and social considerations associated with large hydroelectric projects. The residential and commercial sectors are expected to drive initial growth, followed by gradual penetration into the industrial sector as costs decrease and policy support strengthens. Looking ahead to 2033, consistent governmental support and private sector engagement are vital for the Republic of Congo to unlock the full economic and social benefits of its renewable energy resources and achieve sustainable development goals.
The Republic of Congo's renewable energy sector faces constraints such as limited financial resources, a lack of skilled labor, and the need for improved regulatory frameworks to attract investors. However, the potential rewards are considerable, including enhanced energy security, reduced reliance on fossil fuels, and improved access to electricity in remote areas. Specific segments like hydropower, with its established presence, will likely continue to dominate. However, solar and wind energy are poised for significant growth, particularly in decentralized applications. The success of the Republic of Congo's renewable energy transition will depend on targeted policy interventions, including clear regulatory frameworks that provide attractive incentives for investment, robust grid infrastructure development, and capacity building initiatives to develop local expertise. International partnerships and collaborations will also play a vital role in technology transfer and financing large-scale projects.
Republic of Congo Renewable Energy Market: A Comprehensive Report (2019-2033)
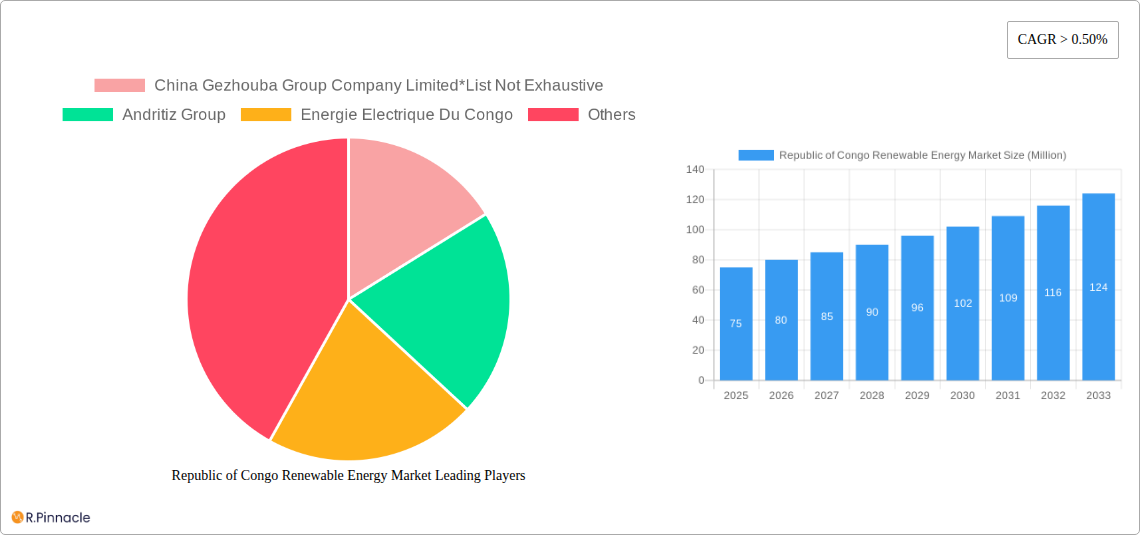
This in-depth report provides a comprehensive analysis of the Republic of Congo's renewable energy market, offering invaluable insights for industry professionals, investors, and policymakers. The study period covers 2019-2033, with a base year of 2025 and a forecast period of 2025-2033. The report leverages extensive data from the historical period (2019-2024) to provide accurate and reliable market projections. Key segments analyzed include solar, wind, hydropower, geothermal, and biomass energy, across residential, commercial, industrial, and transportation applications. Leading players like China Gezhouba Group Company Limited, Andritiz Group, and Energie Electrique Du Congo are profiled, revealing market dynamics and future opportunities.
Republic of Congo Renewable Energy Market Structure & Innovation Trends
This section analyzes the Republic of Congo's renewable energy market structure, highlighting market concentration, innovation drivers, and regulatory influences. We delve into the competitive landscape, assessing market share among key players and evaluating the impact of mergers and acquisitions (M&A) activities. The analysis considers factors like technological advancements, government policies, and evolving consumer preferences. Expected M&A deal values are estimated at xx Million. The report also examines the influence of substitute products and end-user demographics on market growth. Market share data for key players will be included, along with a detailed examination of the regulatory frameworks shaping the industry.
Republic of Congo Renewable Energy Market Market Dynamics & Trends
This section explores the key dynamics driving the Republic of Congo's renewable energy market. We analyze market growth drivers, technological advancements, evolving consumer preferences, and the competitive landscape. The Compound Annual Growth Rate (CAGR) for the forecast period (2025-2033) will be provided, alongside an assessment of market penetration rates for different renewable energy technologies. Detailed analyses of consumer behavior, technological disruptions, and their impact on market growth are included. The interplay between these factors and their influence on market size (estimated at xx Million in 2025) are thoroughly examined.
Dominant Regions & Segments in Republic of Congo Renewable Energy Market
This section identifies the leading regions and segments within the Republic of Congo's renewable energy market. The analysis considers both the type of renewable energy (solar, wind, hydropower, geothermal, biomass) and its application (residential, commercial, industrial, transportation).
- Key Drivers for Dominant Segments:
- Favorable government policies and incentives.
- Availability of suitable infrastructure.
- Technological advancements and cost reductions.
- Growing energy demand.
- Sustainable development goals.
We provide a detailed analysis of why specific regions and segments are dominant, incorporating economic policies, infrastructure availability, and other relevant factors. The market dominance analysis includes specific data and insights for each region and segment.
Republic of Congo Renewable Energy Market Product Innovations
This section summarizes recent product developments and technological trends shaping the Republic of Congo's renewable energy market. We highlight innovative products, their applications, and their competitive advantages. The focus is on how these innovations are addressing market needs and driving market growth, along with a projection of future technological advancements.
Report Scope & Segmentation Analysis
This report segments the Republic of Congo's renewable energy market by both energy type and application.
- By Type: Solar, Wind, Hydropower, Geothermal, Biomass. Each segment's growth projections, market size (in Million), and competitive dynamics are analyzed.
- By Application: Residential, Commercial, Industrial, Transportation. Growth forecasts and competitive landscapes are provided for each application segment.
Key Drivers of Republic of Congo Renewable Energy Market Growth
Several factors contribute to the growth of the Republic of Congo's renewable energy market. These include government support through favorable policies and incentives, increasing energy demand, a commitment to sustainable development, and decreasing costs of renewable energy technologies. Technological advancements are also significantly driving market growth.
Challenges in the Republic of Congo Renewable Energy Market Sector
Despite significant potential, the Republic of Congo's renewable energy market faces certain challenges. These include limited access to finance, infrastructure constraints, regulatory hurdles, and a lack of skilled workforce. These factors can impede market growth and require attention from stakeholders for effective market development.
Emerging Opportunities in Republic of Congo Renewable Energy Market
The Republic of Congo's renewable energy market presents significant opportunities. The growing demand for sustainable energy, coupled with supportive government initiatives and technological advancements, offers lucrative prospects for investors and businesses. Further exploration of off-grid solutions and decentralized energy systems is expected to unlock new growth avenues.
Leading Players in the Republic of Congo Renewable Energy Market Market
- China Gezhouba Group Company Limited
- Andritiz Group
- Energie Electrique Du Congo
Key Developments in Republic of Congo Renewable Energy Market Industry
- May 2021: China Gezhouba Group received a contract to build the 600 MW Chollet Hydroelectric Dam on the Dja River, a project estimated to cost between XAF 354 and XAF 670 Billion. This significant development underscores the government's commitment to renewable energy and will significantly impact market dynamics.
Future Outlook for Republic of Congo Renewable Energy Market Market
The Republic of Congo's renewable energy market is poised for significant growth in the coming years. Continued government support, technological advancements, and increasing private sector investments are expected to drive expansion. The market presents strong potential for both domestic and international players.
Republic of Congo Renewable Energy Market Segmentation
- 1. Solar
- 2. Hydro
- 3. Others
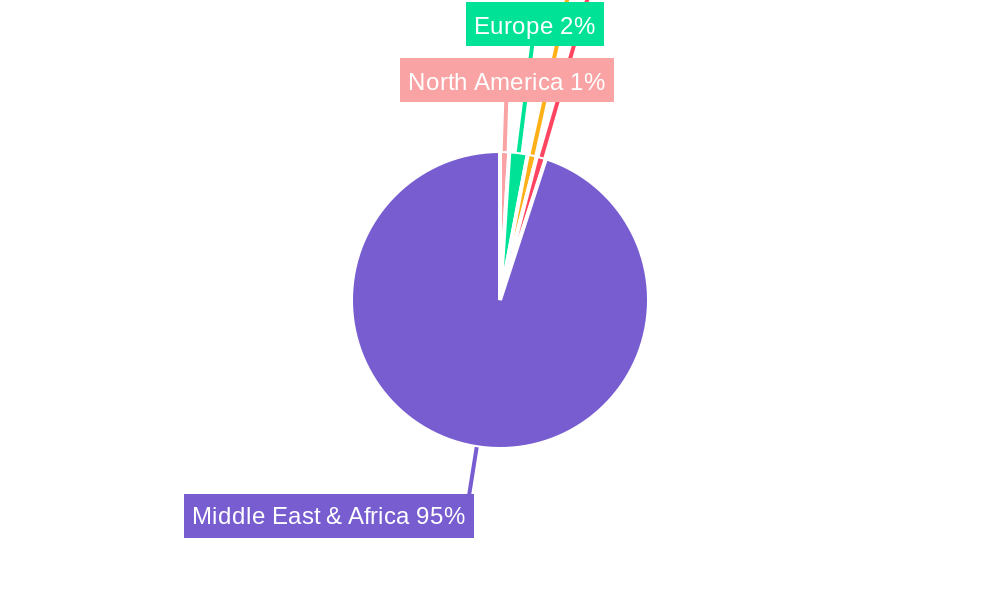
Republic of Congo Renewable Energy Market Segmentation By Geography
-
1. North America
- 1.1. United States
- 1.2. Canada
- 1.3. Mexico
-
2. South America
- 2.1. Brazil
- 2.2. Argentina
- 2.3. Rest of South America
-
3. Europe
- 3.1. United Kingdom
- 3.2. Germany
- 3.3. France
- 3.4. Italy
- 3.5. Spain
- 3.6. Russia
- 3.7. Benelux
- 3.8. Nordics
- 3.9. Rest of Europe
-
4. Middle East & Africa
- 4.1. Turkey
- 4.2. Israel
- 4.3. GCC
- 4.4. North Africa
- 4.5. South Africa
- 4.6. Rest of Middle East & Africa
-
5. Asia Pacific
- 5.1. China
- 5.2. India
- 5.3. Japan
- 5.4. South Korea
- 5.5. ASEAN
- 5.6. Oceania
- 5.7. Rest of Asia Pacific
Republic of Congo Renewable Energy Market REPORT HIGHLIGHTS
| Aspects | Details |
|---|---|
| Study Period | 2019-2033 |
| Base Year | 2024 |
| Estimated Year | 2025 |
| Forecast Period | 2025-2033 |
| Historical Period | 2019-2024 |
| Growth Rate | CAGR of > 0.50% from 2019-2033 |
| Segmentation |
|
Table of Contents
- 1. Introduction
- 1.1. Research Scope
- 1.2. Market Segmentation
- 1.3. Research Methodology
- 1.4. Definitions and Assumptions
- 2. Executive Summary
- 2.1. Introduction
- 3. Market Dynamics
- 3.1. Introduction
- 3.2. Market Drivers
- 3.2.1. 4.; The Increasing Demand from the EV4.; Growing Renewable Energy Market
- 3.3. Market Restrains
- 3.3.1. 4.; Demand-Supply Mismatch for Raw Materials
- 3.4. Market Trends
- 3.4.1. Hydropower likely to Dominate
- 4. Market Factor Analysis
- 4.1. Porters Five Forces
- 4.2. Supply/Value Chain
- 4.3. PESTEL analysis
- 4.4. Market Entropy
- 4.5. Patent/Trademark Analysis
- 5. Global Republic of Congo Renewable Energy Market Analysis, Insights and Forecast, 2019-2031
- 5.1. Market Analysis, Insights and Forecast - by Solar
- 5.2. Market Analysis, Insights and Forecast - by Hydro
- 5.3. Market Analysis, Insights and Forecast - by Others
- 5.4. Market Analysis, Insights and Forecast - by Region
- 5.4.1. North America
- 5.4.2. South America
- 5.4.3. Europe
- 5.4.4. Middle East & Africa
- 5.4.5. Asia Pacific
- 5.1. Market Analysis, Insights and Forecast - by Solar
- 6. North America Republic of Congo Renewable Energy Market Analysis, Insights and Forecast, 2019-2031
- 6.1. Market Analysis, Insights and Forecast - by Solar
- 6.2. Market Analysis, Insights and Forecast - by Hydro
- 6.3. Market Analysis, Insights and Forecast - by Others
- 6.1. Market Analysis, Insights and Forecast - by Solar
- 7. South America Republic of Congo Renewable Energy Market Analysis, Insights and Forecast, 2019-2031
- 7.1. Market Analysis, Insights and Forecast - by Solar
- 7.2. Market Analysis, Insights and Forecast - by Hydro
- 7.3. Market Analysis, Insights and Forecast - by Others
- 7.1. Market Analysis, Insights and Forecast - by Solar
- 8. Europe Republic of Congo Renewable Energy Market Analysis, Insights and Forecast, 2019-2031
- 8.1. Market Analysis, Insights and Forecast - by Solar
- 8.2. Market Analysis, Insights and Forecast - by Hydro
- 8.3. Market Analysis, Insights and Forecast - by Others
- 8.1. Market Analysis, Insights and Forecast - by Solar
- 9. Middle East & Africa Republic of Congo Renewable Energy Market Analysis, Insights and Forecast, 2019-2031
- 9.1. Market Analysis, Insights and Forecast - by Solar
- 9.2. Market Analysis, Insights and Forecast - by Hydro
- 9.3. Market Analysis, Insights and Forecast - by Others
- 9.1. Market Analysis, Insights and Forecast - by Solar
- 10. Asia Pacific Republic of Congo Renewable Energy Market Analysis, Insights and Forecast, 2019-2031
- 10.1. Market Analysis, Insights and Forecast - by Solar
- 10.2. Market Analysis, Insights and Forecast - by Hydro
- 10.3. Market Analysis, Insights and Forecast - by Others
- 10.1. Market Analysis, Insights and Forecast - by Solar
- 11. North America Republic of Congo Renewable Energy Market Analysis, Insights and Forecast, 2019-2031
- 11.1. Market Analysis, Insights and Forecast - By Country/Sub-region
- 11.1.1 United States
- 11.1.2 Canada
- 11.1.3 Mexico
- 11.1.4 Rest of North America
- 12. Europe Republic of Congo Renewable Energy Market Analysis, Insights and Forecast, 2019-2031
- 12.1. Market Analysis, Insights and Forecast - By Country/Sub-region
- 12.1.1 Germany
- 12.1.2 United Kingdom
- 12.1.3 France
- 12.1.4 Spain
- 12.1.5 Italy
- 12.1.6 Spain
- 12.1.7 Belgium
- 12.1.8 Netherland
- 12.1.9 Nordics
- 12.1.10 Rest of Europe
- 13. Asia Pacific Republic of Congo Renewable Energy Market Analysis, Insights and Forecast, 2019-2031
- 13.1. Market Analysis, Insights and Forecast - By Country/Sub-region
- 13.1.1 China
- 13.1.2 Japan
- 13.1.3 India
- 13.1.4 South Korea
- 13.1.5 Southeast Asia
- 13.1.6 Australia
- 13.1.7 Indonesia
- 13.1.8 Phillipes
- 13.1.9 Singapore
- 13.1.10 Thailandc
- 13.1.11 Rest of Asia Pacific
- 14. South America Republic of Congo Renewable Energy Market Analysis, Insights and Forecast, 2019-2031
- 14.1. Market Analysis, Insights and Forecast - By Country/Sub-region
- 14.1.1 Brazil
- 14.1.2 Argentina
- 14.1.3 Peru
- 14.1.4 Chile
- 14.1.5 Colombia
- 14.1.6 Ecuador
- 14.1.7 Venezuela
- 14.1.8 Rest of South America
- 15. Middle East & Africa Republic of Congo Renewable Energy Market Analysis, Insights and Forecast, 2019-2031
- 15.1. Market Analysis, Insights and Forecast - By Country/Sub-region
- 15.1.1 UAE
- 15.1.2 South Africa
- 15.1.3 Saudi Arabia
- 15.1.4 Rest of MEA
- 16. Competitive Analysis
- 16.1. Global Market Share Analysis 2024
- 16.2. Company Profiles
- 16.2.1 China Gezhouba Group Company Limited*List Not Exhaustive
- 16.2.1.1. Overview
- 16.2.1.2. Products
- 16.2.1.3. SWOT Analysis
- 16.2.1.4. Recent Developments
- 16.2.1.5. Financials (Based on Availability)
- 16.2.2 Andritiz Group
- 16.2.2.1. Overview
- 16.2.2.2. Products
- 16.2.2.3. SWOT Analysis
- 16.2.2.4. Recent Developments
- 16.2.2.5. Financials (Based on Availability)
- 16.2.3 Energie Electrique Du Congo
- 16.2.3.1. Overview
- 16.2.3.2. Products
- 16.2.3.3. SWOT Analysis
- 16.2.3.4. Recent Developments
- 16.2.3.5. Financials (Based on Availability)
- 16.2.1 China Gezhouba Group Company Limited*List Not Exhaustive
List of Figures
- Figure 1: Global Republic of Congo Renewable Energy Market Revenue Breakdown (Million, %) by Region 2024 & 2032
- Figure 2: North America Republic of Congo Renewable Energy Market Revenue (Million), by Country 2024 & 2032
- Figure 3: North America Republic of Congo Renewable Energy Market Revenue Share (%), by Country 2024 & 2032
- Figure 4: Europe Republic of Congo Renewable Energy Market Revenue (Million), by Country 2024 & 2032
- Figure 5: Europe Republic of Congo Renewable Energy Market Revenue Share (%), by Country 2024 & 2032
- Figure 6: Asia Pacific Republic of Congo Renewable Energy Market Revenue (Million), by Country 2024 & 2032
- Figure 7: Asia Pacific Republic of Congo Renewable Energy Market Revenue Share (%), by Country 2024 & 2032
- Figure 8: South America Republic of Congo Renewable Energy Market Revenue (Million), by Country 2024 & 2032
- Figure 9: South America Republic of Congo Renewable Energy Market Revenue Share (%), by Country 2024 & 2032
- Figure 10: Middle East & Africa Republic of Congo Renewable Energy Market Revenue (Million), by Country 2024 & 2032
- Figure 11: Middle East & Africa Republic of Congo Renewable Energy Market Revenue Share (%), by Country 2024 & 2032
- Figure 12: North America Republic of Congo Renewable Energy Market Revenue (Million), by Solar 2024 & 2032
- Figure 13: North America Republic of Congo Renewable Energy Market Revenue Share (%), by Solar 2024 & 2032
- Figure 14: North America Republic of Congo Renewable Energy Market Revenue (Million), by Hydro 2024 & 2032
- Figure 15: North America Republic of Congo Renewable Energy Market Revenue Share (%), by Hydro 2024 & 2032
- Figure 16: North America Republic of Congo Renewable Energy Market Revenue (Million), by Others 2024 & 2032
- Figure 17: North America Republic of Congo Renewable Energy Market Revenue Share (%), by Others 2024 & 2032
- Figure 18: North America Republic of Congo Renewable Energy Market Revenue (Million), by Country 2024 & 2032
- Figure 19: North America Republic of Congo Renewable Energy Market Revenue Share (%), by Country 2024 & 2032
- Figure 20: South America Republic of Congo Renewable Energy Market Revenue (Million), by Solar 2024 & 2032
- Figure 21: South America Republic of Congo Renewable Energy Market Revenue Share (%), by Solar 2024 & 2032
- Figure 22: South America Republic of Congo Renewable Energy Market Revenue (Million), by Hydro 2024 & 2032
- Figure 23: South America Republic of Congo Renewable Energy Market Revenue Share (%), by Hydro 2024 & 2032
- Figure 24: South America Republic of Congo Renewable Energy Market Revenue (Million), by Others 2024 & 2032
- Figure 25: South America Republic of Congo Renewable Energy Market Revenue Share (%), by Others 2024 & 2032
- Figure 26: South America Republic of Congo Renewable Energy Market Revenue (Million), by Country 2024 & 2032
- Figure 27: South America Republic of Congo Renewable Energy Market Revenue Share (%), by Country 2024 & 2032
- Figure 28: Europe Republic of Congo Renewable Energy Market Revenue (Million), by Solar 2024 & 2032
- Figure 29: Europe Republic of Congo Renewable Energy Market Revenue Share (%), by Solar 2024 & 2032
- Figure 30: Europe Republic of Congo Renewable Energy Market Revenue (Million), by Hydro 2024 & 2032
- Figure 31: Europe Republic of Congo Renewable Energy Market Revenue Share (%), by Hydro 2024 & 2032
- Figure 32: Europe Republic of Congo Renewable Energy Market Revenue (Million), by Others 2024 & 2032
- Figure 33: Europe Republic of Congo Renewable Energy Market Revenue Share (%), by Others 2024 & 2032
- Figure 34: Europe Republic of Congo Renewable Energy Market Revenue (Million), by Country 2024 & 2032
- Figure 35: Europe Republic of Congo Renewable Energy Market Revenue Share (%), by Country 2024 & 2032
- Figure 36: Middle East & Africa Republic of Congo Renewable Energy Market Revenue (Million), by Solar 2024 & 2032
- Figure 37: Middle East & Africa Republic of Congo Renewable Energy Market Revenue Share (%), by Solar 2024 & 2032
- Figure 38: Middle East & Africa Republic of Congo Renewable Energy Market Revenue (Million), by Hydro 2024 & 2032
- Figure 39: Middle East & Africa Republic of Congo Renewable Energy Market Revenue Share (%), by Hydro 2024 & 2032
- Figure 40: Middle East & Africa Republic of Congo Renewable Energy Market Revenue (Million), by Others 2024 & 2032
- Figure 41: Middle East & Africa Republic of Congo Renewable Energy Market Revenue Share (%), by Others 2024 & 2032
- Figure 42: Middle East & Africa Republic of Congo Renewable Energy Market Revenue (Million), by Country 2024 & 2032
- Figure 43: Middle East & Africa Republic of Congo Renewable Energy Market Revenue Share (%), by Country 2024 & 2032
- Figure 44: Asia Pacific Republic of Congo Renewable Energy Market Revenue (Million), by Solar 2024 & 2032
- Figure 45: Asia Pacific Republic of Congo Renewable Energy Market Revenue Share (%), by Solar 2024 & 2032
- Figure 46: Asia Pacific Republic of Congo Renewable Energy Market Revenue (Million), by Hydro 2024 & 2032
- Figure 47: Asia Pacific Republic of Congo Renewable Energy Market Revenue Share (%), by Hydro 2024 & 2032
- Figure 48: Asia Pacific Republic of Congo Renewable Energy Market Revenue (Million), by Others 2024 & 2032
- Figure 49: Asia Pacific Republic of Congo Renewable Energy Market Revenue Share (%), by Others 2024 & 2032
- Figure 50: Asia Pacific Republic of Congo Renewable Energy Market Revenue (Million), by Country 2024 & 2032
- Figure 51: Asia Pacific Republic of Congo Renewable Energy Market Revenue Share (%), by Country 2024 & 2032
List of Tables
- Table 1: Global Republic of Congo Renewable Energy Market Revenue Million Forecast, by Region 2019 & 2032
- Table 2: Global Republic of Congo Renewable Energy Market Revenue Million Forecast, by Solar 2019 & 2032
- Table 3: Global Republic of Congo Renewable Energy Market Revenue Million Forecast, by Hydro 2019 & 2032
- Table 4: Global Republic of Congo Renewable Energy Market Revenue Million Forecast, by Others 2019 & 2032
- Table 5: Global Republic of Congo Renewable Energy Market Revenue Million Forecast, by Region 2019 & 2032
- Table 6: Global Republic of Congo Renewable Energy Market Revenue Million Forecast, by Country 2019 & 2032
- Table 7: United States Republic of Congo Renewable Energy Market Revenue (Million) Forecast, by Application 2019 & 2032
- Table 8: Canada Republic of Congo Renewable Energy Market Revenue (Million) Forecast, by Application 2019 & 2032
- Table 9: Mexico Republic of Congo Renewable Energy Market Revenue (Million) Forecast, by Application 2019 & 2032
- Table 10: Rest of North America Republic of Congo Renewable Energy Market Revenue (Million) Forecast, by Application 2019 & 2032
- Table 11: Global Republic of Congo Renewable Energy Market Revenue Million Forecast, by Country 2019 & 2032
- Table 12: Germany Republic of Congo Renewable Energy Market Revenue (Million) Forecast, by Application 2019 & 2032
- Table 13: United Kingdom Republic of Congo Renewable Energy Market Revenue (Million) Forecast, by Application 2019 & 2032
- Table 14: France Republic of Congo Renewable Energy Market Revenue (Million) Forecast, by Application 2019 & 2032
- Table 15: Spain Republic of Congo Renewable Energy Market Revenue (Million) Forecast, by Application 2019 & 2032
- Table 16: Italy Republic of Congo Renewable Energy Market Revenue (Million) Forecast, by Application 2019 & 2032
- Table 17: Spain Republic of Congo Renewable Energy Market Revenue (Million) Forecast, by Application 2019 & 2032
- Table 18: Belgium Republic of Congo Renewable Energy Market Revenue (Million) Forecast, by Application 2019 & 2032
- Table 19: Netherland Republic of Congo Renewable Energy Market Revenue (Million) Forecast, by Application 2019 & 2032
- Table 20: Nordics Republic of Congo Renewable Energy Market Revenue (Million) Forecast, by Application 2019 & 2032
- Table 21: Rest of Europe Republic of Congo Renewable Energy Market Revenue (Million) Forecast, by Application 2019 & 2032
- Table 22: Global Republic of Congo Renewable Energy Market Revenue Million Forecast, by Country 2019 & 2032
- Table 23: China Republic of Congo Renewable Energy Market Revenue (Million) Forecast, by Application 2019 & 2032
- Table 24: Japan Republic of Congo Renewable Energy Market Revenue (Million) Forecast, by Application 2019 & 2032
- Table 25: India Republic of Congo Renewable Energy Market Revenue (Million) Forecast, by Application 2019 & 2032
- Table 26: South Korea Republic of Congo Renewable Energy Market Revenue (Million) Forecast, by Application 2019 & 2032
- Table 27: Southeast Asia Republic of Congo Renewable Energy Market Revenue (Million) Forecast, by Application 2019 & 2032
- Table 28: Australia Republic of Congo Renewable Energy Market Revenue (Million) Forecast, by Application 2019 & 2032
- Table 29: Indonesia Republic of Congo Renewable Energy Market Revenue (Million) Forecast, by Application 2019 & 2032
- Table 30: Phillipes Republic of Congo Renewable Energy Market Revenue (Million) Forecast, by Application 2019 & 2032
- Table 31: Singapore Republic of Congo Renewable Energy Market Revenue (Million) Forecast, by Application 2019 & 2032
- Table 32: Thailandc Republic of Congo Renewable Energy Market Revenue (Million) Forecast, by Application 2019 & 2032
- Table 33: Rest of Asia Pacific Republic of Congo Renewable Energy Market Revenue (Million) Forecast, by Application 2019 & 2032
- Table 34: Global Republic of Congo Renewable Energy Market Revenue Million Forecast, by Country 2019 & 2032
- Table 35: Brazil Republic of Congo Renewable Energy Market Revenue (Million) Forecast, by Application 2019 & 2032
- Table 36: Argentina Republic of Congo Renewable Energy Market Revenue (Million) Forecast, by Application 2019 & 2032
- Table 37: Peru Republic of Congo Renewable Energy Market Revenue (Million) Forecast, by Application 2019 & 2032
- Table 38: Chile Republic of Congo Renewable Energy Market Revenue (Million) Forecast, by Application 2019 & 2032
- Table 39: Colombia Republic of Congo Renewable Energy Market Revenue (Million) Forecast, by Application 2019 & 2032
- Table 40: Ecuador Republic of Congo Renewable Energy Market Revenue (Million) Forecast, by Application 2019 & 2032
- Table 41: Venezuela Republic of Congo Renewable Energy Market Revenue (Million) Forecast, by Application 2019 & 2032
- Table 42: Rest of South America Republic of Congo Renewable Energy Market Revenue (Million) Forecast, by Application 2019 & 2032
- Table 43: Global Republic of Congo Renewable Energy Market Revenue Million Forecast, by Country 2019 & 2032
- Table 44: UAE Republic of Congo Renewable Energy Market Revenue (Million) Forecast, by Application 2019 & 2032
- Table 45: South Africa Republic of Congo Renewable Energy Market Revenue (Million) Forecast, by Application 2019 & 2032
- Table 46: Saudi Arabia Republic of Congo Renewable Energy Market Revenue (Million) Forecast, by Application 2019 & 2032
- Table 47: Rest of MEA Republic of Congo Renewable Energy Market Revenue (Million) Forecast, by Application 2019 & 2032
- Table 48: Global Republic of Congo Renewable Energy Market Revenue Million Forecast, by Solar 2019 & 2032
- Table 49: Global Republic of Congo Renewable Energy Market Revenue Million Forecast, by Hydro 2019 & 2032
- Table 50: Global Republic of Congo Renewable Energy Market Revenue Million Forecast, by Others 2019 & 2032
- Table 51: Global Republic of Congo Renewable Energy Market Revenue Million Forecast, by Country 2019 & 2032
- Table 52: United States Republic of Congo Renewable Energy Market Revenue (Million) Forecast, by Application 2019 & 2032
- Table 53: Canada Republic of Congo Renewable Energy Market Revenue (Million) Forecast, by Application 2019 & 2032
- Table 54: Mexico Republic of Congo Renewable Energy Market Revenue (Million) Forecast, by Application 2019 & 2032
- Table 55: Global Republic of Congo Renewable Energy Market Revenue Million Forecast, by Solar 2019 & 2032
- Table 56: Global Republic of Congo Renewable Energy Market Revenue Million Forecast, by Hydro 2019 & 2032
- Table 57: Global Republic of Congo Renewable Energy Market Revenue Million Forecast, by Others 2019 & 2032
- Table 58: Global Republic of Congo Renewable Energy Market Revenue Million Forecast, by Country 2019 & 2032
- Table 59: Brazil Republic of Congo Renewable Energy Market Revenue (Million) Forecast, by Application 2019 & 2032
- Table 60: Argentina Republic of Congo Renewable Energy Market Revenue (Million) Forecast, by Application 2019 & 2032
- Table 61: Rest of South America Republic of Congo Renewable Energy Market Revenue (Million) Forecast, by Application 2019 & 2032
- Table 62: Global Republic of Congo Renewable Energy Market Revenue Million Forecast, by Solar 2019 & 2032
- Table 63: Global Republic of Congo Renewable Energy Market Revenue Million Forecast, by Hydro 2019 & 2032
- Table 64: Global Republic of Congo Renewable Energy Market Revenue Million Forecast, by Others 2019 & 2032
- Table 65: Global Republic of Congo Renewable Energy Market Revenue Million Forecast, by Country 2019 & 2032
- Table 66: United Kingdom Republic of Congo Renewable Energy Market Revenue (Million) Forecast, by Application 2019 & 2032
- Table 67: Germany Republic of Congo Renewable Energy Market Revenue (Million) Forecast, by Application 2019 & 2032
- Table 68: France Republic of Congo Renewable Energy Market Revenue (Million) Forecast, by Application 2019 & 2032
- Table 69: Italy Republic of Congo Renewable Energy Market Revenue (Million) Forecast, by Application 2019 & 2032
- Table 70: Spain Republic of Congo Renewable Energy Market Revenue (Million) Forecast, by Application 2019 & 2032
- Table 71: Russia Republic of Congo Renewable Energy Market Revenue (Million) Forecast, by Application 2019 & 2032
- Table 72: Benelux Republic of Congo Renewable Energy Market Revenue (Million) Forecast, by Application 2019 & 2032
- Table 73: Nordics Republic of Congo Renewable Energy Market Revenue (Million) Forecast, by Application 2019 & 2032
- Table 74: Rest of Europe Republic of Congo Renewable Energy Market Revenue (Million) Forecast, by Application 2019 & 2032
- Table 75: Global Republic of Congo Renewable Energy Market Revenue Million Forecast, by Solar 2019 & 2032
- Table 76: Global Republic of Congo Renewable Energy Market Revenue Million Forecast, by Hydro 2019 & 2032
- Table 77: Global Republic of Congo Renewable Energy Market Revenue Million Forecast, by Others 2019 & 2032
- Table 78: Global Republic of Congo Renewable Energy Market Revenue Million Forecast, by Country 2019 & 2032
- Table 79: Turkey Republic of Congo Renewable Energy Market Revenue (Million) Forecast, by Application 2019 & 2032
- Table 80: Israel Republic of Congo Renewable Energy Market Revenue (Million) Forecast, by Application 2019 & 2032
- Table 81: GCC Republic of Congo Renewable Energy Market Revenue (Million) Forecast, by Application 2019 & 2032
- Table 82: North Africa Republic of Congo Renewable Energy Market Revenue (Million) Forecast, by Application 2019 & 2032
- Table 83: South Africa Republic of Congo Renewable Energy Market Revenue (Million) Forecast, by Application 2019 & 2032
- Table 84: Rest of Middle East & Africa Republic of Congo Renewable Energy Market Revenue (Million) Forecast, by Application 2019 & 2032
- Table 85: Global Republic of Congo Renewable Energy Market Revenue Million Forecast, by Solar 2019 & 2032
- Table 86: Global Republic of Congo Renewable Energy Market Revenue Million Forecast, by Hydro 2019 & 2032
- Table 87: Global Republic of Congo Renewable Energy Market Revenue Million Forecast, by Others 2019 & 2032
- Table 88: Global Republic of Congo Renewable Energy Market Revenue Million Forecast, by Country 2019 & 2032
- Table 89: China Republic of Congo Renewable Energy Market Revenue (Million) Forecast, by Application 2019 & 2032
- Table 90: India Republic of Congo Renewable Energy Market Revenue (Million) Forecast, by Application 2019 & 2032
- Table 91: Japan Republic of Congo Renewable Energy Market Revenue (Million) Forecast, by Application 2019 & 2032
- Table 92: South Korea Republic of Congo Renewable Energy Market Revenue (Million) Forecast, by Application 2019 & 2032
- Table 93: ASEAN Republic of Congo Renewable Energy Market Revenue (Million) Forecast, by Application 2019 & 2032
- Table 94: Oceania Republic of Congo Renewable Energy Market Revenue (Million) Forecast, by Application 2019 & 2032
- Table 95: Rest of Asia Pacific Republic of Congo Renewable Energy Market Revenue (Million) Forecast, by Application 2019 & 2032
Frequently Asked Questions
1. What is the projected Compound Annual Growth Rate (CAGR) of the Republic of Congo Renewable Energy Market?
The projected CAGR is approximately > 0.50%.
2. Which companies are prominent players in the Republic of Congo Renewable Energy Market?
Key companies in the market include China Gezhouba Group Company Limited*List Not Exhaustive, Andritiz Group, Energie Electrique Du Congo.
3. What are the main segments of the Republic of Congo Renewable Energy Market?
The market segments include Solar, Hydro, Others.
4. Can you provide details about the market size?
The market size is estimated to be USD XX Million as of 2022.
5. What are some drivers contributing to market growth?
4.; The Increasing Demand from the EV4.; Growing Renewable Energy Market.
6. What are the notable trends driving market growth?
Hydropower likely to Dominate.
7. Are there any restraints impacting market growth?
4.; Demand-Supply Mismatch for Raw Materials.
8. Can you provide examples of recent developments in the market?
In May 2021, China Gezhouba Group recieved the contract to build the 600 MW Chollet Hydroelectric Dam on the Dja river. This energy infrastructure project is likely to cost between XAF 354 to XAF 670 billion depending on the development option implemented by the builder.
9. What pricing options are available for accessing the report?
Pricing options include single-user, multi-user, and enterprise licenses priced at USD 3800, USD 4500, and USD 5800 respectively.
10. Is the market size provided in terms of value or volume?
The market size is provided in terms of value, measured in Million.
11. Are there any specific market keywords associated with the report?
Yes, the market keyword associated with the report is "Republic of Congo Renewable Energy Market," which aids in identifying and referencing the specific market segment covered.
12. How do I determine which pricing option suits my needs best?
The pricing options vary based on user requirements and access needs. Individual users may opt for single-user licenses, while businesses requiring broader access may choose multi-user or enterprise licenses for cost-effective access to the report.
13. Are there any additional resources or data provided in the Republic of Congo Renewable Energy Market report?
While the report offers comprehensive insights, it's advisable to review the specific contents or supplementary materials provided to ascertain if additional resources or data are available.
14. How can I stay updated on further developments or reports in the Republic of Congo Renewable Energy Market?
To stay informed about further developments, trends, and reports in the Republic of Congo Renewable Energy Market, consider subscribing to industry newsletters, following relevant companies and organizations, or regularly checking reputable industry news sources and publications.
Methodology
Step 1 - Identification of Relevant Samples Size from Population Database


Step 2 - Approaches for Defining Global Market Size (Value, Volume* & Price*)

Note*: In applicable scenarios
Step 3 - Data Sources
Primary Research
- Web Analytics
- Survey Reports
- Research Institute
- Latest Research Reports
- Opinion Leaders
Secondary Research
- Annual Reports
- White Paper
- Latest Press Release
- Industry Association
- Paid Database
- Investor Presentations

Step 4 - Data Triangulation
Involves using different sources of information in order to increase the validity of a study
These sources are likely to be stakeholders in a program - participants, other researchers, program staff, other community members, and so on.
Then we put all data in single framework & apply various statistical tools to find out the dynamic on the market.
During the analysis stage, feedback from the stakeholder groups would be compared to determine areas of agreement as well as areas of divergence


