
Key Insights
The global research antibodies market, valued at approximately $XX million in 2025, is projected to experience robust growth, exhibiting a compound annual growth rate (CAGR) of 5.50% from 2025 to 2033. This expansion is fueled by several key factors. The escalating demand for advanced research tools in life sciences, particularly within the burgeoning fields of immunology, oncology, and infectious disease research, is a primary driver. Technological advancements leading to the development of more specific and sensitive antibodies, coupled with increased automation in antibody production, further contribute to market growth. The rising prevalence of chronic diseases globally necessitates extensive research and development efforts, creating a significant demand for research antibodies. Furthermore, the growing adoption of personalized medicine and increasing investments in research and development by pharmaceutical and biotechnology companies are bolstering market expansion. Monoclonal antibodies currently dominate the market, followed by polyclonal antibodies, reflecting the superior specificity and reproducibility offered by monoclonal technologies. The market is also segmented by source animal (rabbit, mouse, goat being the most prevalent) and product type (primary and secondary antibodies). Geographic distribution sees North America and Europe maintaining significant market shares, although the Asia-Pacific region is anticipated to witness substantial growth, driven by expanding research infrastructure and increasing government funding in emerging economies like India and China.
Despite the positive growth outlook, the market faces certain challenges. High production costs associated with antibody development and purification, stringent regulatory requirements, and potential variability in antibody quality can act as restraints. However, continuous innovation in antibody engineering and manufacturing technologies, coupled with the ever-increasing demand for research antibodies, are likely to mitigate these challenges and sustain the market’s impressive growth trajectory throughout the forecast period. The competitive landscape is characterized by the presence of established players like Thermo Fisher Scientific, Merck KGaA, and Bio-Rad Laboratories, alongside a growing number of smaller, specialized companies offering niche antibody products and services. This competitive intensity fosters continuous innovation and price competitiveness, benefiting researchers and accelerating advancements in various scientific domains.
Research Antibodies Industry: A Comprehensive Market Report (2019-2033)
This in-depth report provides a comprehensive analysis of the Research Antibodies industry, offering invaluable insights for industry professionals, investors, and strategic decision-makers. The report covers the period from 2019 to 2033, with a focus on the 2025-2033 forecast period. The global market size in 2025 is estimated at xx Million, showcasing significant growth potential.
Research Antibodies Industry Market Structure & Innovation Trends
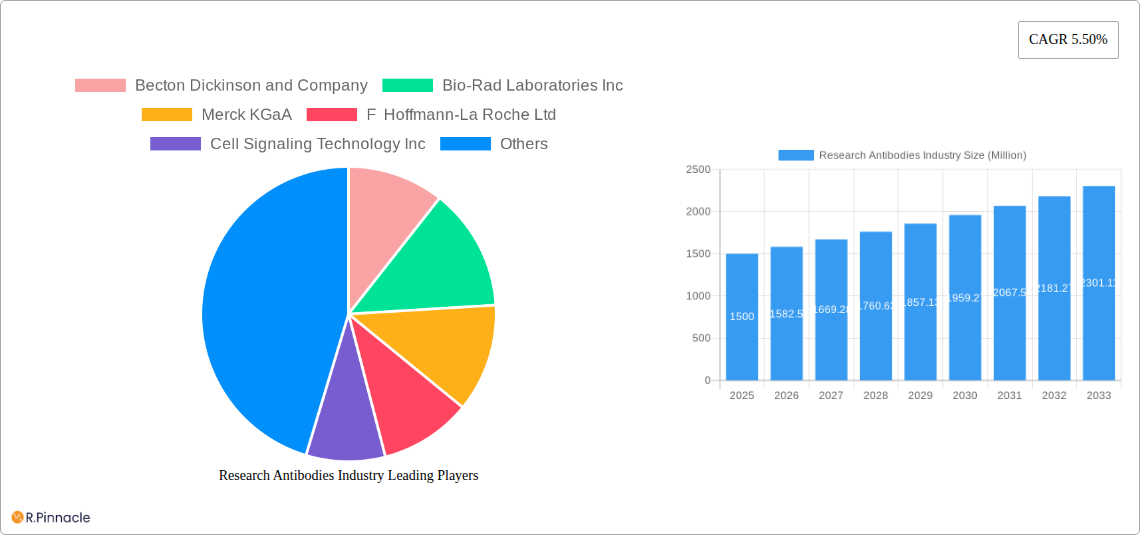
The Research Antibodies market is moderately concentrated, with key players holding significant market share. Becton Dickinson and Company, Bio-Rad Laboratories Inc, Merck KGaA, F Hoffmann-La Roche Ltd, Cell Signaling Technology Inc, Abcam plc, Agilent Technologies, PerkinElmer Inc, Lonza, and Thermo Fisher Scientific are some of the leading companies, though the market also includes numerous smaller players. Market share data for 2025 suggests that the top 5 companies hold approximately xx% of the market collectively. Innovation is driven by advancements in antibody engineering, automation in manufacturing processes, and increasing demand for highly specific and sensitive antibodies. Regulatory frameworks, including those governing the manufacturing and approval of therapeutic antibodies, play a significant role. Substitutes, such as other diagnostic techniques, present competitive pressure. M&A activity is significant, with several major acquisitions and partnerships shaping market dynamics in recent years; total M&A deal value in the past five years is estimated at xx Million. The end-user demographic is primarily comprised of research institutions, pharmaceutical companies, and biotechnology firms.
- Market Concentration: Moderately concentrated, with top 5 players holding approximately xx% market share (2025).
- Innovation Drivers: Advanced antibody engineering, automation, demand for high specificity.
- Regulatory Landscape: Stringent regulations governing manufacturing and approval.
- M&A Activity: Significant activity in recent years, with an estimated xx Million in deal value (past 5 years).
Research Antibodies Industry Market Dynamics & Trends
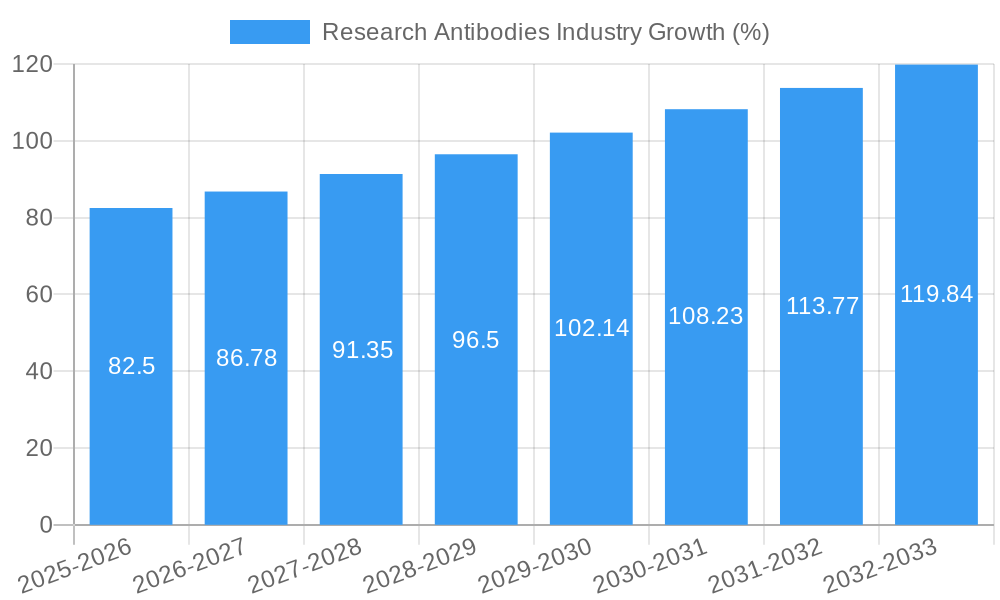
The Research Antibodies market is projected to experience robust growth, with a Compound Annual Growth Rate (CAGR) of xx% during the forecast period (2025-2033). This growth is fueled by several key factors including the rising prevalence of chronic diseases driving demand for diagnostics and therapeutics, increasing R&D investments in the biopharmaceutical sector, the rising adoption of personalized medicine, and advancements in various research fields, notably in oncology and immunology. Technological disruptions, such as the development of next-generation sequencing technologies and CRISPR-Cas9 gene editing, are creating new opportunities. Consumer preferences are increasingly focused on high-quality, validated antibodies with improved sensitivity and specificity. Competitive dynamics are characterized by intense innovation, strategic alliances, and expansion into new markets. Market penetration of novel antibody formats is steadily increasing, with a projected xx% increase in the use of next-generation antibodies by 2033.
Dominant Regions & Segments in Research Antibodies Industry
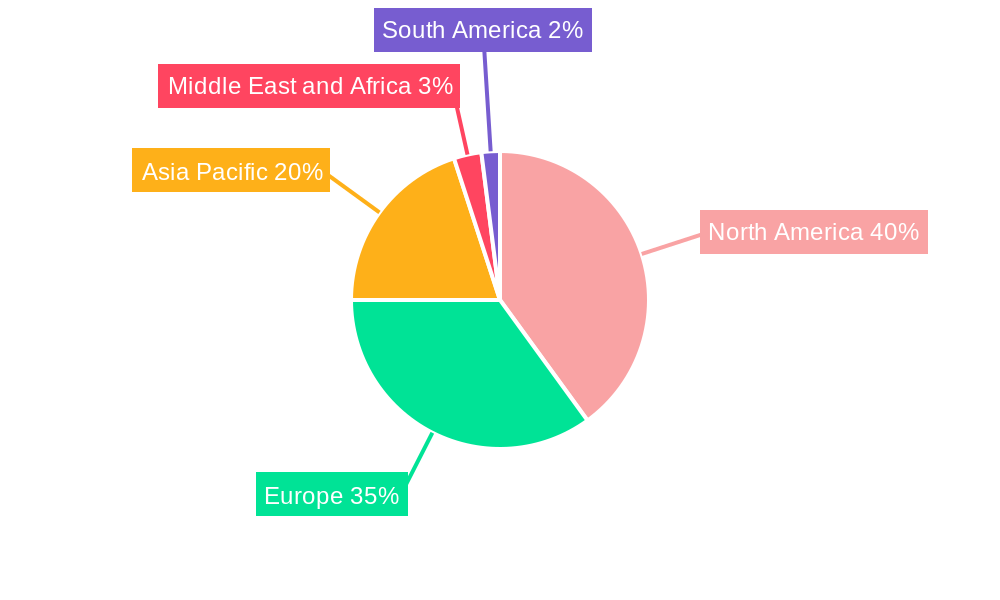
North America currently holds the dominant position in the Research Antibodies market, fueled by robust R&D investment and a large number of research institutions. Europe and Asia Pacific are also key markets, with significant growth potential.
Dominant Segments:
- By Type: Monoclonal Antibodies represent the largest segment, driven by their high specificity and reproducibility.
- By Source: Mouse antibodies are the most commonly used, due to historical prevalence and established production methods.
- By Product: Primary antibodies constitute the larger segment.
- By Application: Oncology and Immunology are major application areas, driven by their high prevalence and significant R&D funding.
Key Drivers of Regional Dominance:
- North America: High R&D expenditure, large number of research institutions and pharmaceutical companies.
- Europe: Strong regulatory frameworks and supportive government initiatives.
- Asia Pacific: Rapid economic growth, growing healthcare sector, and increasing investments in research.
Research Antibodies Industry Product Innovations
Recent innovations include the development of novel antibody formats, such as bispecific antibodies and antibody-drug conjugates (ADCs), offering enhanced therapeutic efficacy. Improvements in antibody engineering techniques, coupled with advanced manufacturing processes, are leading to greater accessibility and affordability. The market is also witnessing the emergence of novel antibody discovery platforms, leveraging AI and machine learning to accelerate the development process. These innovations cater to increasing demands for improved specificity, sensitivity, and therapeutic potential, driving market expansion.
Report Scope & Segmentation Analysis
This report provides a detailed analysis of the Research Antibodies market, segmented by type (Monoclonal Antibodies, Polyclonal Antibodies), source (Rabbit, Mouse, Goat, Others), product (Primary, Secondary), and application (Immunology, Infectious Diseases, Stem Cells, Oncology, Others). Each segment's growth projections, market sizes, and competitive landscapes are thoroughly examined. For example, the monoclonal antibody segment is expected to dominate due to its high specificity, while the oncology application segment is projected to show the fastest growth due to the rising incidence of cancer.
Key Drivers of Research Antibodies Industry Growth
The Research Antibodies market is propelled by several factors: the increasing prevalence of chronic diseases necessitates advanced diagnostic and therapeutic tools; substantial R&D investments in the biopharmaceutical sector fuel the demand for high-quality antibodies; the burgeoning field of personalized medicine requires antibodies with high specificity and sensitivity; and advances in research methodologies, like high-throughput screening, necessitate a wide array of antibodies.
Challenges in the Research Antibodies Industry Sector
The industry faces challenges including stringent regulatory approvals, potentially leading to delays in product launches and increased costs. Supply chain disruptions can impact availability and pricing. Furthermore, intense competition necessitates continuous innovation and cost-effective manufacturing processes. These factors collectively limit market expansion. The overall impact of these challenges is estimated to reduce the market growth rate by approximately xx% during the forecast period.
Emerging Opportunities in Research Antibodies Industry
Emerging opportunities include the development of novel antibody-based therapeutics for emerging infectious diseases and the integration of AI and machine learning in antibody discovery and development. Expanding into new geographic markets, particularly in developing countries, also presents substantial growth potential. The rise of personalized medicine presents a significant opportunity for highly specific antibodies tailored to individual patient needs.
Leading Players in the Research Antibodies Industry Market
- Becton Dickinson and Company
- Bio-Rad Laboratories Inc
- Merck KGaA
- F Hoffmann-La Roche Ltd
- Cell Signaling Technology Inc
- Abcam plc
- Agilent Technologies
- PerkinElmer Inc
- Lonza
- Thermo Fisher Scientific
Key Developments in Research Antibodies Industry
- 2022 Q4: Company X launched a novel bispecific antibody for the treatment of cancer.
- 2023 Q1: Company Y announced a strategic partnership to expand its antibody manufacturing capabilities.
- 2023 Q3: Regulatory approval granted for a new monoclonal antibody therapy. (Further details would be included in the full report.)
Future Outlook for Research Antibodies Industry Market
The Research Antibodies market is poised for continued growth, driven by increasing demand for advanced diagnostic and therapeutic tools. Strategic partnerships, investments in R&D, and expansion into emerging markets will shape future market dynamics. The focus on personalized medicine and the development of innovative antibody formats will further enhance market growth, creating significant opportunities for industry players.
Research Antibodies Industry Segmentation
-
1. Type
- 1.1. Monoclonal Antibodies
- 1.2. Polyclonal Antibodies
-
2. Source
- 2.1. Rabbit
- 2.2. Mouse
- 2.3. Goat
- 2.4. Others
-
3. Product
- 3.1. Primary
- 3.2. Secondary
-
4. Application
- 4.1. Immunology
- 4.2. Infectious Diseases
- 4.3. Stem Cells
- 4.4. Oncology
- 4.5. Others
Research Antibodies Industry Segmentation By Geography
-
1. North America
- 1.1. United States
- 1.2. Canada
- 1.3. Mexico
-
2. Europe
- 2.1. Germany
- 2.2. United Kingdom
- 2.3. France
- 2.4. Italy
- 2.5. Spain
- 2.6. Rest of Europe
-
3. Asia Pacific
- 3.1. China
- 3.2. Japan
- 3.3. India
- 3.4. Australia
- 3.5. South Korea
- 3.6. Rest of Asia Pacific
-
4. Middle East and Africa
- 4.1. GCC
- 4.2. South Africa
- 4.3. Rest of Middle East and Africa
-
5. South America
- 5.1. Brazil
- 5.2. Argentina
- 5.3. Rest of South America
Research Antibodies Industry REPORT HIGHLIGHTS
| Aspects | Details |
|---|---|
| Study Period | 2019-2033 |
| Base Year | 2024 |
| Estimated Year | 2025 |
| Forecast Period | 2025-2033 |
| Historical Period | 2019-2024 |
| Growth Rate | CAGR of 5.50% from 2019-2033 |
| Segmentation |
|
Table of Contents
- 1. Introduction
- 1.1. Research Scope
- 1.2. Market Segmentation
- 1.3. Research Methodology
- 1.4. Definitions and Assumptions
- 2. Executive Summary
- 2.1. Introduction
- 3. Market Dynamics
- 3.1. Introduction
- 3.2. Market Drivers
- 3.2.1. ; Increasing Investment In R&D; Increase In Research Academies And Industry Collaborations; Rise In Proteomics And Genomics Research
- 3.3. Market Restrains
- 3.3.1. ; High Cost Of Research Antibodies
- 3.4. Market Trends
- 3.4.1. Primary Antibodies in Research Antibodies is Estimated to Witness a Healthy Growth in Future.
- 4. Market Factor Analysis
- 4.1. Porters Five Forces
- 4.2. Supply/Value Chain
- 4.3. PESTEL analysis
- 4.4. Market Entropy
- 4.5. Patent/Trademark Analysis
- 5. Global Research Antibodies Industry Analysis, Insights and Forecast, 2019-2031
- 5.1. Market Analysis, Insights and Forecast - by Type
- 5.1.1. Monoclonal Antibodies
- 5.1.2. Polyclonal Antibodies
- 5.2. Market Analysis, Insights and Forecast - by Source
- 5.2.1. Rabbit
- 5.2.2. Mouse
- 5.2.3. Goat
- 5.2.4. Others
- 5.3. Market Analysis, Insights and Forecast - by Product
- 5.3.1. Primary
- 5.3.2. Secondary
- 5.4. Market Analysis, Insights and Forecast - by Application
- 5.4.1. Immunology
- 5.4.2. Infectious Diseases
- 5.4.3. Stem Cells
- 5.4.4. Oncology
- 5.4.5. Others
- 5.5. Market Analysis, Insights and Forecast - by Region
- 5.5.1. North America
- 5.5.2. Europe
- 5.5.3. Asia Pacific
- 5.5.4. Middle East and Africa
- 5.5.5. South America
- 5.1. Market Analysis, Insights and Forecast - by Type
- 6. North America Research Antibodies Industry Analysis, Insights and Forecast, 2019-2031
- 6.1. Market Analysis, Insights and Forecast - by Type
- 6.1.1. Monoclonal Antibodies
- 6.1.2. Polyclonal Antibodies
- 6.2. Market Analysis, Insights and Forecast - by Source
- 6.2.1. Rabbit
- 6.2.2. Mouse
- 6.2.3. Goat
- 6.2.4. Others
- 6.3. Market Analysis, Insights and Forecast - by Product
- 6.3.1. Primary
- 6.3.2. Secondary
- 6.4. Market Analysis, Insights and Forecast - by Application
- 6.4.1. Immunology
- 6.4.2. Infectious Diseases
- 6.4.3. Stem Cells
- 6.4.4. Oncology
- 6.4.5. Others
- 6.1. Market Analysis, Insights and Forecast - by Type
- 7. Europe Research Antibodies Industry Analysis, Insights and Forecast, 2019-2031
- 7.1. Market Analysis, Insights and Forecast - by Type
- 7.1.1. Monoclonal Antibodies
- 7.1.2. Polyclonal Antibodies
- 7.2. Market Analysis, Insights and Forecast - by Source
- 7.2.1. Rabbit
- 7.2.2. Mouse
- 7.2.3. Goat
- 7.2.4. Others
- 7.3. Market Analysis, Insights and Forecast - by Product
- 7.3.1. Primary
- 7.3.2. Secondary
- 7.4. Market Analysis, Insights and Forecast - by Application
- 7.4.1. Immunology
- 7.4.2. Infectious Diseases
- 7.4.3. Stem Cells
- 7.4.4. Oncology
- 7.4.5. Others
- 7.1. Market Analysis, Insights and Forecast - by Type
- 8. Asia Pacific Research Antibodies Industry Analysis, Insights and Forecast, 2019-2031
- 8.1. Market Analysis, Insights and Forecast - by Type
- 8.1.1. Monoclonal Antibodies
- 8.1.2. Polyclonal Antibodies
- 8.2. Market Analysis, Insights and Forecast - by Source
- 8.2.1. Rabbit
- 8.2.2. Mouse
- 8.2.3. Goat
- 8.2.4. Others
- 8.3. Market Analysis, Insights and Forecast - by Product
- 8.3.1. Primary
- 8.3.2. Secondary
- 8.4. Market Analysis, Insights and Forecast - by Application
- 8.4.1. Immunology
- 8.4.2. Infectious Diseases
- 8.4.3. Stem Cells
- 8.4.4. Oncology
- 8.4.5. Others
- 8.1. Market Analysis, Insights and Forecast - by Type
- 9. Middle East and Africa Research Antibodies Industry Analysis, Insights and Forecast, 2019-2031
- 9.1. Market Analysis, Insights and Forecast - by Type
- 9.1.1. Monoclonal Antibodies
- 9.1.2. Polyclonal Antibodies
- 9.2. Market Analysis, Insights and Forecast - by Source
- 9.2.1. Rabbit
- 9.2.2. Mouse
- 9.2.3. Goat
- 9.2.4. Others
- 9.3. Market Analysis, Insights and Forecast - by Product
- 9.3.1. Primary
- 9.3.2. Secondary
- 9.4. Market Analysis, Insights and Forecast - by Application
- 9.4.1. Immunology
- 9.4.2. Infectious Diseases
- 9.4.3. Stem Cells
- 9.4.4. Oncology
- 9.4.5. Others
- 9.1. Market Analysis, Insights and Forecast - by Type
- 10. South America Research Antibodies Industry Analysis, Insights and Forecast, 2019-2031
- 10.1. Market Analysis, Insights and Forecast - by Type
- 10.1.1. Monoclonal Antibodies
- 10.1.2. Polyclonal Antibodies
- 10.2. Market Analysis, Insights and Forecast - by Source
- 10.2.1. Rabbit
- 10.2.2. Mouse
- 10.2.3. Goat
- 10.2.4. Others
- 10.3. Market Analysis, Insights and Forecast - by Product
- 10.3.1. Primary
- 10.3.2. Secondary
- 10.4. Market Analysis, Insights and Forecast - by Application
- 10.4.1. Immunology
- 10.4.2. Infectious Diseases
- 10.4.3. Stem Cells
- 10.4.4. Oncology
- 10.4.5. Others
- 10.1. Market Analysis, Insights and Forecast - by Type
- 11. North America Research Antibodies Industry Analysis, Insights and Forecast, 2019-2031
- 11.1. Market Analysis, Insights and Forecast - By Country/Sub-region
- 11.1.1 United States
- 11.1.2 Canada
- 11.1.3 Mexico
- 12. Europe Research Antibodies Industry Analysis, Insights and Forecast, 2019-2031
- 12.1. Market Analysis, Insights and Forecast - By Country/Sub-region
- 12.1.1 Germany
- 12.1.2 United Kingdom
- 12.1.3 France
- 12.1.4 Italy
- 12.1.5 Spain
- 12.1.6 Rest of Europe
- 13. Asia Pacific Research Antibodies Industry Analysis, Insights and Forecast, 2019-2031
- 13.1. Market Analysis, Insights and Forecast - By Country/Sub-region
- 13.1.1 China
- 13.1.2 Japan
- 13.1.3 India
- 13.1.4 Australia
- 13.1.5 South Korea
- 13.1.6 Rest of Asia Pacific
- 14. Middle East and Africa Research Antibodies Industry Analysis, Insights and Forecast, 2019-2031
- 14.1. Market Analysis, Insights and Forecast - By Country/Sub-region
- 14.1.1 GCC
- 14.1.2 South Africa
- 14.1.3 Rest of Middle East and Africa
- 15. South America Research Antibodies Industry Analysis, Insights and Forecast, 2019-2031
- 15.1. Market Analysis, Insights and Forecast - By Country/Sub-region
- 15.1.1 Brazil
- 15.1.2 Argentina
- 15.1.3 Rest of South America
- 16. Competitive Analysis
- 16.1. Global Market Share Analysis 2024
- 16.2. Company Profiles
- 16.2.1 Becton Dickinson and Company
- 16.2.1.1. Overview
- 16.2.1.2. Products
- 16.2.1.3. SWOT Analysis
- 16.2.1.4. Recent Developments
- 16.2.1.5. Financials (Based on Availability)
- 16.2.2 Bio-Rad Laboratories Inc
- 16.2.2.1. Overview
- 16.2.2.2. Products
- 16.2.2.3. SWOT Analysis
- 16.2.2.4. Recent Developments
- 16.2.2.5. Financials (Based on Availability)
- 16.2.3 Merck KGaA
- 16.2.3.1. Overview
- 16.2.3.2. Products
- 16.2.3.3. SWOT Analysis
- 16.2.3.4. Recent Developments
- 16.2.3.5. Financials (Based on Availability)
- 16.2.4 F Hoffmann-La Roche Ltd
- 16.2.4.1. Overview
- 16.2.4.2. Products
- 16.2.4.3. SWOT Analysis
- 16.2.4.4. Recent Developments
- 16.2.4.5. Financials (Based on Availability)
- 16.2.5 Cell Signaling Technology Inc
- 16.2.5.1. Overview
- 16.2.5.2. Products
- 16.2.5.3. SWOT Analysis
- 16.2.5.4. Recent Developments
- 16.2.5.5. Financials (Based on Availability)
- 16.2.6 Abcam plc
- 16.2.6.1. Overview
- 16.2.6.2. Products
- 16.2.6.3. SWOT Analysis
- 16.2.6.4. Recent Developments
- 16.2.6.5. Financials (Based on Availability)
- 16.2.7 Agilent Technologies*List Not Exhaustive
- 16.2.7.1. Overview
- 16.2.7.2. Products
- 16.2.7.3. SWOT Analysis
- 16.2.7.4. Recent Developments
- 16.2.7.5. Financials (Based on Availability)
- 16.2.8 PerkinElmer Inc
- 16.2.8.1. Overview
- 16.2.8.2. Products
- 16.2.8.3. SWOT Analysis
- 16.2.8.4. Recent Developments
- 16.2.8.5. Financials (Based on Availability)
- 16.2.9 Lonza
- 16.2.9.1. Overview
- 16.2.9.2. Products
- 16.2.9.3. SWOT Analysis
- 16.2.9.4. Recent Developments
- 16.2.9.5. Financials (Based on Availability)
- 16.2.10 Thermo Fisher Scientific
- 16.2.10.1. Overview
- 16.2.10.2. Products
- 16.2.10.3. SWOT Analysis
- 16.2.10.4. Recent Developments
- 16.2.10.5. Financials (Based on Availability)
- 16.2.1 Becton Dickinson and Company
List of Figures
- Figure 1: Global Research Antibodies Industry Revenue Breakdown (Million, %) by Region 2024 & 2032
- Figure 2: North America Research Antibodies Industry Revenue (Million), by Country 2024 & 2032
- Figure 3: North America Research Antibodies Industry Revenue Share (%), by Country 2024 & 2032
- Figure 4: Europe Research Antibodies Industry Revenue (Million), by Country 2024 & 2032
- Figure 5: Europe Research Antibodies Industry Revenue Share (%), by Country 2024 & 2032
- Figure 6: Asia Pacific Research Antibodies Industry Revenue (Million), by Country 2024 & 2032
- Figure 7: Asia Pacific Research Antibodies Industry Revenue Share (%), by Country 2024 & 2032
- Figure 8: Middle East and Africa Research Antibodies Industry Revenue (Million), by Country 2024 & 2032
- Figure 9: Middle East and Africa Research Antibodies Industry Revenue Share (%), by Country 2024 & 2032
- Figure 10: South America Research Antibodies Industry Revenue (Million), by Country 2024 & 2032
- Figure 11: South America Research Antibodies Industry Revenue Share (%), by Country 2024 & 2032
- Figure 12: North America Research Antibodies Industry Revenue (Million), by Type 2024 & 2032
- Figure 13: North America Research Antibodies Industry Revenue Share (%), by Type 2024 & 2032
- Figure 14: North America Research Antibodies Industry Revenue (Million), by Source 2024 & 2032
- Figure 15: North America Research Antibodies Industry Revenue Share (%), by Source 2024 & 2032
- Figure 16: North America Research Antibodies Industry Revenue (Million), by Product 2024 & 2032
- Figure 17: North America Research Antibodies Industry Revenue Share (%), by Product 2024 & 2032
- Figure 18: North America Research Antibodies Industry Revenue (Million), by Application 2024 & 2032
- Figure 19: North America Research Antibodies Industry Revenue Share (%), by Application 2024 & 2032
- Figure 20: North America Research Antibodies Industry Revenue (Million), by Country 2024 & 2032
- Figure 21: North America Research Antibodies Industry Revenue Share (%), by Country 2024 & 2032
- Figure 22: Europe Research Antibodies Industry Revenue (Million), by Type 2024 & 2032
- Figure 23: Europe Research Antibodies Industry Revenue Share (%), by Type 2024 & 2032
- Figure 24: Europe Research Antibodies Industry Revenue (Million), by Source 2024 & 2032
- Figure 25: Europe Research Antibodies Industry Revenue Share (%), by Source 2024 & 2032
- Figure 26: Europe Research Antibodies Industry Revenue (Million), by Product 2024 & 2032
- Figure 27: Europe Research Antibodies Industry Revenue Share (%), by Product 2024 & 2032
- Figure 28: Europe Research Antibodies Industry Revenue (Million), by Application 2024 & 2032
- Figure 29: Europe Research Antibodies Industry Revenue Share (%), by Application 2024 & 2032
- Figure 30: Europe Research Antibodies Industry Revenue (Million), by Country 2024 & 2032
- Figure 31: Europe Research Antibodies Industry Revenue Share (%), by Country 2024 & 2032
- Figure 32: Asia Pacific Research Antibodies Industry Revenue (Million), by Type 2024 & 2032
- Figure 33: Asia Pacific Research Antibodies Industry Revenue Share (%), by Type 2024 & 2032
- Figure 34: Asia Pacific Research Antibodies Industry Revenue (Million), by Source 2024 & 2032
- Figure 35: Asia Pacific Research Antibodies Industry Revenue Share (%), by Source 2024 & 2032
- Figure 36: Asia Pacific Research Antibodies Industry Revenue (Million), by Product 2024 & 2032
- Figure 37: Asia Pacific Research Antibodies Industry Revenue Share (%), by Product 2024 & 2032
- Figure 38: Asia Pacific Research Antibodies Industry Revenue (Million), by Application 2024 & 2032
- Figure 39: Asia Pacific Research Antibodies Industry Revenue Share (%), by Application 2024 & 2032
- Figure 40: Asia Pacific Research Antibodies Industry Revenue (Million), by Country 2024 & 2032
- Figure 41: Asia Pacific Research Antibodies Industry Revenue Share (%), by Country 2024 & 2032
- Figure 42: Middle East and Africa Research Antibodies Industry Revenue (Million), by Type 2024 & 2032
- Figure 43: Middle East and Africa Research Antibodies Industry Revenue Share (%), by Type 2024 & 2032
- Figure 44: Middle East and Africa Research Antibodies Industry Revenue (Million), by Source 2024 & 2032
- Figure 45: Middle East and Africa Research Antibodies Industry Revenue Share (%), by Source 2024 & 2032
- Figure 46: Middle East and Africa Research Antibodies Industry Revenue (Million), by Product 2024 & 2032
- Figure 47: Middle East and Africa Research Antibodies Industry Revenue Share (%), by Product 2024 & 2032
- Figure 48: Middle East and Africa Research Antibodies Industry Revenue (Million), by Application 2024 & 2032
- Figure 49: Middle East and Africa Research Antibodies Industry Revenue Share (%), by Application 2024 & 2032
- Figure 50: Middle East and Africa Research Antibodies Industry Revenue (Million), by Country 2024 & 2032
- Figure 51: Middle East and Africa Research Antibodies Industry Revenue Share (%), by Country 2024 & 2032
- Figure 52: South America Research Antibodies Industry Revenue (Million), by Type 2024 & 2032
- Figure 53: South America Research Antibodies Industry Revenue Share (%), by Type 2024 & 2032
- Figure 54: South America Research Antibodies Industry Revenue (Million), by Source 2024 & 2032
- Figure 55: South America Research Antibodies Industry Revenue Share (%), by Source 2024 & 2032
- Figure 56: South America Research Antibodies Industry Revenue (Million), by Product 2024 & 2032
- Figure 57: South America Research Antibodies Industry Revenue Share (%), by Product 2024 & 2032
- Figure 58: South America Research Antibodies Industry Revenue (Million), by Application 2024 & 2032
- Figure 59: South America Research Antibodies Industry Revenue Share (%), by Application 2024 & 2032
- Figure 60: South America Research Antibodies Industry Revenue (Million), by Country 2024 & 2032
- Figure 61: South America Research Antibodies Industry Revenue Share (%), by Country 2024 & 2032
List of Tables
- Table 1: Global Research Antibodies Industry Revenue Million Forecast, by Region 2019 & 2032
- Table 2: Global Research Antibodies Industry Revenue Million Forecast, by Type 2019 & 2032
- Table 3: Global Research Antibodies Industry Revenue Million Forecast, by Source 2019 & 2032
- Table 4: Global Research Antibodies Industry Revenue Million Forecast, by Product 2019 & 2032
- Table 5: Global Research Antibodies Industry Revenue Million Forecast, by Application 2019 & 2032
- Table 6: Global Research Antibodies Industry Revenue Million Forecast, by Region 2019 & 2032
- Table 7: Global Research Antibodies Industry Revenue Million Forecast, by Country 2019 & 2032
- Table 8: United States Research Antibodies Industry Revenue (Million) Forecast, by Application 2019 & 2032
- Table 9: Canada Research Antibodies Industry Revenue (Million) Forecast, by Application 2019 & 2032
- Table 10: Mexico Research Antibodies Industry Revenue (Million) Forecast, by Application 2019 & 2032
- Table 11: Global Research Antibodies Industry Revenue Million Forecast, by Country 2019 & 2032
- Table 12: Germany Research Antibodies Industry Revenue (Million) Forecast, by Application 2019 & 2032
- Table 13: United Kingdom Research Antibodies Industry Revenue (Million) Forecast, by Application 2019 & 2032
- Table 14: France Research Antibodies Industry Revenue (Million) Forecast, by Application 2019 & 2032
- Table 15: Italy Research Antibodies Industry Revenue (Million) Forecast, by Application 2019 & 2032
- Table 16: Spain Research Antibodies Industry Revenue (Million) Forecast, by Application 2019 & 2032
- Table 17: Rest of Europe Research Antibodies Industry Revenue (Million) Forecast, by Application 2019 & 2032
- Table 18: Global Research Antibodies Industry Revenue Million Forecast, by Country 2019 & 2032
- Table 19: China Research Antibodies Industry Revenue (Million) Forecast, by Application 2019 & 2032
- Table 20: Japan Research Antibodies Industry Revenue (Million) Forecast, by Application 2019 & 2032
- Table 21: India Research Antibodies Industry Revenue (Million) Forecast, by Application 2019 & 2032
- Table 22: Australia Research Antibodies Industry Revenue (Million) Forecast, by Application 2019 & 2032
- Table 23: South Korea Research Antibodies Industry Revenue (Million) Forecast, by Application 2019 & 2032
- Table 24: Rest of Asia Pacific Research Antibodies Industry Revenue (Million) Forecast, by Application 2019 & 2032
- Table 25: Global Research Antibodies Industry Revenue Million Forecast, by Country 2019 & 2032
- Table 26: GCC Research Antibodies Industry Revenue (Million) Forecast, by Application 2019 & 2032
- Table 27: South Africa Research Antibodies Industry Revenue (Million) Forecast, by Application 2019 & 2032
- Table 28: Rest of Middle East and Africa Research Antibodies Industry Revenue (Million) Forecast, by Application 2019 & 2032
- Table 29: Global Research Antibodies Industry Revenue Million Forecast, by Country 2019 & 2032
- Table 30: Brazil Research Antibodies Industry Revenue (Million) Forecast, by Application 2019 & 2032
- Table 31: Argentina Research Antibodies Industry Revenue (Million) Forecast, by Application 2019 & 2032
- Table 32: Rest of South America Research Antibodies Industry Revenue (Million) Forecast, by Application 2019 & 2032
- Table 33: Global Research Antibodies Industry Revenue Million Forecast, by Type 2019 & 2032
- Table 34: Global Research Antibodies Industry Revenue Million Forecast, by Source 2019 & 2032
- Table 35: Global Research Antibodies Industry Revenue Million Forecast, by Product 2019 & 2032
- Table 36: Global Research Antibodies Industry Revenue Million Forecast, by Application 2019 & 2032
- Table 37: Global Research Antibodies Industry Revenue Million Forecast, by Country 2019 & 2032
- Table 38: United States Research Antibodies Industry Revenue (Million) Forecast, by Application 2019 & 2032
- Table 39: Canada Research Antibodies Industry Revenue (Million) Forecast, by Application 2019 & 2032
- Table 40: Mexico Research Antibodies Industry Revenue (Million) Forecast, by Application 2019 & 2032
- Table 41: Global Research Antibodies Industry Revenue Million Forecast, by Type 2019 & 2032
- Table 42: Global Research Antibodies Industry Revenue Million Forecast, by Source 2019 & 2032
- Table 43: Global Research Antibodies Industry Revenue Million Forecast, by Product 2019 & 2032
- Table 44: Global Research Antibodies Industry Revenue Million Forecast, by Application 2019 & 2032
- Table 45: Global Research Antibodies Industry Revenue Million Forecast, by Country 2019 & 2032
- Table 46: Germany Research Antibodies Industry Revenue (Million) Forecast, by Application 2019 & 2032
- Table 47: United Kingdom Research Antibodies Industry Revenue (Million) Forecast, by Application 2019 & 2032
- Table 48: France Research Antibodies Industry Revenue (Million) Forecast, by Application 2019 & 2032
- Table 49: Italy Research Antibodies Industry Revenue (Million) Forecast, by Application 2019 & 2032
- Table 50: Spain Research Antibodies Industry Revenue (Million) Forecast, by Application 2019 & 2032
- Table 51: Rest of Europe Research Antibodies Industry Revenue (Million) Forecast, by Application 2019 & 2032
- Table 52: Global Research Antibodies Industry Revenue Million Forecast, by Type 2019 & 2032
- Table 53: Global Research Antibodies Industry Revenue Million Forecast, by Source 2019 & 2032
- Table 54: Global Research Antibodies Industry Revenue Million Forecast, by Product 2019 & 2032
- Table 55: Global Research Antibodies Industry Revenue Million Forecast, by Application 2019 & 2032
- Table 56: Global Research Antibodies Industry Revenue Million Forecast, by Country 2019 & 2032
- Table 57: China Research Antibodies Industry Revenue (Million) Forecast, by Application 2019 & 2032
- Table 58: Japan Research Antibodies Industry Revenue (Million) Forecast, by Application 2019 & 2032
- Table 59: India Research Antibodies Industry Revenue (Million) Forecast, by Application 2019 & 2032
- Table 60: Australia Research Antibodies Industry Revenue (Million) Forecast, by Application 2019 & 2032
- Table 61: South Korea Research Antibodies Industry Revenue (Million) Forecast, by Application 2019 & 2032
- Table 62: Rest of Asia Pacific Research Antibodies Industry Revenue (Million) Forecast, by Application 2019 & 2032
- Table 63: Global Research Antibodies Industry Revenue Million Forecast, by Type 2019 & 2032
- Table 64: Global Research Antibodies Industry Revenue Million Forecast, by Source 2019 & 2032
- Table 65: Global Research Antibodies Industry Revenue Million Forecast, by Product 2019 & 2032
- Table 66: Global Research Antibodies Industry Revenue Million Forecast, by Application 2019 & 2032
- Table 67: Global Research Antibodies Industry Revenue Million Forecast, by Country 2019 & 2032
- Table 68: GCC Research Antibodies Industry Revenue (Million) Forecast, by Application 2019 & 2032
- Table 69: South Africa Research Antibodies Industry Revenue (Million) Forecast, by Application 2019 & 2032
- Table 70: Rest of Middle East and Africa Research Antibodies Industry Revenue (Million) Forecast, by Application 2019 & 2032
- Table 71: Global Research Antibodies Industry Revenue Million Forecast, by Type 2019 & 2032
- Table 72: Global Research Antibodies Industry Revenue Million Forecast, by Source 2019 & 2032
- Table 73: Global Research Antibodies Industry Revenue Million Forecast, by Product 2019 & 2032
- Table 74: Global Research Antibodies Industry Revenue Million Forecast, by Application 2019 & 2032
- Table 75: Global Research Antibodies Industry Revenue Million Forecast, by Country 2019 & 2032
- Table 76: Brazil Research Antibodies Industry Revenue (Million) Forecast, by Application 2019 & 2032
- Table 77: Argentina Research Antibodies Industry Revenue (Million) Forecast, by Application 2019 & 2032
- Table 78: Rest of South America Research Antibodies Industry Revenue (Million) Forecast, by Application 2019 & 2032
Frequently Asked Questions
1. What is the projected Compound Annual Growth Rate (CAGR) of the Research Antibodies Industry?
The projected CAGR is approximately 5.50%.
2. Which companies are prominent players in the Research Antibodies Industry?
Key companies in the market include Becton Dickinson and Company, Bio-Rad Laboratories Inc, Merck KGaA, F Hoffmann-La Roche Ltd, Cell Signaling Technology Inc, Abcam plc, Agilent Technologies*List Not Exhaustive, PerkinElmer Inc, Lonza, Thermo Fisher Scientific.
3. What are the main segments of the Research Antibodies Industry?
The market segments include Type, Source, Product, Application.
4. Can you provide details about the market size?
The market size is estimated to be USD XX Million as of 2022.
5. What are some drivers contributing to market growth?
; Increasing Investment In R&D; Increase In Research Academies And Industry Collaborations; Rise In Proteomics And Genomics Research.
6. What are the notable trends driving market growth?
Primary Antibodies in Research Antibodies is Estimated to Witness a Healthy Growth in Future..
7. Are there any restraints impacting market growth?
; High Cost Of Research Antibodies.
8. Can you provide examples of recent developments in the market?
N/A
9. What pricing options are available for accessing the report?
Pricing options include single-user, multi-user, and enterprise licenses priced at USD 4750, USD 5250, and USD 8750 respectively.
10. Is the market size provided in terms of value or volume?
The market size is provided in terms of value, measured in Million.
11. Are there any specific market keywords associated with the report?
Yes, the market keyword associated with the report is "Research Antibodies Industry," which aids in identifying and referencing the specific market segment covered.
12. How do I determine which pricing option suits my needs best?
The pricing options vary based on user requirements and access needs. Individual users may opt for single-user licenses, while businesses requiring broader access may choose multi-user or enterprise licenses for cost-effective access to the report.
13. Are there any additional resources or data provided in the Research Antibodies Industry report?
While the report offers comprehensive insights, it's advisable to review the specific contents or supplementary materials provided to ascertain if additional resources or data are available.
14. How can I stay updated on further developments or reports in the Research Antibodies Industry?
To stay informed about further developments, trends, and reports in the Research Antibodies Industry, consider subscribing to industry newsletters, following relevant companies and organizations, or regularly checking reputable industry news sources and publications.
Methodology
Step 1 - Identification of Relevant Samples Size from Population Database


Step 2 - Approaches for Defining Global Market Size (Value, Volume* & Price*)

Note*: In applicable scenarios
Step 3 - Data Sources
Primary Research
- Web Analytics
- Survey Reports
- Research Institute
- Latest Research Reports
- Opinion Leaders
Secondary Research
- Annual Reports
- White Paper
- Latest Press Release
- Industry Association
- Paid Database
- Investor Presentations

Step 4 - Data Triangulation
Involves using different sources of information in order to increase the validity of a study
These sources are likely to be stakeholders in a program - participants, other researchers, program staff, other community members, and so on.
Then we put all data in single framework & apply various statistical tools to find out the dynamic on the market.
During the analysis stage, feedback from the stakeholder groups would be compared to determine areas of agreement as well as areas of divergence


