
Key Insights
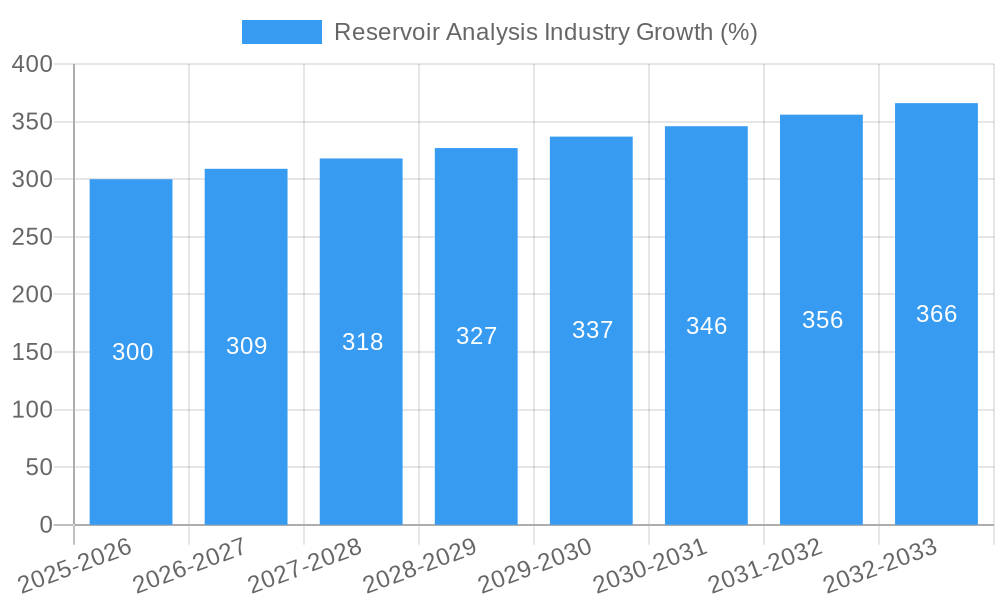
The global reservoir analysis market is experiencing robust growth, driven by the increasing demand for enhanced oil and gas recovery techniques and the exploration of unconventional resources like shale gas and tight oil. The market's compound annual growth rate (CAGR) exceeding 2.00% indicates a steady expansion, projected to continue through 2033. Key drivers include advancements in reservoir simulation software, sophisticated data acquisition and monitoring technologies, and the growing need for precise reservoir characterization to optimize production efficiency and reduce operational costs. The market is segmented by reservoir type (conventional and unconventional), service (geo-modeling, reservoir simulation, data acquisition and monitoring, reservoir sampling, and others), and application (onshore and offshore). The onshore segment currently holds a larger market share due to easier accessibility and lower operational costs compared to offshore operations. However, advancements in offshore drilling technologies and increasing exploration activities in deepwater regions are expected to fuel growth in the offshore segment in the coming years. Major players, including Schlumberger, Halliburton, Baker Hughes, and others, are investing heavily in R&D to develop innovative technologies and expand their service offerings, further intensifying competition and driving market growth. Geographical expansion is also a significant factor; regions like North America and the Asia-Pacific are projected to witness significant growth due to robust oil and gas production activities and substantial investments in exploration and production.
The market faces some restraints, primarily related to the volatility of oil and gas prices and the high capital investment required for advanced reservoir analysis technologies. However, the long-term outlook remains positive, fueled by the persistent demand for energy and the ongoing need to optimize production from existing and newly discovered reserves. The increasing adoption of digital technologies, including artificial intelligence and machine learning, is revolutionizing reservoir analysis, enabling more accurate predictions, optimized field development plans, and reduced uncertainty in production forecasts. This technological transformation, coupled with the ongoing exploration and production activities globally, is expected to maintain the upward trajectory of the reservoir analysis market in the forecast period.
Reservoir Analysis Industry Report: 2019-2033 Forecast
This comprehensive report provides an in-depth analysis of the Reservoir Analysis Industry, offering invaluable insights for industry professionals, investors, and strategic decision-makers. With a focus on market dynamics, technological advancements, and competitive landscapes, this report projects a market value exceeding $XX Million by 2033. The study period spans 2019-2033, with 2025 as the base and estimated year. The forecast period is 2025-2033, and the historical period covers 2019-2024.
Reservoir Analysis Industry Market Structure & Innovation Trends
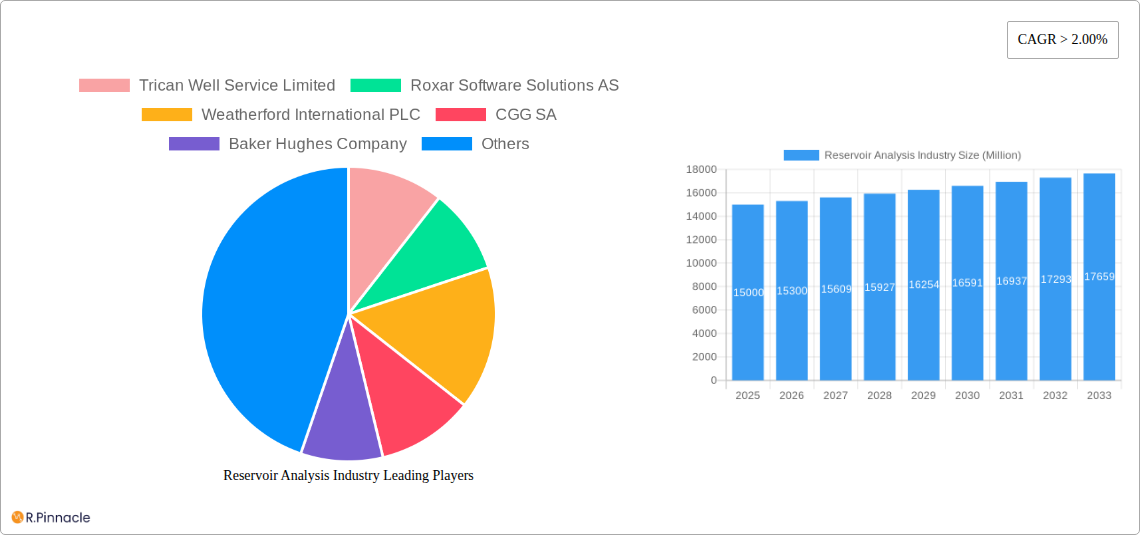
The Reservoir Analysis Industry is characterized by a moderately concentrated market structure, with key players like Schlumberger Limited, Halliburton Company, Baker Hughes Company, and CGG SA holding significant market share. The exact market share percentages for each company are not available and are estimated at xx%. Innovation is driven by the need for enhanced accuracy in reservoir characterization, improved efficiency in data processing, and the adoption of advanced technologies like Artificial Intelligence (AI) and Machine Learning (ML). Regulatory frameworks, varying by region, significantly influence operational costs and investment decisions. Product substitutes, while limited, include alternative geological modelling techniques. The end-user demographic predominantly comprises Oil and Gas Exploration and Production Companies. M&A activities, with deal values exceeding $XX Million in recent years, contribute to market consolidation and technological integration. For instance, a significant M&A deal value within the studied period is estimated at $xx Million.
- High Market Concentration: Top players hold a combined xx% market share.
- Key Innovation Drivers: AI/ML, improved data processing, enhanced reservoir characterization.
- Regulatory Impact: Varies significantly by region, influencing operational costs.
- M&A Activity: Significant consolidation with deal values exceeding $XX Million.
Reservoir Analysis Industry Market Dynamics & Trends
The Reservoir Analysis Industry is experiencing robust growth, driven by increasing global energy demand, the exploration of unconventional resources, and the ongoing technological advancements in data acquisition and analysis. The Compound Annual Growth Rate (CAGR) for the period 2025-2033 is projected to be xx%. Market penetration of advanced technologies, such as AI-powered reservoir simulation, is steadily increasing, improving efficiency and accuracy in reservoir management. Shifting consumer preferences towards sustainable energy solutions are impacting the industry's growth trajectory, with increased focus on carbon capture and storage technologies. Competitive dynamics are intense, with companies focusing on innovation, cost optimization, and strategic partnerships to maintain market share.
Dominant Regions & Segments in Reservoir Analysis Industry
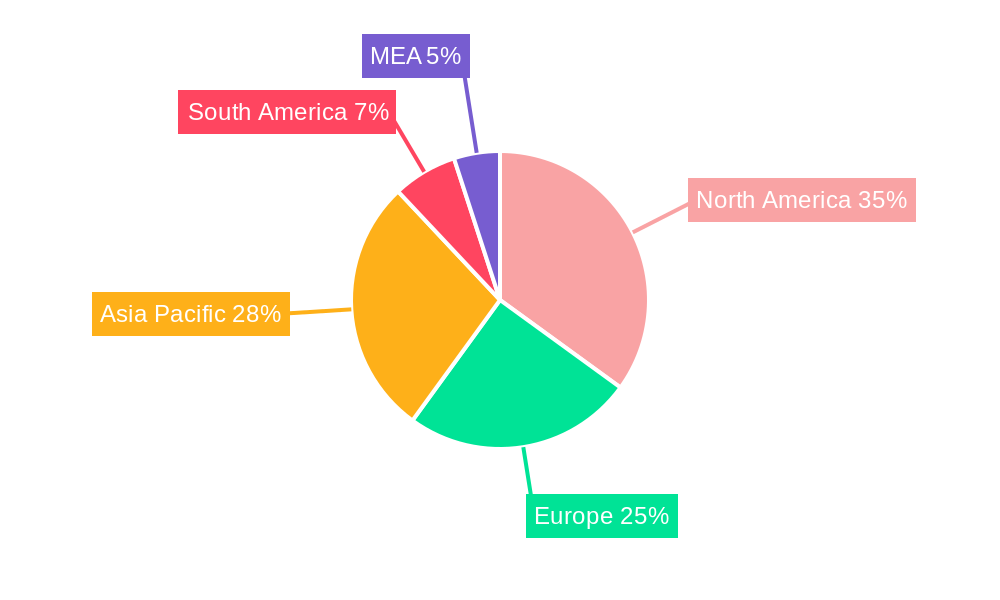
The North American region currently holds the dominant position in the Reservoir Analysis Industry due to its extensive shale gas reserves and robust oil and gas exploration activities. However, the Middle East and Asia-Pacific regions are expected to experience significant growth in the coming years, driven by large-scale investment in oil and gas infrastructure development and exploration of unconventional resources.
- Leading Region: North America (Significant reserves and robust exploration activities)
- Fastest Growing Region: Asia-Pacific (High investment in oil and gas infrastructure)
Dominant Segments:
- Reservoir Type: Both Conventional and Unconventional reservoirs contribute significantly to market demand, with a slight edge currently towards conventional reserves.
- Service: Reservoir Simulation is the largest segment, followed closely by Geo Modeling, reflecting the increasing demand for accurate reservoir characterization and production optimization.
- Application: Offshore application currently holds a larger market share compared to Onshore, driven by the exploration and development of offshore oil and gas reserves.
Key Drivers:
- North America: Abundant shale gas reserves, established oil & gas infrastructure.
- Middle East: Significant oil reserves, substantial investment in exploration.
- Asia-Pacific: Growing energy demand, increasing investment in oil & gas infrastructure.
Reservoir Analysis Industry Product Innovations
Recent product innovations are focused on integrating AI/ML algorithms into reservoir simulation and modeling software, improving predictive capabilities and reducing reliance on manual interpretation. New data acquisition and monitoring tools enable real-time reservoir performance analysis, leading to optimized production strategies. These advancements provide a competitive advantage by enhancing operational efficiency and reducing exploration risks. The market fit for these innovative products is strong, driven by the industry’s demand for better accuracy and cost-effectiveness.
Report Scope & Segmentation Analysis
This report comprehensively segments the Reservoir Analysis Industry by Reservoir Type (Conventional, Unconventional), Service (Geo Modeling, Reservoir Simulation, Data Acquisition and Monitoring, Reservoir Sampling, Others), and Application (Onshore, Offshore). Each segment provides a detailed analysis of market size, growth projections, and competitive dynamics, considering factors such as technological advancements and regional variations. The report offers a forecast for each segment's market size for the period of 2025-2033 with projections exceeding $XX Million in total.
Key Drivers of Reservoir Analysis Industry Growth
Several key factors drive the growth of the Reservoir Analysis Industry. Firstly, the ever-increasing global demand for energy fuels exploration and production activities, leading to higher demand for reservoir analysis services. Secondly, technological advancements, particularly in data analytics and AI/ML, significantly improve the accuracy and efficiency of reservoir characterization. Lastly, governmental regulations promoting sustainable energy practices influence investment in advanced reservoir management techniques for optimizing resource extraction and minimizing environmental impact.
Challenges in the Reservoir Analysis Industry Sector
The Reservoir Analysis Industry faces several challenges. Fluctuating oil and gas prices directly impact investment in exploration and production, hindering market growth. Furthermore, the complexities associated with unconventional resource extraction necessitate sophisticated, high-cost technologies, increasing operational expenses. Lastly, intense competition among industry players leads to pressure on pricing and profitability. These challenges collectively impact the industry’s overall growth and profitability in the coming years.
Emerging Opportunities in Reservoir Analysis Industry
Emerging opportunities in the Reservoir Analysis Industry include the application of advanced analytics to enhance reservoir management, the integration of IoT sensors for real-time data acquisition, and the development of sustainable solutions for carbon capture and storage. Furthermore, exploration and development of unconventional resources, such as shale gas and tight oil, represent significant growth opportunities. The increasing need for digitalization in the oil and gas sector creates numerous opportunities for software and data-driven solutions.
Leading Players in the Reservoir Analysis Industry Market
- Trican Well Service Limited
- Roxar Software Solutions AS
- Weatherford International PLC
- CGG SA
- Baker Hughes Company
- Halliburton Company
- Core Laboratories N V
- Schlumberger Limited
Key Developments in Reservoir Analysis Industry Industry
- June 2022: CGG secured a four-year contract extension for its reservoir services center with Petrobras in Rio de Janeiro, Brazil. This highlights the growing demand for specialized reservoir analysis services in key global markets.
- December 2022: ADNOC Offshore awarded major software contracts to Kappa and Amarile, signifying the increasing adoption of advanced software solutions for reservoir management and simulation. Kappa’s provision of EMERAUDE, SAPHIRE, and TOPAZ software systems underscores the industry's shift towards sophisticated technological solutions. Amarile’s contribution focuses on streamlining workflows, improving efficiency and accuracy of field dynamic simulations.
Future Outlook for Reservoir Analysis Industry Market
The future outlook for the Reservoir Analysis Industry is positive, driven by continued technological advancements, increasing energy demands, and exploration of unconventional resources. Strategic partnerships, mergers, and acquisitions will further shape the industry's landscape, while innovations in AI and ML will enhance reservoir characterization and management, leading to improved production efficiency and reduced environmental impact. The market is poised for substantial growth driven by innovation, global energy demands, and the adoption of new technologies.
Reservoir Analysis Industry Segmentation
-
1. Application
- 1.1. Onshore
- 1.2. Offshore
-
2. Reservoir Type
- 2.1. Conventional
- 2.2. Unconventional
-
3. Service
- 3.1. Geo Modeling
- 3.2. Reservoir Simulation
- 3.3. Data Acquisition and Monitoring
- 3.4. Reservoir Sampling
- 3.5. Others
Reservoir Analysis Industry Segmentation By Geography
- 1. North America
- 2. Asia Pacific
- 3. Europe
- 4. South America
- 5. Middle East and Africa
Reservoir Analysis Industry REPORT HIGHLIGHTS
| Aspects | Details |
|---|---|
| Study Period | 2019-2033 |
| Base Year | 2024 |
| Estimated Year | 2025 |
| Forecast Period | 2025-2033 |
| Historical Period | 2019-2024 |
| Growth Rate | CAGR of > 2.00% from 2019-2033 |
| Segmentation |
|
Table of Contents
- 1. Introduction
- 1.1. Research Scope
- 1.2. Market Segmentation
- 1.3. Research Methodology
- 1.4. Definitions and Assumptions
- 2. Executive Summary
- 2.1. Introduction
- 3. Market Dynamics
- 3.1. Introduction
- 3.2. Market Drivers
- 3.2.1. 4.; Increasing Automotive Sales in Saudi Arabia4.; Rising Demand from Heavy Automotives
- 3.3. Market Restrains
- 3.3.1. 4.; Rising Emphasis on Electric Vehicles
- 3.4. Market Trends
- 3.4.1. Unconventional Segment to Witness Fastest Growth
- 4. Market Factor Analysis
- 4.1. Porters Five Forces
- 4.2. Supply/Value Chain
- 4.3. PESTEL analysis
- 4.4. Market Entropy
- 4.5. Patent/Trademark Analysis
- 5. Global Reservoir Analysis Industry Analysis, Insights and Forecast, 2019-2031
- 5.1. Market Analysis, Insights and Forecast - by Application
- 5.1.1. Onshore
- 5.1.2. Offshore
- 5.2. Market Analysis, Insights and Forecast - by Reservoir Type
- 5.2.1. Conventional
- 5.2.2. Unconventional
- 5.3. Market Analysis, Insights and Forecast - by Service
- 5.3.1. Geo Modeling
- 5.3.2. Reservoir Simulation
- 5.3.3. Data Acquisition and Monitoring
- 5.3.4. Reservoir Sampling
- 5.3.5. Others
- 5.4. Market Analysis, Insights and Forecast - by Region
- 5.4.1. North America
- 5.4.2. Asia Pacific
- 5.4.3. Europe
- 5.4.4. South America
- 5.4.5. Middle East and Africa
- 5.1. Market Analysis, Insights and Forecast - by Application
- 6. North America Reservoir Analysis Industry Analysis, Insights and Forecast, 2019-2031
- 6.1. Market Analysis, Insights and Forecast - by Application
- 6.1.1. Onshore
- 6.1.2. Offshore
- 6.2. Market Analysis, Insights and Forecast - by Reservoir Type
- 6.2.1. Conventional
- 6.2.2. Unconventional
- 6.3. Market Analysis, Insights and Forecast - by Service
- 6.3.1. Geo Modeling
- 6.3.2. Reservoir Simulation
- 6.3.3. Data Acquisition and Monitoring
- 6.3.4. Reservoir Sampling
- 6.3.5. Others
- 6.1. Market Analysis, Insights and Forecast - by Application
- 7. Asia Pacific Reservoir Analysis Industry Analysis, Insights and Forecast, 2019-2031
- 7.1. Market Analysis, Insights and Forecast - by Application
- 7.1.1. Onshore
- 7.1.2. Offshore
- 7.2. Market Analysis, Insights and Forecast - by Reservoir Type
- 7.2.1. Conventional
- 7.2.2. Unconventional
- 7.3. Market Analysis, Insights and Forecast - by Service
- 7.3.1. Geo Modeling
- 7.3.2. Reservoir Simulation
- 7.3.3. Data Acquisition and Monitoring
- 7.3.4. Reservoir Sampling
- 7.3.5. Others
- 7.1. Market Analysis, Insights and Forecast - by Application
- 8. Europe Reservoir Analysis Industry Analysis, Insights and Forecast, 2019-2031
- 8.1. Market Analysis, Insights and Forecast - by Application
- 8.1.1. Onshore
- 8.1.2. Offshore
- 8.2. Market Analysis, Insights and Forecast - by Reservoir Type
- 8.2.1. Conventional
- 8.2.2. Unconventional
- 8.3. Market Analysis, Insights and Forecast - by Service
- 8.3.1. Geo Modeling
- 8.3.2. Reservoir Simulation
- 8.3.3. Data Acquisition and Monitoring
- 8.3.4. Reservoir Sampling
- 8.3.5. Others
- 8.1. Market Analysis, Insights and Forecast - by Application
- 9. South America Reservoir Analysis Industry Analysis, Insights and Forecast, 2019-2031
- 9.1. Market Analysis, Insights and Forecast - by Application
- 9.1.1. Onshore
- 9.1.2. Offshore
- 9.2. Market Analysis, Insights and Forecast - by Reservoir Type
- 9.2.1. Conventional
- 9.2.2. Unconventional
- 9.3. Market Analysis, Insights and Forecast - by Service
- 9.3.1. Geo Modeling
- 9.3.2. Reservoir Simulation
- 9.3.3. Data Acquisition and Monitoring
- 9.3.4. Reservoir Sampling
- 9.3.5. Others
- 9.1. Market Analysis, Insights and Forecast - by Application
- 10. Middle East and Africa Reservoir Analysis Industry Analysis, Insights and Forecast, 2019-2031
- 10.1. Market Analysis, Insights and Forecast - by Application
- 10.1.1. Onshore
- 10.1.2. Offshore
- 10.2. Market Analysis, Insights and Forecast - by Reservoir Type
- 10.2.1. Conventional
- 10.2.2. Unconventional
- 10.3. Market Analysis, Insights and Forecast - by Service
- 10.3.1. Geo Modeling
- 10.3.2. Reservoir Simulation
- 10.3.3. Data Acquisition and Monitoring
- 10.3.4. Reservoir Sampling
- 10.3.5. Others
- 10.1. Market Analysis, Insights and Forecast - by Application
- 11. North America Reservoir Analysis Industry Analysis, Insights and Forecast, 2019-2031
- 11.1. Market Analysis, Insights and Forecast - By Country/Sub-region
- 11.1.1 United States
- 11.1.2 Canada
- 11.1.3 Mexico
- 12. Europe Reservoir Analysis Industry Analysis, Insights and Forecast, 2019-2031
- 12.1. Market Analysis, Insights and Forecast - By Country/Sub-region
- 12.1.1 Germany
- 12.1.2 United Kingdom
- 12.1.3 France
- 12.1.4 Spain
- 12.1.5 Italy
- 12.1.6 Spain
- 12.1.7 Belgium
- 12.1.8 Netherland
- 12.1.9 Nordics
- 12.1.10 Rest of Europe
- 13. Asia Pacific Reservoir Analysis Industry Analysis, Insights and Forecast, 2019-2031
- 13.1. Market Analysis, Insights and Forecast - By Country/Sub-region
- 13.1.1 China
- 13.1.2 Japan
- 13.1.3 India
- 13.1.4 South Korea
- 13.1.5 Southeast Asia
- 13.1.6 Australia
- 13.1.7 Indonesia
- 13.1.8 Phillipes
- 13.1.9 Singapore
- 13.1.10 Thailandc
- 13.1.11 Rest of Asia Pacific
- 14. South America Reservoir Analysis Industry Analysis, Insights and Forecast, 2019-2031
- 14.1. Market Analysis, Insights and Forecast - By Country/Sub-region
- 14.1.1 Brazil
- 14.1.2 Argentina
- 14.1.3 Peru
- 14.1.4 Chile
- 14.1.5 Colombia
- 14.1.6 Ecuador
- 14.1.7 Venezuela
- 14.1.8 Rest of South America
- 15. MEA Reservoir Analysis Industry Analysis, Insights and Forecast, 2019-2031
- 15.1. Market Analysis, Insights and Forecast - By Country/Sub-region
- 15.1.1 United Arab Emirates
- 15.1.2 Saudi Arabia
- 15.1.3 South Africa
- 15.1.4 Rest of Middle East and Africa
- 16. Competitive Analysis
- 16.1. Global Market Share Analysis 2024
- 16.2. Company Profiles
- 16.2.1 Trican Well Service Limited
- 16.2.1.1. Overview
- 16.2.1.2. Products
- 16.2.1.3. SWOT Analysis
- 16.2.1.4. Recent Developments
- 16.2.1.5. Financials (Based on Availability)
- 16.2.2 Roxar Software Solutions AS
- 16.2.2.1. Overview
- 16.2.2.2. Products
- 16.2.2.3. SWOT Analysis
- 16.2.2.4. Recent Developments
- 16.2.2.5. Financials (Based on Availability)
- 16.2.3 Weatherford International PLC
- 16.2.3.1. Overview
- 16.2.3.2. Products
- 16.2.3.3. SWOT Analysis
- 16.2.3.4. Recent Developments
- 16.2.3.5. Financials (Based on Availability)
- 16.2.4 CGG SA
- 16.2.4.1. Overview
- 16.2.4.2. Products
- 16.2.4.3. SWOT Analysis
- 16.2.4.4. Recent Developments
- 16.2.4.5. Financials (Based on Availability)
- 16.2.5 Baker Hughes Company
- 16.2.5.1. Overview
- 16.2.5.2. Products
- 16.2.5.3. SWOT Analysis
- 16.2.5.4. Recent Developments
- 16.2.5.5. Financials (Based on Availability)
- 16.2.6 Halliburton Company
- 16.2.6.1. Overview
- 16.2.6.2. Products
- 16.2.6.3. SWOT Analysis
- 16.2.6.4. Recent Developments
- 16.2.6.5. Financials (Based on Availability)
- 16.2.7 Core Laboratories N V
- 16.2.7.1. Overview
- 16.2.7.2. Products
- 16.2.7.3. SWOT Analysis
- 16.2.7.4. Recent Developments
- 16.2.7.5. Financials (Based on Availability)
- 16.2.8 Schlumberger Limited
- 16.2.8.1. Overview
- 16.2.8.2. Products
- 16.2.8.3. SWOT Analysis
- 16.2.8.4. Recent Developments
- 16.2.8.5. Financials (Based on Availability)
- 16.2.1 Trican Well Service Limited
List of Figures
- Figure 1: Global Reservoir Analysis Industry Revenue Breakdown (Million, %) by Region 2024 & 2032
- Figure 2: North America Reservoir Analysis Industry Revenue (Million), by Country 2024 & 2032
- Figure 3: North America Reservoir Analysis Industry Revenue Share (%), by Country 2024 & 2032
- Figure 4: Europe Reservoir Analysis Industry Revenue (Million), by Country 2024 & 2032
- Figure 5: Europe Reservoir Analysis Industry Revenue Share (%), by Country 2024 & 2032
- Figure 6: Asia Pacific Reservoir Analysis Industry Revenue (Million), by Country 2024 & 2032
- Figure 7: Asia Pacific Reservoir Analysis Industry Revenue Share (%), by Country 2024 & 2032
- Figure 8: South America Reservoir Analysis Industry Revenue (Million), by Country 2024 & 2032
- Figure 9: South America Reservoir Analysis Industry Revenue Share (%), by Country 2024 & 2032
- Figure 10: MEA Reservoir Analysis Industry Revenue (Million), by Country 2024 & 2032
- Figure 11: MEA Reservoir Analysis Industry Revenue Share (%), by Country 2024 & 2032
- Figure 12: North America Reservoir Analysis Industry Revenue (Million), by Application 2024 & 2032
- Figure 13: North America Reservoir Analysis Industry Revenue Share (%), by Application 2024 & 2032
- Figure 14: North America Reservoir Analysis Industry Revenue (Million), by Reservoir Type 2024 & 2032
- Figure 15: North America Reservoir Analysis Industry Revenue Share (%), by Reservoir Type 2024 & 2032
- Figure 16: North America Reservoir Analysis Industry Revenue (Million), by Service 2024 & 2032
- Figure 17: North America Reservoir Analysis Industry Revenue Share (%), by Service 2024 & 2032
- Figure 18: North America Reservoir Analysis Industry Revenue (Million), by Country 2024 & 2032
- Figure 19: North America Reservoir Analysis Industry Revenue Share (%), by Country 2024 & 2032
- Figure 20: Asia Pacific Reservoir Analysis Industry Revenue (Million), by Application 2024 & 2032
- Figure 21: Asia Pacific Reservoir Analysis Industry Revenue Share (%), by Application 2024 & 2032
- Figure 22: Asia Pacific Reservoir Analysis Industry Revenue (Million), by Reservoir Type 2024 & 2032
- Figure 23: Asia Pacific Reservoir Analysis Industry Revenue Share (%), by Reservoir Type 2024 & 2032
- Figure 24: Asia Pacific Reservoir Analysis Industry Revenue (Million), by Service 2024 & 2032
- Figure 25: Asia Pacific Reservoir Analysis Industry Revenue Share (%), by Service 2024 & 2032
- Figure 26: Asia Pacific Reservoir Analysis Industry Revenue (Million), by Country 2024 & 2032
- Figure 27: Asia Pacific Reservoir Analysis Industry Revenue Share (%), by Country 2024 & 2032
- Figure 28: Europe Reservoir Analysis Industry Revenue (Million), by Application 2024 & 2032
- Figure 29: Europe Reservoir Analysis Industry Revenue Share (%), by Application 2024 & 2032
- Figure 30: Europe Reservoir Analysis Industry Revenue (Million), by Reservoir Type 2024 & 2032
- Figure 31: Europe Reservoir Analysis Industry Revenue Share (%), by Reservoir Type 2024 & 2032
- Figure 32: Europe Reservoir Analysis Industry Revenue (Million), by Service 2024 & 2032
- Figure 33: Europe Reservoir Analysis Industry Revenue Share (%), by Service 2024 & 2032
- Figure 34: Europe Reservoir Analysis Industry Revenue (Million), by Country 2024 & 2032
- Figure 35: Europe Reservoir Analysis Industry Revenue Share (%), by Country 2024 & 2032
- Figure 36: South America Reservoir Analysis Industry Revenue (Million), by Application 2024 & 2032
- Figure 37: South America Reservoir Analysis Industry Revenue Share (%), by Application 2024 & 2032
- Figure 38: South America Reservoir Analysis Industry Revenue (Million), by Reservoir Type 2024 & 2032
- Figure 39: South America Reservoir Analysis Industry Revenue Share (%), by Reservoir Type 2024 & 2032
- Figure 40: South America Reservoir Analysis Industry Revenue (Million), by Service 2024 & 2032
- Figure 41: South America Reservoir Analysis Industry Revenue Share (%), by Service 2024 & 2032
- Figure 42: South America Reservoir Analysis Industry Revenue (Million), by Country 2024 & 2032
- Figure 43: South America Reservoir Analysis Industry Revenue Share (%), by Country 2024 & 2032
- Figure 44: Middle East and Africa Reservoir Analysis Industry Revenue (Million), by Application 2024 & 2032
- Figure 45: Middle East and Africa Reservoir Analysis Industry Revenue Share (%), by Application 2024 & 2032
- Figure 46: Middle East and Africa Reservoir Analysis Industry Revenue (Million), by Reservoir Type 2024 & 2032
- Figure 47: Middle East and Africa Reservoir Analysis Industry Revenue Share (%), by Reservoir Type 2024 & 2032
- Figure 48: Middle East and Africa Reservoir Analysis Industry Revenue (Million), by Service 2024 & 2032
- Figure 49: Middle East and Africa Reservoir Analysis Industry Revenue Share (%), by Service 2024 & 2032
- Figure 50: Middle East and Africa Reservoir Analysis Industry Revenue (Million), by Country 2024 & 2032
- Figure 51: Middle East and Africa Reservoir Analysis Industry Revenue Share (%), by Country 2024 & 2032
List of Tables
- Table 1: Global Reservoir Analysis Industry Revenue Million Forecast, by Region 2019 & 2032
- Table 2: Global Reservoir Analysis Industry Revenue Million Forecast, by Application 2019 & 2032
- Table 3: Global Reservoir Analysis Industry Revenue Million Forecast, by Reservoir Type 2019 & 2032
- Table 4: Global Reservoir Analysis Industry Revenue Million Forecast, by Service 2019 & 2032
- Table 5: Global Reservoir Analysis Industry Revenue Million Forecast, by Region 2019 & 2032
- Table 6: Global Reservoir Analysis Industry Revenue Million Forecast, by Country 2019 & 2032
- Table 7: United States Reservoir Analysis Industry Revenue (Million) Forecast, by Application 2019 & 2032
- Table 8: Canada Reservoir Analysis Industry Revenue (Million) Forecast, by Application 2019 & 2032
- Table 9: Mexico Reservoir Analysis Industry Revenue (Million) Forecast, by Application 2019 & 2032
- Table 10: Global Reservoir Analysis Industry Revenue Million Forecast, by Country 2019 & 2032
- Table 11: Germany Reservoir Analysis Industry Revenue (Million) Forecast, by Application 2019 & 2032
- Table 12: United Kingdom Reservoir Analysis Industry Revenue (Million) Forecast, by Application 2019 & 2032
- Table 13: France Reservoir Analysis Industry Revenue (Million) Forecast, by Application 2019 & 2032
- Table 14: Spain Reservoir Analysis Industry Revenue (Million) Forecast, by Application 2019 & 2032
- Table 15: Italy Reservoir Analysis Industry Revenue (Million) Forecast, by Application 2019 & 2032
- Table 16: Spain Reservoir Analysis Industry Revenue (Million) Forecast, by Application 2019 & 2032
- Table 17: Belgium Reservoir Analysis Industry Revenue (Million) Forecast, by Application 2019 & 2032
- Table 18: Netherland Reservoir Analysis Industry Revenue (Million) Forecast, by Application 2019 & 2032
- Table 19: Nordics Reservoir Analysis Industry Revenue (Million) Forecast, by Application 2019 & 2032
- Table 20: Rest of Europe Reservoir Analysis Industry Revenue (Million) Forecast, by Application 2019 & 2032
- Table 21: Global Reservoir Analysis Industry Revenue Million Forecast, by Country 2019 & 2032
- Table 22: China Reservoir Analysis Industry Revenue (Million) Forecast, by Application 2019 & 2032
- Table 23: Japan Reservoir Analysis Industry Revenue (Million) Forecast, by Application 2019 & 2032
- Table 24: India Reservoir Analysis Industry Revenue (Million) Forecast, by Application 2019 & 2032
- Table 25: South Korea Reservoir Analysis Industry Revenue (Million) Forecast, by Application 2019 & 2032
- Table 26: Southeast Asia Reservoir Analysis Industry Revenue (Million) Forecast, by Application 2019 & 2032
- Table 27: Australia Reservoir Analysis Industry Revenue (Million) Forecast, by Application 2019 & 2032
- Table 28: Indonesia Reservoir Analysis Industry Revenue (Million) Forecast, by Application 2019 & 2032
- Table 29: Phillipes Reservoir Analysis Industry Revenue (Million) Forecast, by Application 2019 & 2032
- Table 30: Singapore Reservoir Analysis Industry Revenue (Million) Forecast, by Application 2019 & 2032
- Table 31: Thailandc Reservoir Analysis Industry Revenue (Million) Forecast, by Application 2019 & 2032
- Table 32: Rest of Asia Pacific Reservoir Analysis Industry Revenue (Million) Forecast, by Application 2019 & 2032
- Table 33: Global Reservoir Analysis Industry Revenue Million Forecast, by Country 2019 & 2032
- Table 34: Brazil Reservoir Analysis Industry Revenue (Million) Forecast, by Application 2019 & 2032
- Table 35: Argentina Reservoir Analysis Industry Revenue (Million) Forecast, by Application 2019 & 2032
- Table 36: Peru Reservoir Analysis Industry Revenue (Million) Forecast, by Application 2019 & 2032
- Table 37: Chile Reservoir Analysis Industry Revenue (Million) Forecast, by Application 2019 & 2032
- Table 38: Colombia Reservoir Analysis Industry Revenue (Million) Forecast, by Application 2019 & 2032
- Table 39: Ecuador Reservoir Analysis Industry Revenue (Million) Forecast, by Application 2019 & 2032
- Table 40: Venezuela Reservoir Analysis Industry Revenue (Million) Forecast, by Application 2019 & 2032
- Table 41: Rest of South America Reservoir Analysis Industry Revenue (Million) Forecast, by Application 2019 & 2032
- Table 42: Global Reservoir Analysis Industry Revenue Million Forecast, by Country 2019 & 2032
- Table 43: United Arab Emirates Reservoir Analysis Industry Revenue (Million) Forecast, by Application 2019 & 2032
- Table 44: Saudi Arabia Reservoir Analysis Industry Revenue (Million) Forecast, by Application 2019 & 2032
- Table 45: South Africa Reservoir Analysis Industry Revenue (Million) Forecast, by Application 2019 & 2032
- Table 46: Rest of Middle East and Africa Reservoir Analysis Industry Revenue (Million) Forecast, by Application 2019 & 2032
- Table 47: Global Reservoir Analysis Industry Revenue Million Forecast, by Application 2019 & 2032
- Table 48: Global Reservoir Analysis Industry Revenue Million Forecast, by Reservoir Type 2019 & 2032
- Table 49: Global Reservoir Analysis Industry Revenue Million Forecast, by Service 2019 & 2032
- Table 50: Global Reservoir Analysis Industry Revenue Million Forecast, by Country 2019 & 2032
- Table 51: Global Reservoir Analysis Industry Revenue Million Forecast, by Application 2019 & 2032
- Table 52: Global Reservoir Analysis Industry Revenue Million Forecast, by Reservoir Type 2019 & 2032
- Table 53: Global Reservoir Analysis Industry Revenue Million Forecast, by Service 2019 & 2032
- Table 54: Global Reservoir Analysis Industry Revenue Million Forecast, by Country 2019 & 2032
- Table 55: Global Reservoir Analysis Industry Revenue Million Forecast, by Application 2019 & 2032
- Table 56: Global Reservoir Analysis Industry Revenue Million Forecast, by Reservoir Type 2019 & 2032
- Table 57: Global Reservoir Analysis Industry Revenue Million Forecast, by Service 2019 & 2032
- Table 58: Global Reservoir Analysis Industry Revenue Million Forecast, by Country 2019 & 2032
- Table 59: Global Reservoir Analysis Industry Revenue Million Forecast, by Application 2019 & 2032
- Table 60: Global Reservoir Analysis Industry Revenue Million Forecast, by Reservoir Type 2019 & 2032
- Table 61: Global Reservoir Analysis Industry Revenue Million Forecast, by Service 2019 & 2032
- Table 62: Global Reservoir Analysis Industry Revenue Million Forecast, by Country 2019 & 2032
- Table 63: Global Reservoir Analysis Industry Revenue Million Forecast, by Application 2019 & 2032
- Table 64: Global Reservoir Analysis Industry Revenue Million Forecast, by Reservoir Type 2019 & 2032
- Table 65: Global Reservoir Analysis Industry Revenue Million Forecast, by Service 2019 & 2032
- Table 66: Global Reservoir Analysis Industry Revenue Million Forecast, by Country 2019 & 2032
Frequently Asked Questions
1. What is the projected Compound Annual Growth Rate (CAGR) of the Reservoir Analysis Industry?
The projected CAGR is approximately > 2.00%.
2. Which companies are prominent players in the Reservoir Analysis Industry?
Key companies in the market include Trican Well Service Limited, Roxar Software Solutions AS, Weatherford International PLC, CGG SA, Baker Hughes Company, Halliburton Company, Core Laboratories N V, Schlumberger Limited.
3. What are the main segments of the Reservoir Analysis Industry?
The market segments include Application, Reservoir Type, Service.
4. Can you provide details about the market size?
The market size is estimated to be USD XX Million as of 2022.
5. What are some drivers contributing to market growth?
4.; Increasing Automotive Sales in Saudi Arabia4.; Rising Demand from Heavy Automotives.
6. What are the notable trends driving market growth?
Unconventional Segment to Witness Fastest Growth.
7. Are there any restraints impacting market growth?
4.; Rising Emphasis on Electric Vehicles.
8. Can you provide examples of recent developments in the market?
December 2022: ADNOC Offshore awarded two major software contracts to Dome Principals, Kappa, and Amarile. Kappa, a petroleum engineering software company, will provide ADNOC with different types of Reservoir Related Software Management Systems such as EMERAUDE,SAPHIRE, TOPAZ, etc. Amarile is a company helping Reservoir Engineers speed up and improve the quality of their field dynamic simulation workflow.
9. What pricing options are available for accessing the report?
Pricing options include single-user, multi-user, and enterprise licenses priced at USD 4750, USD 5250, and USD 8750 respectively.
10. Is the market size provided in terms of value or volume?
The market size is provided in terms of value, measured in Million.
11. Are there any specific market keywords associated with the report?
Yes, the market keyword associated with the report is "Reservoir Analysis Industry," which aids in identifying and referencing the specific market segment covered.
12. How do I determine which pricing option suits my needs best?
The pricing options vary based on user requirements and access needs. Individual users may opt for single-user licenses, while businesses requiring broader access may choose multi-user or enterprise licenses for cost-effective access to the report.
13. Are there any additional resources or data provided in the Reservoir Analysis Industry report?
While the report offers comprehensive insights, it's advisable to review the specific contents or supplementary materials provided to ascertain if additional resources or data are available.
14. How can I stay updated on further developments or reports in the Reservoir Analysis Industry?
To stay informed about further developments, trends, and reports in the Reservoir Analysis Industry, consider subscribing to industry newsletters, following relevant companies and organizations, or regularly checking reputable industry news sources and publications.
Methodology
Step 1 - Identification of Relevant Samples Size from Population Database


Step 2 - Approaches for Defining Global Market Size (Value, Volume* & Price*)

Note*: In applicable scenarios
Step 3 - Data Sources
Primary Research
- Web Analytics
- Survey Reports
- Research Institute
- Latest Research Reports
- Opinion Leaders
Secondary Research
- Annual Reports
- White Paper
- Latest Press Release
- Industry Association
- Paid Database
- Investor Presentations

Step 4 - Data Triangulation
Involves using different sources of information in order to increase the validity of a study
These sources are likely to be stakeholders in a program - participants, other researchers, program staff, other community members, and so on.
Then we put all data in single framework & apply various statistical tools to find out the dynamic on the market.
During the analysis stage, feedback from the stakeholder groups would be compared to determine areas of agreement as well as areas of divergence


