
Key Insights
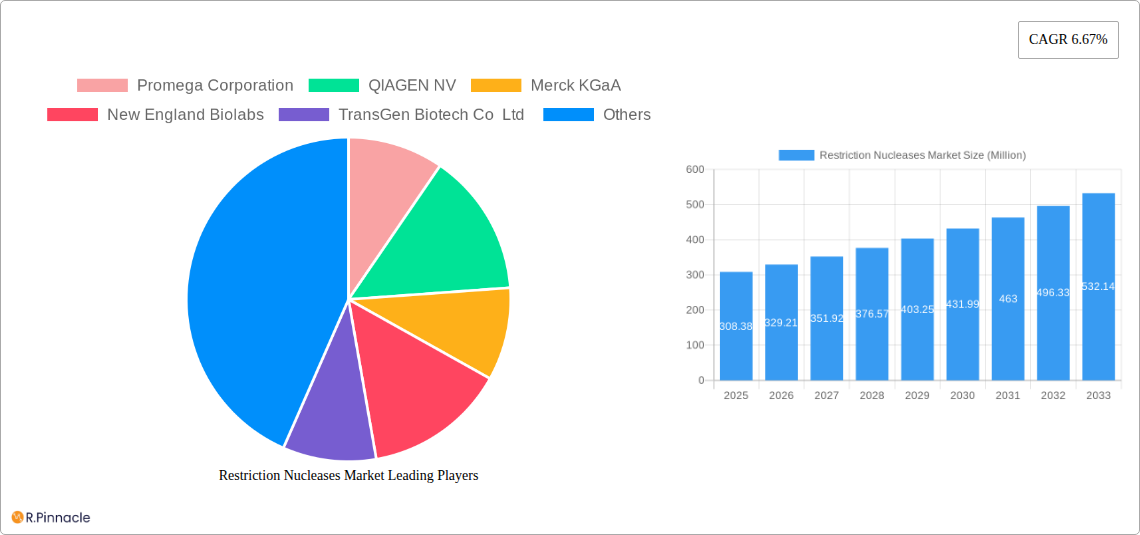
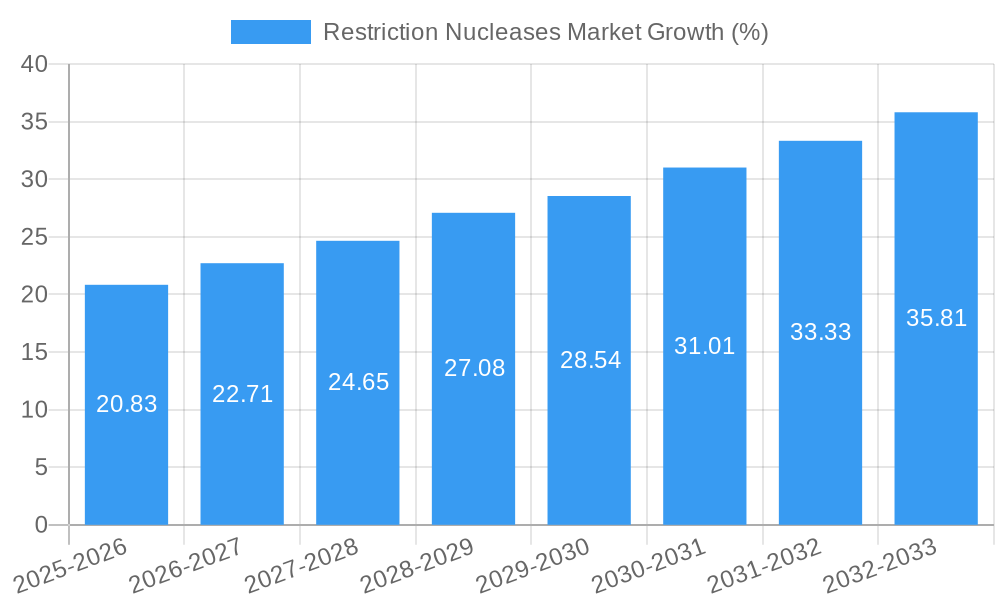
The Restriction Nucleases market, valued at $308.38 million in 2025, is projected to experience robust growth, driven by the increasing adoption of gene editing technologies in various applications. The market's Compound Annual Growth Rate (CAGR) of 6.67% from 2025 to 2033 indicates a significant expansion over the forecast period. Key drivers include the rising prevalence of genetic disorders necessitating advanced therapeutic interventions, the expanding application of restriction nucleases in genomics research (including gene sequencing and DNA mapping), and the growing demand for these enzymes from pharmaceutical and biotechnology companies for drug discovery and development. The market segmentation reveals a strong presence across various types of restriction nucleases, with Type II enzymes likely holding a significant share due to their enhanced specificity and efficiency. The pharmaceutical and biotechnology sector dominates the end-user segment, reflecting the critical role of restriction nucleases in biopharmaceutical production. Geographic analysis suggests strong growth potential in regions like Asia Pacific, fueled by increasing research and development activities and a growing life sciences industry. While challenges may exist in terms of cost and regulatory hurdles related to new gene editing technologies, the overall market trajectory remains positive, promising substantial opportunities for market players in the coming years.
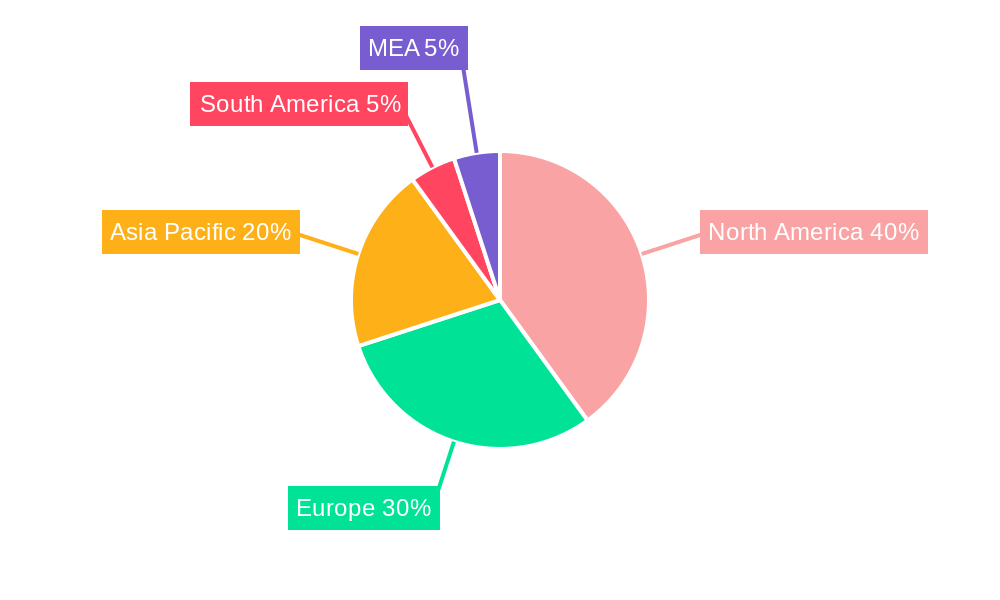
Continued technological advancements in gene editing, coupled with increasing investments in research and development within the genomics field, are expected to further accelerate market growth. The development of novel restriction nucleases with improved properties, such as increased specificity and reduced off-target effects, will create new applications and drive demand. The growing interest in personalized medicine and the development of targeted therapies will also contribute to the market's expansion. North America currently holds a significant market share, driven by the presence of established players, advanced research infrastructure, and high healthcare expenditure. However, emerging economies in Asia Pacific and other regions are expected to witness faster growth rates, presenting significant opportunities for market expansion. The competitive landscape is characterized by the presence of both established players and emerging companies, leading to innovation and product development within this dynamic sector.
Restriction Nucleases Market: A Comprehensive Report (2019-2033)
This in-depth report provides a comprehensive analysis of the Restriction Nucleases Market, offering valuable insights for industry professionals, investors, and researchers. Covering the period from 2019 to 2033, with a base year of 2025 and a forecast period of 2025-2033, this report meticulously examines market dynamics, segmentation, leading players, and future growth prospects. The market is expected to reach xx Million by 2033, exhibiting a CAGR of xx% during the forecast period.
Restriction Nucleases Market Structure & Innovation Trends
The Restriction Nucleases Market exhibits a moderately consolidated structure, with key players like Promega Corporation, QIAGEN NV, Merck KGaA, New England Biolabs, and Thermo Fisher Scientific holding significant market share. The exact market share distribution is detailed within the report. Innovation is driven by advancements in gene editing technologies, particularly CRISPR-Cas systems, which are increasing demand for highly specific and efficient restriction nucleases. Regulatory frameworks, such as those governing the use of genetically modified organisms (GMOs), significantly impact market growth. The market also faces competition from alternative gene editing techniques. Mergers and acquisitions (M&A) activity in the sector is moderate, with deal values averaging approximately xx Million per transaction in recent years. Examples of recent M&A activity are included in the full report. End-user demographics are diversified, primarily comprising pharmaceutical and biotechnology companies, academic research institutions, and contract research organizations.
- Market Concentration: Moderately Consolidated
- Key Innovation Drivers: CRISPR-Cas systems, advancements in gene editing technologies
- Regulatory Landscape: Significant impact from GMO regulations
- M&A Activity: Moderate, with average deal values of approximately xx Million.
Restriction Nucleases Market Dynamics & Trends
The Restriction Nucleases Market is experiencing robust growth, primarily driven by the burgeoning biotechnology and pharmaceutical industries. Increased investments in genomic research, personalized medicine, and the development of advanced therapeutics are fueling demand. Technological disruptions, such as the development of next-generation sequencing technologies and improved gene editing tools, are enhancing the capabilities and applications of restriction nucleases. Consumer preferences are shifting towards more efficient, accurate, and cost-effective solutions. Competitive dynamics are characterized by intense competition among established players and emerging companies. The market penetration of restriction nucleases in various applications is steadily increasing. Market growth is projected at a CAGR of xx% during the forecast period.
Dominant Regions & Segments in Restriction Nucleases Market
North America currently dominates the Restriction Nucleases Market, driven by strong R&D investments and the presence of major players. Europe holds a significant market share, followed by Asia-Pacific. The Type II restriction nucleases segment holds the largest market share due to their widespread use in various applications. Within applications, genetic engineering and gene sequencing represent the most significant market segments. Pharmaceutical and biotechnology companies are the primary end-users.
- Leading Region: North America
- Key Drivers for North America: Strong R&D investments, presence of major players
- Largest Segment (Type): Type II
- Largest Segment (Application): Genetic Engineering, Gene Sequencing
- Largest Segment (End-User): Pharmaceutical and Biotechnology Companies
Restriction Nucleases Market Product Innovations
Recent innovations focus on developing novel restriction nucleases with enhanced specificity, efficiency, and versatility. This includes the engineering of novel enzymes with tailored properties for specific applications, such as CRISPR-Cas systems. These innovations are improving the market fit by addressing limitations of traditional enzymes and expanding the range of applications.
Report Scope & Segmentation Analysis
This report segments the Restriction Nucleases Market based on Type (Type I, Type II, Type III, Other Types), Application (Genetic Engineering, DNA Mapping, Gene Sequencing, Other Applications), and End-User (Pharmaceutical and Biotechnology Companies, Academic Research Institutes, Other End Users). Each segment's growth projections, market size, and competitive dynamics are thoroughly analyzed within the full report.
Key Drivers of Restriction Nucleases Market Growth
The Restriction Nucleases Market is driven by several factors: rising demand for advanced gene editing tools, increased investments in genomics research, and the growing adoption of personalized medicine. The development of novel enzymes with enhanced properties and technological advancements also contribute significantly.
Challenges in the Restriction Nucleases Market Sector
The market faces challenges, including stringent regulatory approvals, potential supply chain disruptions, and the intense competition among existing players. The high cost of development and manufacturing also represents a barrier to entry for new companies.
Emerging Opportunities in Restriction Nucleases Market
Emerging opportunities lie in the development of novel enzymes for CRISPR-Cas systems and other gene editing technologies. Expanding applications in areas such as agriculture and environmental remediation also present significant growth potential.
Leading Players in the Restriction Nucleases Market Market
- Promega Corporation
- QIAGEN NV
- Merck KGaA
- New England Biolabs
- TransGen Biotech Co Ltd
- Takara Bio Inc
- GenScript
- Illumina Inc
- Thermo Fisher Scientific
- Agilent Technologies
Key Developments in Restriction Nucleases Market Industry
- August 2022: MedGenome raised USD 50.0 Million, highlighting the growing investment in genomic sequencing and the use of restriction endonucleases in drug discovery.
- March 2022: Roche CustomBiotech launched Restriction enzyme Xba I, expanding the range of available enzymes for mRNA therapeutics and vaccine manufacturing.
Future Outlook for Restriction Nucleases Market Market
The Restriction Nucleases Market is poised for continued growth, driven by ongoing advancements in gene editing technologies and their increasing adoption across various applications. Strategic partnerships and collaborations among players are expected to further accelerate market expansion. The market presents lucrative opportunities for companies focused on innovation and market expansion in emerging regions.
Restriction Nucleases Market Segmentation
-
1. Type
- 1.1. Type I
- 1.2. Type II
- 1.3. Type III
- 1.4. Other Types
-
2. Application
- 2.1. Genetic Engineering
- 2.2. DNA Mapping
- 2.3. Gene Sequencing
- 2.4. Other Applications
-
3. End User
- 3.1. Pharmaceutical and Biotechnology Companies
- 3.2. Academic Research Institutes
- 3.3. Other End Users
Restriction Nucleases Market Segmentation By Geography
-
1. North America
- 1.1. United States
- 1.2. Canada
- 1.3. Mexico
-
2. Europe
- 2.1. Germany
- 2.2. United Kingdom
- 2.3. France
- 2.4. Italy
- 2.5. Spain
- 2.6. Rest of Europe
-
3. Asia Pacific
- 3.1. China
- 3.2. Japan
- 3.3. India
- 3.4. Australia
- 3.5. South Korea
- 3.6. Rest of Asia Pacific
- 4. Rest of the World
Restriction Nucleases Market REPORT HIGHLIGHTS
| Aspects | Details |
|---|---|
| Study Period | 2019-2033 |
| Base Year | 2024 |
| Estimated Year | 2025 |
| Forecast Period | 2025-2033 |
| Historical Period | 2019-2024 |
| Growth Rate | CAGR of 6.67% from 2019-2033 |
| Segmentation |
|
Table of Contents
- 1. Introduction
- 1.1. Research Scope
- 1.2. Market Segmentation
- 1.3. Research Methodology
- 1.4. Definitions and Assumptions
- 2. Executive Summary
- 2.1. Introduction
- 3. Market Dynamics
- 3.1. Introduction
- 3.2. Market Drivers
- 3.2.1. Rising Use of Restriction Endonucleases in Various Applications; Increasing Expenditure on Research and Development by Biotechnology and Pharmaceutical Companies.
- 3.3. Market Restrains
- 3.3.1. High Cost Restriction Endonucleases Production
- 3.4. Market Trends
- 3.4.1. Genetic Engineering is Expected to Hold a Significant Market Share Over the Forecast Period
- 4. Market Factor Analysis
- 4.1. Porters Five Forces
- 4.2. Supply/Value Chain
- 4.3. PESTEL analysis
- 4.4. Market Entropy
- 4.5. Patent/Trademark Analysis
- 5. Global Restriction Nucleases Market Analysis, Insights and Forecast, 2019-2031
- 5.1. Market Analysis, Insights and Forecast - by Type
- 5.1.1. Type I
- 5.1.2. Type II
- 5.1.3. Type III
- 5.1.4. Other Types
- 5.2. Market Analysis, Insights and Forecast - by Application
- 5.2.1. Genetic Engineering
- 5.2.2. DNA Mapping
- 5.2.3. Gene Sequencing
- 5.2.4. Other Applications
- 5.3. Market Analysis, Insights and Forecast - by End User
- 5.3.1. Pharmaceutical and Biotechnology Companies
- 5.3.2. Academic Research Institutes
- 5.3.3. Other End Users
- 5.4. Market Analysis, Insights and Forecast - by Region
- 5.4.1. North America
- 5.4.2. Europe
- 5.4.3. Asia Pacific
- 5.4.4. Rest of the World
- 5.1. Market Analysis, Insights and Forecast - by Type
- 6. North America Restriction Nucleases Market Analysis, Insights and Forecast, 2019-2031
- 6.1. Market Analysis, Insights and Forecast - by Type
- 6.1.1. Type I
- 6.1.2. Type II
- 6.1.3. Type III
- 6.1.4. Other Types
- 6.2. Market Analysis, Insights and Forecast - by Application
- 6.2.1. Genetic Engineering
- 6.2.2. DNA Mapping
- 6.2.3. Gene Sequencing
- 6.2.4. Other Applications
- 6.3. Market Analysis, Insights and Forecast - by End User
- 6.3.1. Pharmaceutical and Biotechnology Companies
- 6.3.2. Academic Research Institutes
- 6.3.3. Other End Users
- 6.1. Market Analysis, Insights and Forecast - by Type
- 7. Europe Restriction Nucleases Market Analysis, Insights and Forecast, 2019-2031
- 7.1. Market Analysis, Insights and Forecast - by Type
- 7.1.1. Type I
- 7.1.2. Type II
- 7.1.3. Type III
- 7.1.4. Other Types
- 7.2. Market Analysis, Insights and Forecast - by Application
- 7.2.1. Genetic Engineering
- 7.2.2. DNA Mapping
- 7.2.3. Gene Sequencing
- 7.2.4. Other Applications
- 7.3. Market Analysis, Insights and Forecast - by End User
- 7.3.1. Pharmaceutical and Biotechnology Companies
- 7.3.2. Academic Research Institutes
- 7.3.3. Other End Users
- 7.1. Market Analysis, Insights and Forecast - by Type
- 8. Asia Pacific Restriction Nucleases Market Analysis, Insights and Forecast, 2019-2031
- 8.1. Market Analysis, Insights and Forecast - by Type
- 8.1.1. Type I
- 8.1.2. Type II
- 8.1.3. Type III
- 8.1.4. Other Types
- 8.2. Market Analysis, Insights and Forecast - by Application
- 8.2.1. Genetic Engineering
- 8.2.2. DNA Mapping
- 8.2.3. Gene Sequencing
- 8.2.4. Other Applications
- 8.3. Market Analysis, Insights and Forecast - by End User
- 8.3.1. Pharmaceutical and Biotechnology Companies
- 8.3.2. Academic Research Institutes
- 8.3.3. Other End Users
- 8.1. Market Analysis, Insights and Forecast - by Type
- 9. Rest of the World Restriction Nucleases Market Analysis, Insights and Forecast, 2019-2031
- 9.1. Market Analysis, Insights and Forecast - by Type
- 9.1.1. Type I
- 9.1.2. Type II
- 9.1.3. Type III
- 9.1.4. Other Types
- 9.2. Market Analysis, Insights and Forecast - by Application
- 9.2.1. Genetic Engineering
- 9.2.2. DNA Mapping
- 9.2.3. Gene Sequencing
- 9.2.4. Other Applications
- 9.3. Market Analysis, Insights and Forecast - by End User
- 9.3.1. Pharmaceutical and Biotechnology Companies
- 9.3.2. Academic Research Institutes
- 9.3.3. Other End Users
- 9.1. Market Analysis, Insights and Forecast - by Type
- 10. North America Restriction Nucleases Market Analysis, Insights and Forecast, 2019-2031
- 10.1. Market Analysis, Insights and Forecast - By Country/Sub-region
- 10.1.1 United States
- 10.1.2 Canada
- 10.1.3 Mexico
- 11. Europe Restriction Nucleases Market Analysis, Insights and Forecast, 2019-2031
- 11.1. Market Analysis, Insights and Forecast - By Country/Sub-region
- 11.1.1 Germany
- 11.1.2 United Kingdom
- 11.1.3 France
- 11.1.4 Spain
- 11.1.5 Italy
- 11.1.6 Spain
- 11.1.7 Belgium
- 11.1.8 Netherland
- 11.1.9 Nordics
- 11.1.10 Rest of Europe
- 12. Asia Pacific Restriction Nucleases Market Analysis, Insights and Forecast, 2019-2031
- 12.1. Market Analysis, Insights and Forecast - By Country/Sub-region
- 12.1.1 China
- 12.1.2 Japan
- 12.1.3 India
- 12.1.4 South Korea
- 12.1.5 Southeast Asia
- 12.1.6 Australia
- 12.1.7 Indonesia
- 12.1.8 Phillipes
- 12.1.9 Singapore
- 12.1.10 Thailandc
- 12.1.11 Rest of Asia Pacific
- 13. South America Restriction Nucleases Market Analysis, Insights and Forecast, 2019-2031
- 13.1. Market Analysis, Insights and Forecast - By Country/Sub-region
- 13.1.1 Brazil
- 13.1.2 Argentina
- 13.1.3 Peru
- 13.1.4 Chile
- 13.1.5 Colombia
- 13.1.6 Ecuador
- 13.1.7 Venezuela
- 13.1.8 Rest of South America
- 14. North America Restriction Nucleases Market Analysis, Insights and Forecast, 2019-2031
- 14.1. Market Analysis, Insights and Forecast - By Country/Sub-region
- 14.1.1 United States
- 14.1.2 Canada
- 14.1.3 Mexico
- 15. MEA Restriction Nucleases Market Analysis, Insights and Forecast, 2019-2031
- 15.1. Market Analysis, Insights and Forecast - By Country/Sub-region
- 15.1.1 United Arab Emirates
- 15.1.2 Saudi Arabia
- 15.1.3 South Africa
- 15.1.4 Rest of Middle East and Africa
- 16. Competitive Analysis
- 16.1. Global Market Share Analysis 2024
- 16.2. Company Profiles
- 16.2.1 Promega Corporation
- 16.2.1.1. Overview
- 16.2.1.2. Products
- 16.2.1.3. SWOT Analysis
- 16.2.1.4. Recent Developments
- 16.2.1.5. Financials (Based on Availability)
- 16.2.2 QIAGEN NV
- 16.2.2.1. Overview
- 16.2.2.2. Products
- 16.2.2.3. SWOT Analysis
- 16.2.2.4. Recent Developments
- 16.2.2.5. Financials (Based on Availability)
- 16.2.3 Merck KGaA
- 16.2.3.1. Overview
- 16.2.3.2. Products
- 16.2.3.3. SWOT Analysis
- 16.2.3.4. Recent Developments
- 16.2.3.5. Financials (Based on Availability)
- 16.2.4 New England Biolabs
- 16.2.4.1. Overview
- 16.2.4.2. Products
- 16.2.4.3. SWOT Analysis
- 16.2.4.4. Recent Developments
- 16.2.4.5. Financials (Based on Availability)
- 16.2.5 TransGen Biotech Co Ltd
- 16.2.5.1. Overview
- 16.2.5.2. Products
- 16.2.5.3. SWOT Analysis
- 16.2.5.4. Recent Developments
- 16.2.5.5. Financials (Based on Availability)
- 16.2.6 Takara Bio Inc
- 16.2.6.1. Overview
- 16.2.6.2. Products
- 16.2.6.3. SWOT Analysis
- 16.2.6.4. Recent Developments
- 16.2.6.5. Financials (Based on Availability)
- 16.2.7 GenScript
- 16.2.7.1. Overview
- 16.2.7.2. Products
- 16.2.7.3. SWOT Analysis
- 16.2.7.4. Recent Developments
- 16.2.7.5. Financials (Based on Availability)
- 16.2.8 Illumina Inc
- 16.2.8.1. Overview
- 16.2.8.2. Products
- 16.2.8.3. SWOT Analysis
- 16.2.8.4. Recent Developments
- 16.2.8.5. Financials (Based on Availability)
- 16.2.9 Thermo Fisher Scientific
- 16.2.9.1. Overview
- 16.2.9.2. Products
- 16.2.9.3. SWOT Analysis
- 16.2.9.4. Recent Developments
- 16.2.9.5. Financials (Based on Availability)
- 16.2.10 Agilent Technologies
- 16.2.10.1. Overview
- 16.2.10.2. Products
- 16.2.10.3. SWOT Analysis
- 16.2.10.4. Recent Developments
- 16.2.10.5. Financials (Based on Availability)
- 16.2.1 Promega Corporation
List of Figures
- Figure 1: Global Restriction Nucleases Market Revenue Breakdown (Million, %) by Region 2024 & 2032
- Figure 2: Global Restriction Nucleases Market Volume Breakdown (K Unit, %) by Region 2024 & 2032
- Figure 3: North America Restriction Nucleases Market Revenue (Million), by Country 2024 & 2032
- Figure 4: North America Restriction Nucleases Market Volume (K Unit), by Country 2024 & 2032
- Figure 5: North America Restriction Nucleases Market Revenue Share (%), by Country 2024 & 2032
- Figure 6: North America Restriction Nucleases Market Volume Share (%), by Country 2024 & 2032
- Figure 7: Europe Restriction Nucleases Market Revenue (Million), by Country 2024 & 2032
- Figure 8: Europe Restriction Nucleases Market Volume (K Unit), by Country 2024 & 2032
- Figure 9: Europe Restriction Nucleases Market Revenue Share (%), by Country 2024 & 2032
- Figure 10: Europe Restriction Nucleases Market Volume Share (%), by Country 2024 & 2032
- Figure 11: Asia Pacific Restriction Nucleases Market Revenue (Million), by Country 2024 & 2032
- Figure 12: Asia Pacific Restriction Nucleases Market Volume (K Unit), by Country 2024 & 2032
- Figure 13: Asia Pacific Restriction Nucleases Market Revenue Share (%), by Country 2024 & 2032
- Figure 14: Asia Pacific Restriction Nucleases Market Volume Share (%), by Country 2024 & 2032
- Figure 15: South America Restriction Nucleases Market Revenue (Million), by Country 2024 & 2032
- Figure 16: South America Restriction Nucleases Market Volume (K Unit), by Country 2024 & 2032
- Figure 17: South America Restriction Nucleases Market Revenue Share (%), by Country 2024 & 2032
- Figure 18: South America Restriction Nucleases Market Volume Share (%), by Country 2024 & 2032
- Figure 19: North America Restriction Nucleases Market Revenue (Million), by Country 2024 & 2032
- Figure 20: North America Restriction Nucleases Market Volume (K Unit), by Country 2024 & 2032
- Figure 21: North America Restriction Nucleases Market Revenue Share (%), by Country 2024 & 2032
- Figure 22: North America Restriction Nucleases Market Volume Share (%), by Country 2024 & 2032
- Figure 23: MEA Restriction Nucleases Market Revenue (Million), by Country 2024 & 2032
- Figure 24: MEA Restriction Nucleases Market Volume (K Unit), by Country 2024 & 2032
- Figure 25: MEA Restriction Nucleases Market Revenue Share (%), by Country 2024 & 2032
- Figure 26: MEA Restriction Nucleases Market Volume Share (%), by Country 2024 & 2032
- Figure 27: North America Restriction Nucleases Market Revenue (Million), by Type 2024 & 2032
- Figure 28: North America Restriction Nucleases Market Volume (K Unit), by Type 2024 & 2032
- Figure 29: North America Restriction Nucleases Market Revenue Share (%), by Type 2024 & 2032
- Figure 30: North America Restriction Nucleases Market Volume Share (%), by Type 2024 & 2032
- Figure 31: North America Restriction Nucleases Market Revenue (Million), by Application 2024 & 2032
- Figure 32: North America Restriction Nucleases Market Volume (K Unit), by Application 2024 & 2032
- Figure 33: North America Restriction Nucleases Market Revenue Share (%), by Application 2024 & 2032
- Figure 34: North America Restriction Nucleases Market Volume Share (%), by Application 2024 & 2032
- Figure 35: North America Restriction Nucleases Market Revenue (Million), by End User 2024 & 2032
- Figure 36: North America Restriction Nucleases Market Volume (K Unit), by End User 2024 & 2032
- Figure 37: North America Restriction Nucleases Market Revenue Share (%), by End User 2024 & 2032
- Figure 38: North America Restriction Nucleases Market Volume Share (%), by End User 2024 & 2032
- Figure 39: North America Restriction Nucleases Market Revenue (Million), by Country 2024 & 2032
- Figure 40: North America Restriction Nucleases Market Volume (K Unit), by Country 2024 & 2032
- Figure 41: North America Restriction Nucleases Market Revenue Share (%), by Country 2024 & 2032
- Figure 42: North America Restriction Nucleases Market Volume Share (%), by Country 2024 & 2032
- Figure 43: Europe Restriction Nucleases Market Revenue (Million), by Type 2024 & 2032
- Figure 44: Europe Restriction Nucleases Market Volume (K Unit), by Type 2024 & 2032
- Figure 45: Europe Restriction Nucleases Market Revenue Share (%), by Type 2024 & 2032
- Figure 46: Europe Restriction Nucleases Market Volume Share (%), by Type 2024 & 2032
- Figure 47: Europe Restriction Nucleases Market Revenue (Million), by Application 2024 & 2032
- Figure 48: Europe Restriction Nucleases Market Volume (K Unit), by Application 2024 & 2032
- Figure 49: Europe Restriction Nucleases Market Revenue Share (%), by Application 2024 & 2032
- Figure 50: Europe Restriction Nucleases Market Volume Share (%), by Application 2024 & 2032
- Figure 51: Europe Restriction Nucleases Market Revenue (Million), by End User 2024 & 2032
- Figure 52: Europe Restriction Nucleases Market Volume (K Unit), by End User 2024 & 2032
- Figure 53: Europe Restriction Nucleases Market Revenue Share (%), by End User 2024 & 2032
- Figure 54: Europe Restriction Nucleases Market Volume Share (%), by End User 2024 & 2032
- Figure 55: Europe Restriction Nucleases Market Revenue (Million), by Country 2024 & 2032
- Figure 56: Europe Restriction Nucleases Market Volume (K Unit), by Country 2024 & 2032
- Figure 57: Europe Restriction Nucleases Market Revenue Share (%), by Country 2024 & 2032
- Figure 58: Europe Restriction Nucleases Market Volume Share (%), by Country 2024 & 2032
- Figure 59: Asia Pacific Restriction Nucleases Market Revenue (Million), by Type 2024 & 2032
- Figure 60: Asia Pacific Restriction Nucleases Market Volume (K Unit), by Type 2024 & 2032
- Figure 61: Asia Pacific Restriction Nucleases Market Revenue Share (%), by Type 2024 & 2032
- Figure 62: Asia Pacific Restriction Nucleases Market Volume Share (%), by Type 2024 & 2032
- Figure 63: Asia Pacific Restriction Nucleases Market Revenue (Million), by Application 2024 & 2032
- Figure 64: Asia Pacific Restriction Nucleases Market Volume (K Unit), by Application 2024 & 2032
- Figure 65: Asia Pacific Restriction Nucleases Market Revenue Share (%), by Application 2024 & 2032
- Figure 66: Asia Pacific Restriction Nucleases Market Volume Share (%), by Application 2024 & 2032
- Figure 67: Asia Pacific Restriction Nucleases Market Revenue (Million), by End User 2024 & 2032
- Figure 68: Asia Pacific Restriction Nucleases Market Volume (K Unit), by End User 2024 & 2032
- Figure 69: Asia Pacific Restriction Nucleases Market Revenue Share (%), by End User 2024 & 2032
- Figure 70: Asia Pacific Restriction Nucleases Market Volume Share (%), by End User 2024 & 2032
- Figure 71: Asia Pacific Restriction Nucleases Market Revenue (Million), by Country 2024 & 2032
- Figure 72: Asia Pacific Restriction Nucleases Market Volume (K Unit), by Country 2024 & 2032
- Figure 73: Asia Pacific Restriction Nucleases Market Revenue Share (%), by Country 2024 & 2032
- Figure 74: Asia Pacific Restriction Nucleases Market Volume Share (%), by Country 2024 & 2032
- Figure 75: Rest of the World Restriction Nucleases Market Revenue (Million), by Type 2024 & 2032
- Figure 76: Rest of the World Restriction Nucleases Market Volume (K Unit), by Type 2024 & 2032
- Figure 77: Rest of the World Restriction Nucleases Market Revenue Share (%), by Type 2024 & 2032
- Figure 78: Rest of the World Restriction Nucleases Market Volume Share (%), by Type 2024 & 2032
- Figure 79: Rest of the World Restriction Nucleases Market Revenue (Million), by Application 2024 & 2032
- Figure 80: Rest of the World Restriction Nucleases Market Volume (K Unit), by Application 2024 & 2032
- Figure 81: Rest of the World Restriction Nucleases Market Revenue Share (%), by Application 2024 & 2032
- Figure 82: Rest of the World Restriction Nucleases Market Volume Share (%), by Application 2024 & 2032
- Figure 83: Rest of the World Restriction Nucleases Market Revenue (Million), by End User 2024 & 2032
- Figure 84: Rest of the World Restriction Nucleases Market Volume (K Unit), by End User 2024 & 2032
- Figure 85: Rest of the World Restriction Nucleases Market Revenue Share (%), by End User 2024 & 2032
- Figure 86: Rest of the World Restriction Nucleases Market Volume Share (%), by End User 2024 & 2032
- Figure 87: Rest of the World Restriction Nucleases Market Revenue (Million), by Country 2024 & 2032
- Figure 88: Rest of the World Restriction Nucleases Market Volume (K Unit), by Country 2024 & 2032
- Figure 89: Rest of the World Restriction Nucleases Market Revenue Share (%), by Country 2024 & 2032
- Figure 90: Rest of the World Restriction Nucleases Market Volume Share (%), by Country 2024 & 2032
List of Tables
- Table 1: Global Restriction Nucleases Market Revenue Million Forecast, by Region 2019 & 2032
- Table 2: Global Restriction Nucleases Market Volume K Unit Forecast, by Region 2019 & 2032
- Table 3: Global Restriction Nucleases Market Revenue Million Forecast, by Type 2019 & 2032
- Table 4: Global Restriction Nucleases Market Volume K Unit Forecast, by Type 2019 & 2032
- Table 5: Global Restriction Nucleases Market Revenue Million Forecast, by Application 2019 & 2032
- Table 6: Global Restriction Nucleases Market Volume K Unit Forecast, by Application 2019 & 2032
- Table 7: Global Restriction Nucleases Market Revenue Million Forecast, by End User 2019 & 2032
- Table 8: Global Restriction Nucleases Market Volume K Unit Forecast, by End User 2019 & 2032
- Table 9: Global Restriction Nucleases Market Revenue Million Forecast, by Region 2019 & 2032
- Table 10: Global Restriction Nucleases Market Volume K Unit Forecast, by Region 2019 & 2032
- Table 11: Global Restriction Nucleases Market Revenue Million Forecast, by Country 2019 & 2032
- Table 12: Global Restriction Nucleases Market Volume K Unit Forecast, by Country 2019 & 2032
- Table 13: United States Restriction Nucleases Market Revenue (Million) Forecast, by Application 2019 & 2032
- Table 14: United States Restriction Nucleases Market Volume (K Unit) Forecast, by Application 2019 & 2032
- Table 15: Canada Restriction Nucleases Market Revenue (Million) Forecast, by Application 2019 & 2032
- Table 16: Canada Restriction Nucleases Market Volume (K Unit) Forecast, by Application 2019 & 2032
- Table 17: Mexico Restriction Nucleases Market Revenue (Million) Forecast, by Application 2019 & 2032
- Table 18: Mexico Restriction Nucleases Market Volume (K Unit) Forecast, by Application 2019 & 2032
- Table 19: Global Restriction Nucleases Market Revenue Million Forecast, by Country 2019 & 2032
- Table 20: Global Restriction Nucleases Market Volume K Unit Forecast, by Country 2019 & 2032
- Table 21: Germany Restriction Nucleases Market Revenue (Million) Forecast, by Application 2019 & 2032
- Table 22: Germany Restriction Nucleases Market Volume (K Unit) Forecast, by Application 2019 & 2032
- Table 23: United Kingdom Restriction Nucleases Market Revenue (Million) Forecast, by Application 2019 & 2032
- Table 24: United Kingdom Restriction Nucleases Market Volume (K Unit) Forecast, by Application 2019 & 2032
- Table 25: France Restriction Nucleases Market Revenue (Million) Forecast, by Application 2019 & 2032
- Table 26: France Restriction Nucleases Market Volume (K Unit) Forecast, by Application 2019 & 2032
- Table 27: Spain Restriction Nucleases Market Revenue (Million) Forecast, by Application 2019 & 2032
- Table 28: Spain Restriction Nucleases Market Volume (K Unit) Forecast, by Application 2019 & 2032
- Table 29: Italy Restriction Nucleases Market Revenue (Million) Forecast, by Application 2019 & 2032
- Table 30: Italy Restriction Nucleases Market Volume (K Unit) Forecast, by Application 2019 & 2032
- Table 31: Spain Restriction Nucleases Market Revenue (Million) Forecast, by Application 2019 & 2032
- Table 32: Spain Restriction Nucleases Market Volume (K Unit) Forecast, by Application 2019 & 2032
- Table 33: Belgium Restriction Nucleases Market Revenue (Million) Forecast, by Application 2019 & 2032
- Table 34: Belgium Restriction Nucleases Market Volume (K Unit) Forecast, by Application 2019 & 2032
- Table 35: Netherland Restriction Nucleases Market Revenue (Million) Forecast, by Application 2019 & 2032
- Table 36: Netherland Restriction Nucleases Market Volume (K Unit) Forecast, by Application 2019 & 2032
- Table 37: Nordics Restriction Nucleases Market Revenue (Million) Forecast, by Application 2019 & 2032
- Table 38: Nordics Restriction Nucleases Market Volume (K Unit) Forecast, by Application 2019 & 2032
- Table 39: Rest of Europe Restriction Nucleases Market Revenue (Million) Forecast, by Application 2019 & 2032
- Table 40: Rest of Europe Restriction Nucleases Market Volume (K Unit) Forecast, by Application 2019 & 2032
- Table 41: Global Restriction Nucleases Market Revenue Million Forecast, by Country 2019 & 2032
- Table 42: Global Restriction Nucleases Market Volume K Unit Forecast, by Country 2019 & 2032
- Table 43: China Restriction Nucleases Market Revenue (Million) Forecast, by Application 2019 & 2032
- Table 44: China Restriction Nucleases Market Volume (K Unit) Forecast, by Application 2019 & 2032
- Table 45: Japan Restriction Nucleases Market Revenue (Million) Forecast, by Application 2019 & 2032
- Table 46: Japan Restriction Nucleases Market Volume (K Unit) Forecast, by Application 2019 & 2032
- Table 47: India Restriction Nucleases Market Revenue (Million) Forecast, by Application 2019 & 2032
- Table 48: India Restriction Nucleases Market Volume (K Unit) Forecast, by Application 2019 & 2032
- Table 49: South Korea Restriction Nucleases Market Revenue (Million) Forecast, by Application 2019 & 2032
- Table 50: South Korea Restriction Nucleases Market Volume (K Unit) Forecast, by Application 2019 & 2032
- Table 51: Southeast Asia Restriction Nucleases Market Revenue (Million) Forecast, by Application 2019 & 2032
- Table 52: Southeast Asia Restriction Nucleases Market Volume (K Unit) Forecast, by Application 2019 & 2032
- Table 53: Australia Restriction Nucleases Market Revenue (Million) Forecast, by Application 2019 & 2032
- Table 54: Australia Restriction Nucleases Market Volume (K Unit) Forecast, by Application 2019 & 2032
- Table 55: Indonesia Restriction Nucleases Market Revenue (Million) Forecast, by Application 2019 & 2032
- Table 56: Indonesia Restriction Nucleases Market Volume (K Unit) Forecast, by Application 2019 & 2032
- Table 57: Phillipes Restriction Nucleases Market Revenue (Million) Forecast, by Application 2019 & 2032
- Table 58: Phillipes Restriction Nucleases Market Volume (K Unit) Forecast, by Application 2019 & 2032
- Table 59: Singapore Restriction Nucleases Market Revenue (Million) Forecast, by Application 2019 & 2032
- Table 60: Singapore Restriction Nucleases Market Volume (K Unit) Forecast, by Application 2019 & 2032
- Table 61: Thailandc Restriction Nucleases Market Revenue (Million) Forecast, by Application 2019 & 2032
- Table 62: Thailandc Restriction Nucleases Market Volume (K Unit) Forecast, by Application 2019 & 2032
- Table 63: Rest of Asia Pacific Restriction Nucleases Market Revenue (Million) Forecast, by Application 2019 & 2032
- Table 64: Rest of Asia Pacific Restriction Nucleases Market Volume (K Unit) Forecast, by Application 2019 & 2032
- Table 65: Global Restriction Nucleases Market Revenue Million Forecast, by Country 2019 & 2032
- Table 66: Global Restriction Nucleases Market Volume K Unit Forecast, by Country 2019 & 2032
- Table 67: Brazil Restriction Nucleases Market Revenue (Million) Forecast, by Application 2019 & 2032
- Table 68: Brazil Restriction Nucleases Market Volume (K Unit) Forecast, by Application 2019 & 2032
- Table 69: Argentina Restriction Nucleases Market Revenue (Million) Forecast, by Application 2019 & 2032
- Table 70: Argentina Restriction Nucleases Market Volume (K Unit) Forecast, by Application 2019 & 2032
- Table 71: Peru Restriction Nucleases Market Revenue (Million) Forecast, by Application 2019 & 2032
- Table 72: Peru Restriction Nucleases Market Volume (K Unit) Forecast, by Application 2019 & 2032
- Table 73: Chile Restriction Nucleases Market Revenue (Million) Forecast, by Application 2019 & 2032
- Table 74: Chile Restriction Nucleases Market Volume (K Unit) Forecast, by Application 2019 & 2032
- Table 75: Colombia Restriction Nucleases Market Revenue (Million) Forecast, by Application 2019 & 2032
- Table 76: Colombia Restriction Nucleases Market Volume (K Unit) Forecast, by Application 2019 & 2032
- Table 77: Ecuador Restriction Nucleases Market Revenue (Million) Forecast, by Application 2019 & 2032
- Table 78: Ecuador Restriction Nucleases Market Volume (K Unit) Forecast, by Application 2019 & 2032
- Table 79: Venezuela Restriction Nucleases Market Revenue (Million) Forecast, by Application 2019 & 2032
- Table 80: Venezuela Restriction Nucleases Market Volume (K Unit) Forecast, by Application 2019 & 2032
- Table 81: Rest of South America Restriction Nucleases Market Revenue (Million) Forecast, by Application 2019 & 2032
- Table 82: Rest of South America Restriction Nucleases Market Volume (K Unit) Forecast, by Application 2019 & 2032
- Table 83: Global Restriction Nucleases Market Revenue Million Forecast, by Country 2019 & 2032
- Table 84: Global Restriction Nucleases Market Volume K Unit Forecast, by Country 2019 & 2032
- Table 85: United States Restriction Nucleases Market Revenue (Million) Forecast, by Application 2019 & 2032
- Table 86: United States Restriction Nucleases Market Volume (K Unit) Forecast, by Application 2019 & 2032
- Table 87: Canada Restriction Nucleases Market Revenue (Million) Forecast, by Application 2019 & 2032
- Table 88: Canada Restriction Nucleases Market Volume (K Unit) Forecast, by Application 2019 & 2032
- Table 89: Mexico Restriction Nucleases Market Revenue (Million) Forecast, by Application 2019 & 2032
- Table 90: Mexico Restriction Nucleases Market Volume (K Unit) Forecast, by Application 2019 & 2032
- Table 91: Global Restriction Nucleases Market Revenue Million Forecast, by Country 2019 & 2032
- Table 92: Global Restriction Nucleases Market Volume K Unit Forecast, by Country 2019 & 2032
- Table 93: United Arab Emirates Restriction Nucleases Market Revenue (Million) Forecast, by Application 2019 & 2032
- Table 94: United Arab Emirates Restriction Nucleases Market Volume (K Unit) Forecast, by Application 2019 & 2032
- Table 95: Saudi Arabia Restriction Nucleases Market Revenue (Million) Forecast, by Application 2019 & 2032
- Table 96: Saudi Arabia Restriction Nucleases Market Volume (K Unit) Forecast, by Application 2019 & 2032
- Table 97: South Africa Restriction Nucleases Market Revenue (Million) Forecast, by Application 2019 & 2032
- Table 98: South Africa Restriction Nucleases Market Volume (K Unit) Forecast, by Application 2019 & 2032
- Table 99: Rest of Middle East and Africa Restriction Nucleases Market Revenue (Million) Forecast, by Application 2019 & 2032
- Table 100: Rest of Middle East and Africa Restriction Nucleases Market Volume (K Unit) Forecast, by Application 2019 & 2032
- Table 101: Global Restriction Nucleases Market Revenue Million Forecast, by Type 2019 & 2032
- Table 102: Global Restriction Nucleases Market Volume K Unit Forecast, by Type 2019 & 2032
- Table 103: Global Restriction Nucleases Market Revenue Million Forecast, by Application 2019 & 2032
- Table 104: Global Restriction Nucleases Market Volume K Unit Forecast, by Application 2019 & 2032
- Table 105: Global Restriction Nucleases Market Revenue Million Forecast, by End User 2019 & 2032
- Table 106: Global Restriction Nucleases Market Volume K Unit Forecast, by End User 2019 & 2032
- Table 107: Global Restriction Nucleases Market Revenue Million Forecast, by Country 2019 & 2032
- Table 108: Global Restriction Nucleases Market Volume K Unit Forecast, by Country 2019 & 2032
- Table 109: United States Restriction Nucleases Market Revenue (Million) Forecast, by Application 2019 & 2032
- Table 110: United States Restriction Nucleases Market Volume (K Unit) Forecast, by Application 2019 & 2032
- Table 111: Canada Restriction Nucleases Market Revenue (Million) Forecast, by Application 2019 & 2032
- Table 112: Canada Restriction Nucleases Market Volume (K Unit) Forecast, by Application 2019 & 2032
- Table 113: Mexico Restriction Nucleases Market Revenue (Million) Forecast, by Application 2019 & 2032
- Table 114: Mexico Restriction Nucleases Market Volume (K Unit) Forecast, by Application 2019 & 2032
- Table 115: Global Restriction Nucleases Market Revenue Million Forecast, by Type 2019 & 2032
- Table 116: Global Restriction Nucleases Market Volume K Unit Forecast, by Type 2019 & 2032
- Table 117: Global Restriction Nucleases Market Revenue Million Forecast, by Application 2019 & 2032
- Table 118: Global Restriction Nucleases Market Volume K Unit Forecast, by Application 2019 & 2032
- Table 119: Global Restriction Nucleases Market Revenue Million Forecast, by End User 2019 & 2032
- Table 120: Global Restriction Nucleases Market Volume K Unit Forecast, by End User 2019 & 2032
- Table 121: Global Restriction Nucleases Market Revenue Million Forecast, by Country 2019 & 2032
- Table 122: Global Restriction Nucleases Market Volume K Unit Forecast, by Country 2019 & 2032
- Table 123: Germany Restriction Nucleases Market Revenue (Million) Forecast, by Application 2019 & 2032
- Table 124: Germany Restriction Nucleases Market Volume (K Unit) Forecast, by Application 2019 & 2032
- Table 125: United Kingdom Restriction Nucleases Market Revenue (Million) Forecast, by Application 2019 & 2032
- Table 126: United Kingdom Restriction Nucleases Market Volume (K Unit) Forecast, by Application 2019 & 2032
- Table 127: France Restriction Nucleases Market Revenue (Million) Forecast, by Application 2019 & 2032
- Table 128: France Restriction Nucleases Market Volume (K Unit) Forecast, by Application 2019 & 2032
- Table 129: Italy Restriction Nucleases Market Revenue (Million) Forecast, by Application 2019 & 2032
- Table 130: Italy Restriction Nucleases Market Volume (K Unit) Forecast, by Application 2019 & 2032
- Table 131: Spain Restriction Nucleases Market Revenue (Million) Forecast, by Application 2019 & 2032
- Table 132: Spain Restriction Nucleases Market Volume (K Unit) Forecast, by Application 2019 & 2032
- Table 133: Rest of Europe Restriction Nucleases Market Revenue (Million) Forecast, by Application 2019 & 2032
- Table 134: Rest of Europe Restriction Nucleases Market Volume (K Unit) Forecast, by Application 2019 & 2032
- Table 135: Global Restriction Nucleases Market Revenue Million Forecast, by Type 2019 & 2032
- Table 136: Global Restriction Nucleases Market Volume K Unit Forecast, by Type 2019 & 2032
- Table 137: Global Restriction Nucleases Market Revenue Million Forecast, by Application 2019 & 2032
- Table 138: Global Restriction Nucleases Market Volume K Unit Forecast, by Application 2019 & 2032
- Table 139: Global Restriction Nucleases Market Revenue Million Forecast, by End User 2019 & 2032
- Table 140: Global Restriction Nucleases Market Volume K Unit Forecast, by End User 2019 & 2032
- Table 141: Global Restriction Nucleases Market Revenue Million Forecast, by Country 2019 & 2032
- Table 142: Global Restriction Nucleases Market Volume K Unit Forecast, by Country 2019 & 2032
- Table 143: China Restriction Nucleases Market Revenue (Million) Forecast, by Application 2019 & 2032
- Table 144: China Restriction Nucleases Market Volume (K Unit) Forecast, by Application 2019 & 2032
- Table 145: Japan Restriction Nucleases Market Revenue (Million) Forecast, by Application 2019 & 2032
- Table 146: Japan Restriction Nucleases Market Volume (K Unit) Forecast, by Application 2019 & 2032
- Table 147: India Restriction Nucleases Market Revenue (Million) Forecast, by Application 2019 & 2032
- Table 148: India Restriction Nucleases Market Volume (K Unit) Forecast, by Application 2019 & 2032
- Table 149: Australia Restriction Nucleases Market Revenue (Million) Forecast, by Application 2019 & 2032
- Table 150: Australia Restriction Nucleases Market Volume (K Unit) Forecast, by Application 2019 & 2032
- Table 151: South Korea Restriction Nucleases Market Revenue (Million) Forecast, by Application 2019 & 2032
- Table 152: South Korea Restriction Nucleases Market Volume (K Unit) Forecast, by Application 2019 & 2032
- Table 153: Rest of Asia Pacific Restriction Nucleases Market Revenue (Million) Forecast, by Application 2019 & 2032
- Table 154: Rest of Asia Pacific Restriction Nucleases Market Volume (K Unit) Forecast, by Application 2019 & 2032
- Table 155: Global Restriction Nucleases Market Revenue Million Forecast, by Type 2019 & 2032
- Table 156: Global Restriction Nucleases Market Volume K Unit Forecast, by Type 2019 & 2032
- Table 157: Global Restriction Nucleases Market Revenue Million Forecast, by Application 2019 & 2032
- Table 158: Global Restriction Nucleases Market Volume K Unit Forecast, by Application 2019 & 2032
- Table 159: Global Restriction Nucleases Market Revenue Million Forecast, by End User 2019 & 2032
- Table 160: Global Restriction Nucleases Market Volume K Unit Forecast, by End User 2019 & 2032
- Table 161: Global Restriction Nucleases Market Revenue Million Forecast, by Country 2019 & 2032
- Table 162: Global Restriction Nucleases Market Volume K Unit Forecast, by Country 2019 & 2032
Frequently Asked Questions
1. What is the projected Compound Annual Growth Rate (CAGR) of the Restriction Nucleases Market?
The projected CAGR is approximately 6.67%.
2. Which companies are prominent players in the Restriction Nucleases Market?
Key companies in the market include Promega Corporation, QIAGEN NV, Merck KGaA, New England Biolabs, TransGen Biotech Co Ltd , Takara Bio Inc, GenScript, Illumina Inc, Thermo Fisher Scientific, Agilent Technologies.
3. What are the main segments of the Restriction Nucleases Market?
The market segments include Type, Application, End User.
4. Can you provide details about the market size?
The market size is estimated to be USD 308.38 Million as of 2022.
5. What are some drivers contributing to market growth?
Rising Use of Restriction Endonucleases in Various Applications; Increasing Expenditure on Research and Development by Biotechnology and Pharmaceutical Companies..
6. What are the notable trends driving market growth?
Genetic Engineering is Expected to Hold a Significant Market Share Over the Forecast Period.
7. Are there any restraints impacting market growth?
High Cost Restriction Endonucleases Production.
8. Can you provide examples of recent developments in the market?
August 2022: Diagnostics and research startup MedGenome raised USD 50.0 million led by life science-focused Novo Holdings. The company uses genomic sequencing platforms to aid in diagnostics and drug discovery. The genomic sequencing drug discovery deploys the use of restriction endonucleases.
9. What pricing options are available for accessing the report?
Pricing options include single-user, multi-user, and enterprise licenses priced at USD 4750, USD 5250, and USD 8750 respectively.
10. Is the market size provided in terms of value or volume?
The market size is provided in terms of value, measured in Million and volume, measured in K Unit.
11. Are there any specific market keywords associated with the report?
Yes, the market keyword associated with the report is "Restriction Nucleases Market," which aids in identifying and referencing the specific market segment covered.
12. How do I determine which pricing option suits my needs best?
The pricing options vary based on user requirements and access needs. Individual users may opt for single-user licenses, while businesses requiring broader access may choose multi-user or enterprise licenses for cost-effective access to the report.
13. Are there any additional resources or data provided in the Restriction Nucleases Market report?
While the report offers comprehensive insights, it's advisable to review the specific contents or supplementary materials provided to ascertain if additional resources or data are available.
14. How can I stay updated on further developments or reports in the Restriction Nucleases Market?
To stay informed about further developments, trends, and reports in the Restriction Nucleases Market, consider subscribing to industry newsletters, following relevant companies and organizations, or regularly checking reputable industry news sources and publications.
Methodology
Step 1 - Identification of Relevant Samples Size from Population Database


Step 2 - Approaches for Defining Global Market Size (Value, Volume* & Price*)

Note*: In applicable scenarios
Step 3 - Data Sources
Primary Research
- Web Analytics
- Survey Reports
- Research Institute
- Latest Research Reports
- Opinion Leaders
Secondary Research
- Annual Reports
- White Paper
- Latest Press Release
- Industry Association
- Paid Database
- Investor Presentations

Step 4 - Data Triangulation
Involves using different sources of information in order to increase the validity of a study
These sources are likely to be stakeholders in a program - participants, other researchers, program staff, other community members, and so on.
Then we put all data in single framework & apply various statistical tools to find out the dynamic on the market.
During the analysis stage, feedback from the stakeholder groups would be compared to determine areas of agreement as well as areas of divergence


