
Key Insights
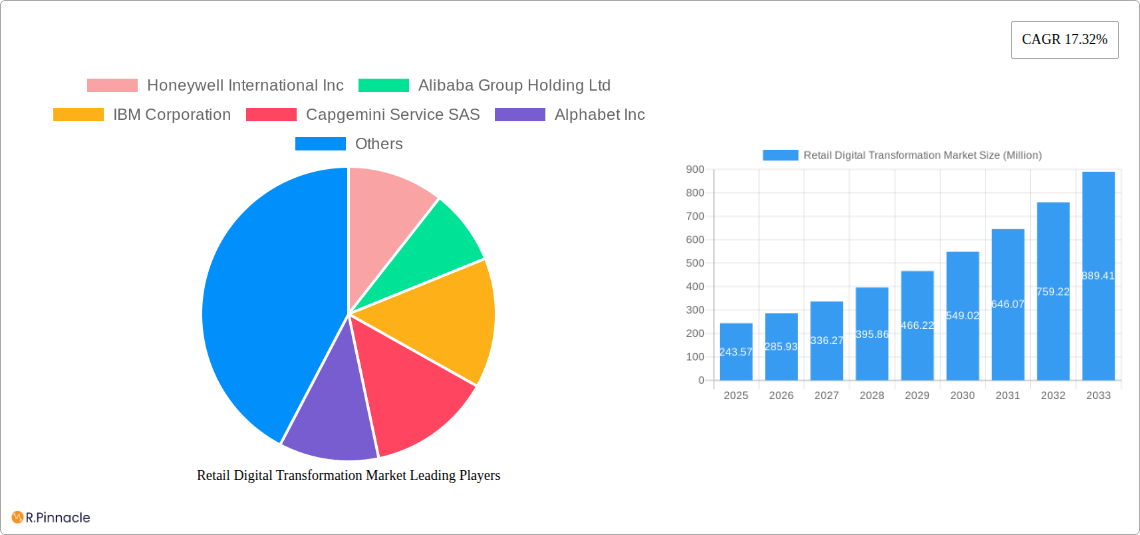
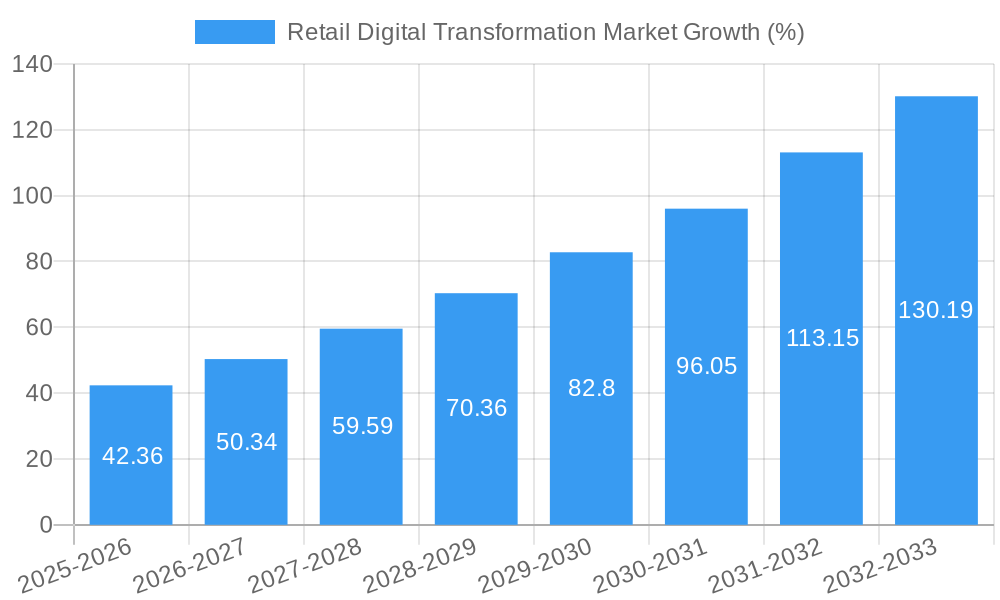
The global Retail Digital Transformation market, valued at $243.57 million in 2025, is projected to experience robust growth, driven by a Compound Annual Growth Rate (CAGR) of 17.32% from 2025 to 2033. This expansion is fueled by several key factors. The increasing adoption of e-commerce, omnichannel strategies, and personalized customer experiences is fundamentally reshaping retail operations. Businesses are investing heavily in technologies like cloud computing, artificial intelligence (AI), and the Internet of Things (IoT) to enhance supply chain efficiency, optimize inventory management, and improve customer engagement. The rise of mobile applications and user-friendly websites further contributes to this transformation, empowering consumers with seamless online shopping experiences. Growth is also spurred by the increasing demand for data-driven insights, allowing retailers to better understand customer preferences and tailor their offerings accordingly. Competition among retailers is fierce, further accelerating the adoption of digital technologies as a crucial differentiator. While data security concerns and the need for substantial upfront investment represent potential restraints, the long-term benefits of improved efficiency, increased sales, and enhanced customer loyalty outweigh these challenges.
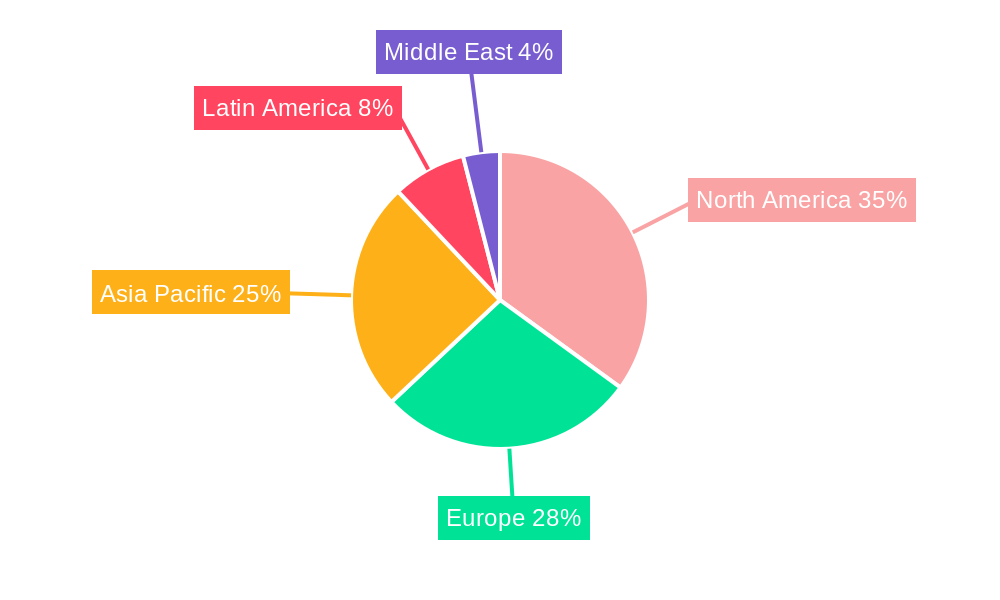
Significant regional variations are expected. North America, with its established digital infrastructure and high consumer adoption rates, is likely to maintain a leading market share. However, rapid growth is anticipated in the Asia-Pacific region, driven by the expanding middle class, rising smartphone penetration, and increasing internet access. Europe will also see considerable growth, albeit at a potentially slower pace than the Asia-Pacific region, due to varying levels of digital adoption across different countries. The Retail Digital Transformation market is segmented by product (consumer electronics, apparel, food and beverage, etc.), technology (cloud computing, AI, IoT, etc.), and accessibility (mobile apps, websites), reflecting the multifaceted nature of this transformation and the diverse technological solutions employed. The competitive landscape is characterized by a mix of established technology companies like IBM, Amazon, and Accenture, and retail giants such as Alibaba and Flipkart, all vying for a stake in this rapidly evolving market.
Retail Digital Transformation Market: A Comprehensive Report (2019-2033)
This in-depth report provides a comprehensive analysis of the Retail Digital Transformation Market, offering invaluable insights for industry professionals, investors, and strategists. With a study period spanning 2019-2033, a base year of 2025, and a forecast period of 2025-2033, this report leverages extensive data analysis to illuminate market trends, growth drivers, and challenges. The market is segmented by product, technology, and accessibility, revealing key opportunities across various retail sectors. The report features analysis of leading players like Honeywell International Inc, Alibaba Group Holding Ltd, IBM Corporation, and more, providing a 360° view of this dynamic market. Expected market value in 2025 is estimated at XX Million.
Retail Digital Transformation Market Market Structure & Innovation Trends
The Retail Digital Transformation Market exhibits a moderately consolidated structure, with several large players holding significant market share. However, the market also features numerous smaller, niche players contributing to innovation and competition. Market share analysis reveals that the top 5 players collectively hold approximately xx% of the market, with the remaining xx% distributed amongst smaller companies. The total M&A deal value in the sector during the historical period (2019-2024) reached an estimated xx Million, indicating a dynamic landscape of consolidation and growth.
Key Market Structure Aspects:
- High level of innovation driven by technological advancements (AI, cloud computing, IoT)
- Stringent regulatory frameworks impacting data privacy and security
- Emergence of product substitutes (e.g., direct-to-consumer brands)
- Shifting end-user demographics favoring digital channels
- Increased M&A activity aiming at expanding market reach and capabilities
Retail Digital Transformation Market Market Dynamics & Trends
The Retail Digital Transformation Market is experiencing rapid growth, driven by several key factors. The Compound Annual Growth Rate (CAGR) during the forecast period (2025-2033) is projected to be xx%, fueled by increasing consumer adoption of digital channels and the ongoing technological disruptions within the retail sector. Market penetration of digital technologies in retail is expected to reach xx% by 2033, significantly impacting traditional business models.
Market Dynamics:
- Significant growth drivers: rising e-commerce adoption, omnichannel strategies, and personalized customer experiences.
- Technological disruptions: advancements in AI, Big Data, and IoT are transforming retail operations and customer engagement.
- Evolving consumer preferences: consumers increasingly demand seamless digital experiences, personalized offers, and convenient delivery options.
- Intense competitive dynamics: existing retailers are aggressively investing in digital transformation, while new entrants with purely digital business models are challenging the status quo.
Dominant Regions & Segments in Retail Digital Transformation Market
The North American region currently holds the largest market share in the Retail Digital Transformation Market, driven by high levels of technological adoption, robust infrastructure, and favorable economic conditions. However, the Asia-Pacific region is projected to witness the fastest growth during the forecast period, fueled by rapid economic growth and expanding e-commerce penetration.
Key Drivers by Region and Segment:
- North America: Strong technological infrastructure, high disposable income, and early adoption of digital technologies.
- Asia-Pacific: Rapid economic growth, expanding middle class, and increasing smartphone penetration.
- Europe: Established e-commerce markets, supportive regulatory frameworks, and increasing focus on sustainability.
Dominant Segments:
- By Product: Consumer Electronics shows strong growth due to high online sales and digital engagement.
- By Technology: Cloud Computing leads the technology segment due to its scalability and cost-effectiveness.
- By Accessibility: Mobile Applications are dominating due to the convenience and accessibility they offer.
Retail Digital Transformation Market Product Innovations
Recent product innovations focus on enhancing customer experience through personalized recommendations, seamless omnichannel integration, and advanced analytics for better inventory management. These innovations leverage technologies like AI, AR/VR, and IoT to create immersive shopping experiences and improve operational efficiency. The integration of cloud-based platforms and big data analytics is also driving significant innovations in supply chain optimization and fraud detection.
Report Scope & Segmentation Analysis
This report comprehensively analyzes the Retail Digital Transformation Market across various segments.
By Product: Consumer Electronics, Media and Entertainment, Apparel, Food and Beverage, Furniture and Home Decor, Beauty and Personal Care, Other Products. Each segment displays unique growth trajectories reflecting individual consumer preferences and technological adaptability. Market size projections and competitive landscapes vary widely across these product categories.
By Technology: Cloud computing, Big data, AI, IoT, AR/VR. Each technology segment contributes uniquely to the overall digital transformation, influencing market size and growth rate differentially.
By Accessibility: Mobile Application, Website. The market is split based on access points, reflecting the evolving consumer preference for mobile-first experiences.
Key Drivers of Retail Digital Transformation Market Growth
Several factors drive the growth of the Retail Digital Transformation Market:
- Technological advancements: AI, big data, and IoT offer significant opportunities for enhancing efficiency and customer experience.
- Economic growth: Rising disposable incomes and expanding middle classes fuel increased spending on retail products and services.
- Favorable government regulations: Supportive policies encouraging digital adoption accelerate market growth.
Challenges in the Retail Digital Transformation Market Sector
Challenges include:
- High initial investment costs for digital transformation initiatives, particularly for smaller retailers.
- Concerns regarding data security and privacy, requiring robust cybersecurity measures.
- The need for skilled personnel to manage and maintain complex digital systems. This skills gap is estimated to cost the sector xx Million annually.
Emerging Opportunities in Retail Digital Transformation Market
Emerging opportunities include:
- Expansion into new markets with high growth potential (e.g., emerging economies).
- Adoption of advanced technologies such as AR/VR and blockchain for improved customer engagement and supply chain transparency.
- Development of personalized shopping experiences leveraging AI and data analytics.
Leading Players in the Retail Digital Transformation Market Market
- Honeywell International Inc
- Alibaba Group Holding Ltd
- IBM Corporation
- Capgemini Service SAS
- Alphabet Inc
- Accenture Plc
- Amazon com Inc
- Oracle Corporation
- Flipkart Inc
- SAP SE
Key Developments in Retail Digital Transformation Market Industry
- January 2022: Toshiba Global Commerce Systems launched a new integrated commerce platform to accelerate retailer digital transformation.
- March 2022: Informatica introduced the Intelligent Data Management Cloud (IDMC) for retail, addressing data fragmentation and complexity.
- April 2022: Primark launched its website, a significant step in its digital strategy.
- June 2022: HCL Technologies launched Industry NeXT, a framework for digital enterprise reinvention.
- September 2022: Boots announced a new online store as part of its digital transformation strategy.
Future Outlook for Retail Digital Transformation Market Market
The Retail Digital Transformation Market is poised for continued growth, driven by technological innovation, evolving consumer preferences, and increasing investment in digital infrastructure. Strategic opportunities exist for retailers to leverage AI, big data, and other emerging technologies to create personalized experiences, optimize operations, and gain a competitive edge. The market is expected to reach XX Million by 2033.
Retail Digital Transformation Market Segmentation
-
1. Accesibility
- 1.1. Mobile Application
- 1.2. Website
-
2. Product
- 2.1. Consumer Electronics
- 2.2. Media and Entertainment
- 2.3. Apparel
- 2.4. Food and Beverage
- 2.5. Furniture and Home Decor
- 2.6. Beauty and Personal Care
- 2.7. Other Products
-
3. Technology
- 3.1. Cloud computing
- 3.2. Big data
- 3.3. AI
- 3.4. IoT
- 3.5. AR/VR
Retail Digital Transformation Market Segmentation By Geography
-
1. North America
- 1.1. United States
- 1.2. Canada
-
2. Europe
- 2.1. United Kingdom
- 2.2. France
- 2.3. Germany
- 2.4. Rest of Europe
-
3. Asia Pacific
- 3.1. China
- 3.2. Japan
- 3.3. India
- 3.4. Rest of Asia Pacific
-
4. Latin America
- 4.1. Mexico
- 4.2. Brazil
- 4.3. Argentina
- 4.4. Rest of Latin America
- 5. Middle East
-
6. United Arab Emirates
- 6.1. Saudi Arabia
- 6.2. Rest of Middle East
Retail Digital Transformation Market REPORT HIGHLIGHTS
| Aspects | Details |
|---|---|
| Study Period | 2019-2033 |
| Base Year | 2024 |
| Estimated Year | 2025 |
| Forecast Period | 2025-2033 |
| Historical Period | 2019-2024 |
| Growth Rate | CAGR of 17.32% from 2019-2033 |
| Segmentation |
|
Table of Contents
- 1. Introduction
- 1.1. Research Scope
- 1.2. Market Segmentation
- 1.3. Research Methodology
- 1.4. Definitions and Assumptions
- 2. Executive Summary
- 2.1. Introduction
- 3. Market Dynamics
- 3.1. Introduction
- 3.2. Market Drivers
- 3.2.1. Increased Usage of Smart Devices; Growing Need for Advanced Mobile Logistics Management; Demand for Increase in the Yield and Efficiency
- 3.3. Market Restrains
- 3.3.1. Lack of General Awareness and Expertise in Emerging Regions; Standardization and Integration Issues
- 3.4. Market Trends
- 3.4.1. Beauty and Personal Care to Hold Significant Share
- 4. Market Factor Analysis
- 4.1. Porters Five Forces
- 4.2. Supply/Value Chain
- 4.3. PESTEL analysis
- 4.4. Market Entropy
- 4.5. Patent/Trademark Analysis
- 5. Global Retail Digital Transformation Market Analysis, Insights and Forecast, 2019-2031
- 5.1. Market Analysis, Insights and Forecast - by Accesibility
- 5.1.1. Mobile Application
- 5.1.2. Website
- 5.2. Market Analysis, Insights and Forecast - by Product
- 5.2.1. Consumer Electronics
- 5.2.2. Media and Entertainment
- 5.2.3. Apparel
- 5.2.4. Food and Beverage
- 5.2.5. Furniture and Home Decor
- 5.2.6. Beauty and Personal Care
- 5.2.7. Other Products
- 5.3. Market Analysis, Insights and Forecast - by Technology
- 5.3.1. Cloud computing
- 5.3.2. Big data
- 5.3.3. AI
- 5.3.4. IoT
- 5.3.5. AR/VR
- 5.4. Market Analysis, Insights and Forecast - by Region
- 5.4.1. North America
- 5.4.2. Europe
- 5.4.3. Asia Pacific
- 5.4.4. Latin America
- 5.4.5. Middle East
- 5.4.6. United Arab Emirates
- 5.1. Market Analysis, Insights and Forecast - by Accesibility
- 6. North America Retail Digital Transformation Market Analysis, Insights and Forecast, 2019-2031
- 6.1. Market Analysis, Insights and Forecast - by Accesibility
- 6.1.1. Mobile Application
- 6.1.2. Website
- 6.2. Market Analysis, Insights and Forecast - by Product
- 6.2.1. Consumer Electronics
- 6.2.2. Media and Entertainment
- 6.2.3. Apparel
- 6.2.4. Food and Beverage
- 6.2.5. Furniture and Home Decor
- 6.2.6. Beauty and Personal Care
- 6.2.7. Other Products
- 6.3. Market Analysis, Insights and Forecast - by Technology
- 6.3.1. Cloud computing
- 6.3.2. Big data
- 6.3.3. AI
- 6.3.4. IoT
- 6.3.5. AR/VR
- 6.1. Market Analysis, Insights and Forecast - by Accesibility
- 7. Europe Retail Digital Transformation Market Analysis, Insights and Forecast, 2019-2031
- 7.1. Market Analysis, Insights and Forecast - by Accesibility
- 7.1.1. Mobile Application
- 7.1.2. Website
- 7.2. Market Analysis, Insights and Forecast - by Product
- 7.2.1. Consumer Electronics
- 7.2.2. Media and Entertainment
- 7.2.3. Apparel
- 7.2.4. Food and Beverage
- 7.2.5. Furniture and Home Decor
- 7.2.6. Beauty and Personal Care
- 7.2.7. Other Products
- 7.3. Market Analysis, Insights and Forecast - by Technology
- 7.3.1. Cloud computing
- 7.3.2. Big data
- 7.3.3. AI
- 7.3.4. IoT
- 7.3.5. AR/VR
- 7.1. Market Analysis, Insights and Forecast - by Accesibility
- 8. Asia Pacific Retail Digital Transformation Market Analysis, Insights and Forecast, 2019-2031
- 8.1. Market Analysis, Insights and Forecast - by Accesibility
- 8.1.1. Mobile Application
- 8.1.2. Website
- 8.2. Market Analysis, Insights and Forecast - by Product
- 8.2.1. Consumer Electronics
- 8.2.2. Media and Entertainment
- 8.2.3. Apparel
- 8.2.4. Food and Beverage
- 8.2.5. Furniture and Home Decor
- 8.2.6. Beauty and Personal Care
- 8.2.7. Other Products
- 8.3. Market Analysis, Insights and Forecast - by Technology
- 8.3.1. Cloud computing
- 8.3.2. Big data
- 8.3.3. AI
- 8.3.4. IoT
- 8.3.5. AR/VR
- 8.1. Market Analysis, Insights and Forecast - by Accesibility
- 9. Latin America Retail Digital Transformation Market Analysis, Insights and Forecast, 2019-2031
- 9.1. Market Analysis, Insights and Forecast - by Accesibility
- 9.1.1. Mobile Application
- 9.1.2. Website
- 9.2. Market Analysis, Insights and Forecast - by Product
- 9.2.1. Consumer Electronics
- 9.2.2. Media and Entertainment
- 9.2.3. Apparel
- 9.2.4. Food and Beverage
- 9.2.5. Furniture and Home Decor
- 9.2.6. Beauty and Personal Care
- 9.2.7. Other Products
- 9.3. Market Analysis, Insights and Forecast - by Technology
- 9.3.1. Cloud computing
- 9.3.2. Big data
- 9.3.3. AI
- 9.3.4. IoT
- 9.3.5. AR/VR
- 9.1. Market Analysis, Insights and Forecast - by Accesibility
- 10. Middle East Retail Digital Transformation Market Analysis, Insights and Forecast, 2019-2031
- 10.1. Market Analysis, Insights and Forecast - by Accesibility
- 10.1.1. Mobile Application
- 10.1.2. Website
- 10.2. Market Analysis, Insights and Forecast - by Product
- 10.2.1. Consumer Electronics
- 10.2.2. Media and Entertainment
- 10.2.3. Apparel
- 10.2.4. Food and Beverage
- 10.2.5. Furniture and Home Decor
- 10.2.6. Beauty and Personal Care
- 10.2.7. Other Products
- 10.3. Market Analysis, Insights and Forecast - by Technology
- 10.3.1. Cloud computing
- 10.3.2. Big data
- 10.3.3. AI
- 10.3.4. IoT
- 10.3.5. AR/VR
- 10.1. Market Analysis, Insights and Forecast - by Accesibility
- 11. United Arab Emirates Retail Digital Transformation Market Analysis, Insights and Forecast, 2019-2031
- 11.1. Market Analysis, Insights and Forecast - by Accesibility
- 11.1.1. Mobile Application
- 11.1.2. Website
- 11.2. Market Analysis, Insights and Forecast - by Product
- 11.2.1. Consumer Electronics
- 11.2.2. Media and Entertainment
- 11.2.3. Apparel
- 11.2.4. Food and Beverage
- 11.2.5. Furniture and Home Decor
- 11.2.6. Beauty and Personal Care
- 11.2.7. Other Products
- 11.3. Market Analysis, Insights and Forecast - by Technology
- 11.3.1. Cloud computing
- 11.3.2. Big data
- 11.3.3. AI
- 11.3.4. IoT
- 11.3.5. AR/VR
- 11.1. Market Analysis, Insights and Forecast - by Accesibility
- 12. North America Retail Digital Transformation Market Analysis, Insights and Forecast, 2019-2031
- 12.1. Market Analysis, Insights and Forecast - By Country/Sub-region
- 12.1.1 United States
- 12.1.2 Canada
- 13. Europe Retail Digital Transformation Market Analysis, Insights and Forecast, 2019-2031
- 13.1. Market Analysis, Insights and Forecast - By Country/Sub-region
- 13.1.1 United Kingdom
- 13.1.2 France
- 13.1.3 Germany
- 13.1.4 Rest of Europe
- 14. Asia Pacific Retail Digital Transformation Market Analysis, Insights and Forecast, 2019-2031
- 14.1. Market Analysis, Insights and Forecast - By Country/Sub-region
- 14.1.1 China
- 14.1.2 Japan
- 14.1.3 India
- 14.1.4 Rest of Asia Pacific
- 15. Latin America Retail Digital Transformation Market Analysis, Insights and Forecast, 2019-2031
- 15.1. Market Analysis, Insights and Forecast - By Country/Sub-region
- 15.1.1 Mexico
- 15.1.2 Brazil
- 15.1.3 Argentina
- 15.1.4 Rest of Latin America
- 16. Middle East Retail Digital Transformation Market Analysis, Insights and Forecast, 2019-2031
- 16.1. Market Analysis, Insights and Forecast - By Country/Sub-region
- 16.1.1.
- 17. United Arab Emirates Retail Digital Transformation Market Analysis, Insights and Forecast, 2019-2031
- 17.1. Market Analysis, Insights and Forecast - By Country/Sub-region
- 17.1.1 Saudi Arabia
- 17.1.2 Rest of Middle East
- 18. Competitive Analysis
- 18.1. Global Market Share Analysis 2024
- 18.2. Company Profiles
- 18.2.1 Honeywell International Inc
- 18.2.1.1. Overview
- 18.2.1.2. Products
- 18.2.1.3. SWOT Analysis
- 18.2.1.4. Recent Developments
- 18.2.1.5. Financials (Based on Availability)
- 18.2.2 Alibaba Group Holding Ltd
- 18.2.2.1. Overview
- 18.2.2.2. Products
- 18.2.2.3. SWOT Analysis
- 18.2.2.4. Recent Developments
- 18.2.2.5. Financials (Based on Availability)
- 18.2.3 IBM Corporation
- 18.2.3.1. Overview
- 18.2.3.2. Products
- 18.2.3.3. SWOT Analysis
- 18.2.3.4. Recent Developments
- 18.2.3.5. Financials (Based on Availability)
- 18.2.4 Capgemini Service SAS
- 18.2.4.1. Overview
- 18.2.4.2. Products
- 18.2.4.3. SWOT Analysis
- 18.2.4.4. Recent Developments
- 18.2.4.5. Financials (Based on Availability)
- 18.2.5 Alphabet Inc
- 18.2.5.1. Overview
- 18.2.5.2. Products
- 18.2.5.3. SWOT Analysis
- 18.2.5.4. Recent Developments
- 18.2.5.5. Financials (Based on Availability)
- 18.2.6 Accenture Plc
- 18.2.6.1. Overview
- 18.2.6.2. Products
- 18.2.6.3. SWOT Analysis
- 18.2.6.4. Recent Developments
- 18.2.6.5. Financials (Based on Availability)
- 18.2.7 Amazon com Inc *List Not Exhaustive
- 18.2.7.1. Overview
- 18.2.7.2. Products
- 18.2.7.3. SWOT Analysis
- 18.2.7.4. Recent Developments
- 18.2.7.5. Financials (Based on Availability)
- 18.2.8 Oracle Corporation
- 18.2.8.1. Overview
- 18.2.8.2. Products
- 18.2.8.3. SWOT Analysis
- 18.2.8.4. Recent Developments
- 18.2.8.5. Financials (Based on Availability)
- 18.2.9 Flipkart Inc
- 18.2.9.1. Overview
- 18.2.9.2. Products
- 18.2.9.3. SWOT Analysis
- 18.2.9.4. Recent Developments
- 18.2.9.5. Financials (Based on Availability)
- 18.2.10 SAP SE
- 18.2.10.1. Overview
- 18.2.10.2. Products
- 18.2.10.3. SWOT Analysis
- 18.2.10.4. Recent Developments
- 18.2.10.5. Financials (Based on Availability)
- 18.2.1 Honeywell International Inc
List of Figures
- Figure 1: Global Retail Digital Transformation Market Revenue Breakdown (Million, %) by Region 2024 & 2032
- Figure 2: North America Retail Digital Transformation Market Revenue (Million), by Country 2024 & 2032
- Figure 3: North America Retail Digital Transformation Market Revenue Share (%), by Country 2024 & 2032
- Figure 4: Europe Retail Digital Transformation Market Revenue (Million), by Country 2024 & 2032
- Figure 5: Europe Retail Digital Transformation Market Revenue Share (%), by Country 2024 & 2032
- Figure 6: Asia Pacific Retail Digital Transformation Market Revenue (Million), by Country 2024 & 2032
- Figure 7: Asia Pacific Retail Digital Transformation Market Revenue Share (%), by Country 2024 & 2032
- Figure 8: Latin America Retail Digital Transformation Market Revenue (Million), by Country 2024 & 2032
- Figure 9: Latin America Retail Digital Transformation Market Revenue Share (%), by Country 2024 & 2032
- Figure 10: Middle East Retail Digital Transformation Market Revenue (Million), by Country 2024 & 2032
- Figure 11: Middle East Retail Digital Transformation Market Revenue Share (%), by Country 2024 & 2032
- Figure 12: United Arab Emirates Retail Digital Transformation Market Revenue (Million), by Country 2024 & 2032
- Figure 13: United Arab Emirates Retail Digital Transformation Market Revenue Share (%), by Country 2024 & 2032
- Figure 14: North America Retail Digital Transformation Market Revenue (Million), by Accesibility 2024 & 2032
- Figure 15: North America Retail Digital Transformation Market Revenue Share (%), by Accesibility 2024 & 2032
- Figure 16: North America Retail Digital Transformation Market Revenue (Million), by Product 2024 & 2032
- Figure 17: North America Retail Digital Transformation Market Revenue Share (%), by Product 2024 & 2032
- Figure 18: North America Retail Digital Transformation Market Revenue (Million), by Technology 2024 & 2032
- Figure 19: North America Retail Digital Transformation Market Revenue Share (%), by Technology 2024 & 2032
- Figure 20: North America Retail Digital Transformation Market Revenue (Million), by Country 2024 & 2032
- Figure 21: North America Retail Digital Transformation Market Revenue Share (%), by Country 2024 & 2032
- Figure 22: Europe Retail Digital Transformation Market Revenue (Million), by Accesibility 2024 & 2032
- Figure 23: Europe Retail Digital Transformation Market Revenue Share (%), by Accesibility 2024 & 2032
- Figure 24: Europe Retail Digital Transformation Market Revenue (Million), by Product 2024 & 2032
- Figure 25: Europe Retail Digital Transformation Market Revenue Share (%), by Product 2024 & 2032
- Figure 26: Europe Retail Digital Transformation Market Revenue (Million), by Technology 2024 & 2032
- Figure 27: Europe Retail Digital Transformation Market Revenue Share (%), by Technology 2024 & 2032
- Figure 28: Europe Retail Digital Transformation Market Revenue (Million), by Country 2024 & 2032
- Figure 29: Europe Retail Digital Transformation Market Revenue Share (%), by Country 2024 & 2032
- Figure 30: Asia Pacific Retail Digital Transformation Market Revenue (Million), by Accesibility 2024 & 2032
- Figure 31: Asia Pacific Retail Digital Transformation Market Revenue Share (%), by Accesibility 2024 & 2032
- Figure 32: Asia Pacific Retail Digital Transformation Market Revenue (Million), by Product 2024 & 2032
- Figure 33: Asia Pacific Retail Digital Transformation Market Revenue Share (%), by Product 2024 & 2032
- Figure 34: Asia Pacific Retail Digital Transformation Market Revenue (Million), by Technology 2024 & 2032
- Figure 35: Asia Pacific Retail Digital Transformation Market Revenue Share (%), by Technology 2024 & 2032
- Figure 36: Asia Pacific Retail Digital Transformation Market Revenue (Million), by Country 2024 & 2032
- Figure 37: Asia Pacific Retail Digital Transformation Market Revenue Share (%), by Country 2024 & 2032
- Figure 38: Latin America Retail Digital Transformation Market Revenue (Million), by Accesibility 2024 & 2032
- Figure 39: Latin America Retail Digital Transformation Market Revenue Share (%), by Accesibility 2024 & 2032
- Figure 40: Latin America Retail Digital Transformation Market Revenue (Million), by Product 2024 & 2032
- Figure 41: Latin America Retail Digital Transformation Market Revenue Share (%), by Product 2024 & 2032
- Figure 42: Latin America Retail Digital Transformation Market Revenue (Million), by Technology 2024 & 2032
- Figure 43: Latin America Retail Digital Transformation Market Revenue Share (%), by Technology 2024 & 2032
- Figure 44: Latin America Retail Digital Transformation Market Revenue (Million), by Country 2024 & 2032
- Figure 45: Latin America Retail Digital Transformation Market Revenue Share (%), by Country 2024 & 2032
- Figure 46: Middle East Retail Digital Transformation Market Revenue (Million), by Accesibility 2024 & 2032
- Figure 47: Middle East Retail Digital Transformation Market Revenue Share (%), by Accesibility 2024 & 2032
- Figure 48: Middle East Retail Digital Transformation Market Revenue (Million), by Product 2024 & 2032
- Figure 49: Middle East Retail Digital Transformation Market Revenue Share (%), by Product 2024 & 2032
- Figure 50: Middle East Retail Digital Transformation Market Revenue (Million), by Technology 2024 & 2032
- Figure 51: Middle East Retail Digital Transformation Market Revenue Share (%), by Technology 2024 & 2032
- Figure 52: Middle East Retail Digital Transformation Market Revenue (Million), by Country 2024 & 2032
- Figure 53: Middle East Retail Digital Transformation Market Revenue Share (%), by Country 2024 & 2032
- Figure 54: United Arab Emirates Retail Digital Transformation Market Revenue (Million), by Accesibility 2024 & 2032
- Figure 55: United Arab Emirates Retail Digital Transformation Market Revenue Share (%), by Accesibility 2024 & 2032
- Figure 56: United Arab Emirates Retail Digital Transformation Market Revenue (Million), by Product 2024 & 2032
- Figure 57: United Arab Emirates Retail Digital Transformation Market Revenue Share (%), by Product 2024 & 2032
- Figure 58: United Arab Emirates Retail Digital Transformation Market Revenue (Million), by Technology 2024 & 2032
- Figure 59: United Arab Emirates Retail Digital Transformation Market Revenue Share (%), by Technology 2024 & 2032
- Figure 60: United Arab Emirates Retail Digital Transformation Market Revenue (Million), by Country 2024 & 2032
- Figure 61: United Arab Emirates Retail Digital Transformation Market Revenue Share (%), by Country 2024 & 2032
List of Tables
- Table 1: Global Retail Digital Transformation Market Revenue Million Forecast, by Region 2019 & 2032
- Table 2: Global Retail Digital Transformation Market Revenue Million Forecast, by Accesibility 2019 & 2032
- Table 3: Global Retail Digital Transformation Market Revenue Million Forecast, by Product 2019 & 2032
- Table 4: Global Retail Digital Transformation Market Revenue Million Forecast, by Technology 2019 & 2032
- Table 5: Global Retail Digital Transformation Market Revenue Million Forecast, by Region 2019 & 2032
- Table 6: Global Retail Digital Transformation Market Revenue Million Forecast, by Country 2019 & 2032
- Table 7: United States Retail Digital Transformation Market Revenue (Million) Forecast, by Application 2019 & 2032
- Table 8: Canada Retail Digital Transformation Market Revenue (Million) Forecast, by Application 2019 & 2032
- Table 9: Global Retail Digital Transformation Market Revenue Million Forecast, by Country 2019 & 2032
- Table 10: United Kingdom Retail Digital Transformation Market Revenue (Million) Forecast, by Application 2019 & 2032
- Table 11: France Retail Digital Transformation Market Revenue (Million) Forecast, by Application 2019 & 2032
- Table 12: Germany Retail Digital Transformation Market Revenue (Million) Forecast, by Application 2019 & 2032
- Table 13: Rest of Europe Retail Digital Transformation Market Revenue (Million) Forecast, by Application 2019 & 2032
- Table 14: Global Retail Digital Transformation Market Revenue Million Forecast, by Country 2019 & 2032
- Table 15: China Retail Digital Transformation Market Revenue (Million) Forecast, by Application 2019 & 2032
- Table 16: Japan Retail Digital Transformation Market Revenue (Million) Forecast, by Application 2019 & 2032
- Table 17: India Retail Digital Transformation Market Revenue (Million) Forecast, by Application 2019 & 2032
- Table 18: Rest of Asia Pacific Retail Digital Transformation Market Revenue (Million) Forecast, by Application 2019 & 2032
- Table 19: Global Retail Digital Transformation Market Revenue Million Forecast, by Country 2019 & 2032
- Table 20: Mexico Retail Digital Transformation Market Revenue (Million) Forecast, by Application 2019 & 2032
- Table 21: Brazil Retail Digital Transformation Market Revenue (Million) Forecast, by Application 2019 & 2032
- Table 22: Argentina Retail Digital Transformation Market Revenue (Million) Forecast, by Application 2019 & 2032
- Table 23: Rest of Latin America Retail Digital Transformation Market Revenue (Million) Forecast, by Application 2019 & 2032
- Table 24: Global Retail Digital Transformation Market Revenue Million Forecast, by Country 2019 & 2032
- Table 25: Retail Digital Transformation Market Revenue (Million) Forecast, by Application 2019 & 2032
- Table 26: Global Retail Digital Transformation Market Revenue Million Forecast, by Country 2019 & 2032
- Table 27: Saudi Arabia Retail Digital Transformation Market Revenue (Million) Forecast, by Application 2019 & 2032
- Table 28: Rest of Middle East Retail Digital Transformation Market Revenue (Million) Forecast, by Application 2019 & 2032
- Table 29: Global Retail Digital Transformation Market Revenue Million Forecast, by Accesibility 2019 & 2032
- Table 30: Global Retail Digital Transformation Market Revenue Million Forecast, by Product 2019 & 2032
- Table 31: Global Retail Digital Transformation Market Revenue Million Forecast, by Technology 2019 & 2032
- Table 32: Global Retail Digital Transformation Market Revenue Million Forecast, by Country 2019 & 2032
- Table 33: United States Retail Digital Transformation Market Revenue (Million) Forecast, by Application 2019 & 2032
- Table 34: Canada Retail Digital Transformation Market Revenue (Million) Forecast, by Application 2019 & 2032
- Table 35: Global Retail Digital Transformation Market Revenue Million Forecast, by Accesibility 2019 & 2032
- Table 36: Global Retail Digital Transformation Market Revenue Million Forecast, by Product 2019 & 2032
- Table 37: Global Retail Digital Transformation Market Revenue Million Forecast, by Technology 2019 & 2032
- Table 38: Global Retail Digital Transformation Market Revenue Million Forecast, by Country 2019 & 2032
- Table 39: United Kingdom Retail Digital Transformation Market Revenue (Million) Forecast, by Application 2019 & 2032
- Table 40: France Retail Digital Transformation Market Revenue (Million) Forecast, by Application 2019 & 2032
- Table 41: Germany Retail Digital Transformation Market Revenue (Million) Forecast, by Application 2019 & 2032
- Table 42: Rest of Europe Retail Digital Transformation Market Revenue (Million) Forecast, by Application 2019 & 2032
- Table 43: Global Retail Digital Transformation Market Revenue Million Forecast, by Accesibility 2019 & 2032
- Table 44: Global Retail Digital Transformation Market Revenue Million Forecast, by Product 2019 & 2032
- Table 45: Global Retail Digital Transformation Market Revenue Million Forecast, by Technology 2019 & 2032
- Table 46: Global Retail Digital Transformation Market Revenue Million Forecast, by Country 2019 & 2032
- Table 47: China Retail Digital Transformation Market Revenue (Million) Forecast, by Application 2019 & 2032
- Table 48: Japan Retail Digital Transformation Market Revenue (Million) Forecast, by Application 2019 & 2032
- Table 49: India Retail Digital Transformation Market Revenue (Million) Forecast, by Application 2019 & 2032
- Table 50: Rest of Asia Pacific Retail Digital Transformation Market Revenue (Million) Forecast, by Application 2019 & 2032
- Table 51: Global Retail Digital Transformation Market Revenue Million Forecast, by Accesibility 2019 & 2032
- Table 52: Global Retail Digital Transformation Market Revenue Million Forecast, by Product 2019 & 2032
- Table 53: Global Retail Digital Transformation Market Revenue Million Forecast, by Technology 2019 & 2032
- Table 54: Global Retail Digital Transformation Market Revenue Million Forecast, by Country 2019 & 2032
- Table 55: Mexico Retail Digital Transformation Market Revenue (Million) Forecast, by Application 2019 & 2032
- Table 56: Brazil Retail Digital Transformation Market Revenue (Million) Forecast, by Application 2019 & 2032
- Table 57: Argentina Retail Digital Transformation Market Revenue (Million) Forecast, by Application 2019 & 2032
- Table 58: Rest of Latin America Retail Digital Transformation Market Revenue (Million) Forecast, by Application 2019 & 2032
- Table 59: Global Retail Digital Transformation Market Revenue Million Forecast, by Accesibility 2019 & 2032
- Table 60: Global Retail Digital Transformation Market Revenue Million Forecast, by Product 2019 & 2032
- Table 61: Global Retail Digital Transformation Market Revenue Million Forecast, by Technology 2019 & 2032
- Table 62: Global Retail Digital Transformation Market Revenue Million Forecast, by Country 2019 & 2032
- Table 63: Global Retail Digital Transformation Market Revenue Million Forecast, by Accesibility 2019 & 2032
- Table 64: Global Retail Digital Transformation Market Revenue Million Forecast, by Product 2019 & 2032
- Table 65: Global Retail Digital Transformation Market Revenue Million Forecast, by Technology 2019 & 2032
- Table 66: Global Retail Digital Transformation Market Revenue Million Forecast, by Country 2019 & 2032
- Table 67: Saudi Arabia Retail Digital Transformation Market Revenue (Million) Forecast, by Application 2019 & 2032
- Table 68: Rest of Middle East Retail Digital Transformation Market Revenue (Million) Forecast, by Application 2019 & 2032
Frequently Asked Questions
1. What is the projected Compound Annual Growth Rate (CAGR) of the Retail Digital Transformation Market?
The projected CAGR is approximately 17.32%.
2. Which companies are prominent players in the Retail Digital Transformation Market?
Key companies in the market include Honeywell International Inc, Alibaba Group Holding Ltd, IBM Corporation, Capgemini Service SAS, Alphabet Inc, Accenture Plc, Amazon com Inc *List Not Exhaustive, Oracle Corporation, Flipkart Inc, SAP SE.
3. What are the main segments of the Retail Digital Transformation Market?
The market segments include Accesibility, Product, Technology.
4. Can you provide details about the market size?
The market size is estimated to be USD 243.57 Million as of 2022.
5. What are some drivers contributing to market growth?
Increased Usage of Smart Devices; Growing Need for Advanced Mobile Logistics Management; Demand for Increase in the Yield and Efficiency.
6. What are the notable trends driving market growth?
Beauty and Personal Care to Hold Significant Share.
7. Are there any restraints impacting market growth?
Lack of General Awareness and Expertise in Emerging Regions; Standardization and Integration Issues.
8. Can you provide examples of recent developments in the market?
September 2022: Boots announced the introduction of a unique online store in 2023 as part of its digital transformation strategy. Boots's marketplace goods will be easily linked with the established product selection on boots.com, providing users access to hundreds of brands from known companies and new vendors.
9. What pricing options are available for accessing the report?
Pricing options include single-user, multi-user, and enterprise licenses priced at USD 4750, USD 5250, and USD 8750 respectively.
10. Is the market size provided in terms of value or volume?
The market size is provided in terms of value, measured in Million.
11. Are there any specific market keywords associated with the report?
Yes, the market keyword associated with the report is "Retail Digital Transformation Market," which aids in identifying and referencing the specific market segment covered.
12. How do I determine which pricing option suits my needs best?
The pricing options vary based on user requirements and access needs. Individual users may opt for single-user licenses, while businesses requiring broader access may choose multi-user or enterprise licenses for cost-effective access to the report.
13. Are there any additional resources or data provided in the Retail Digital Transformation Market report?
While the report offers comprehensive insights, it's advisable to review the specific contents or supplementary materials provided to ascertain if additional resources or data are available.
14. How can I stay updated on further developments or reports in the Retail Digital Transformation Market?
To stay informed about further developments, trends, and reports in the Retail Digital Transformation Market, consider subscribing to industry newsletters, following relevant companies and organizations, or regularly checking reputable industry news sources and publications.
Methodology
Step 1 - Identification of Relevant Samples Size from Population Database


Step 2 - Approaches for Defining Global Market Size (Value, Volume* & Price*)

Note*: In applicable scenarios
Step 3 - Data Sources
Primary Research
- Web Analytics
- Survey Reports
- Research Institute
- Latest Research Reports
- Opinion Leaders
Secondary Research
- Annual Reports
- White Paper
- Latest Press Release
- Industry Association
- Paid Database
- Investor Presentations

Step 4 - Data Triangulation
Involves using different sources of information in order to increase the validity of a study
These sources are likely to be stakeholders in a program - participants, other researchers, program staff, other community members, and so on.
Then we put all data in single framework & apply various statistical tools to find out the dynamic on the market.
During the analysis stage, feedback from the stakeholder groups would be compared to determine areas of agreement as well as areas of divergence


