
Key Insights
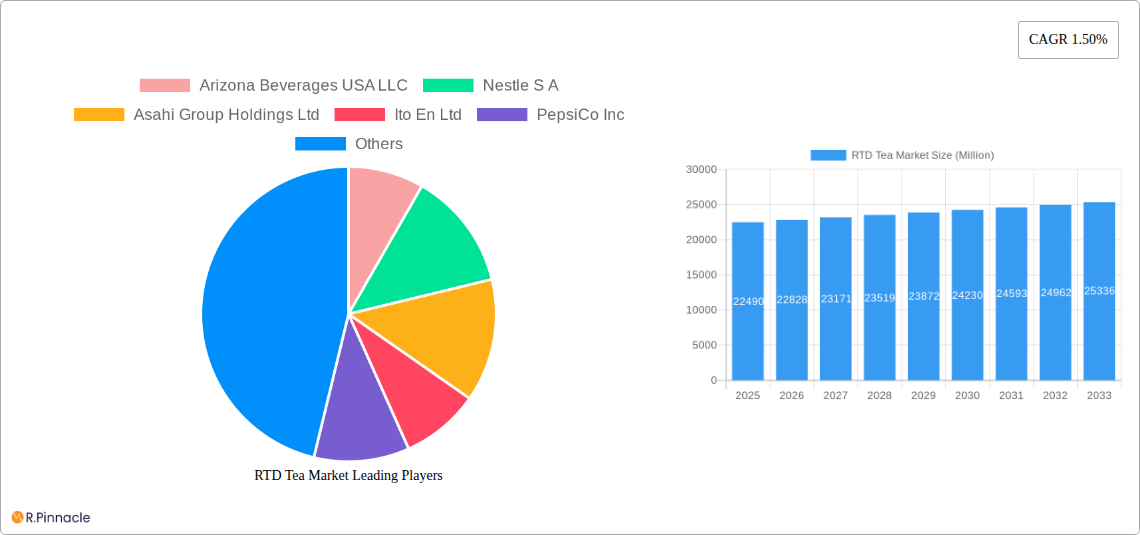
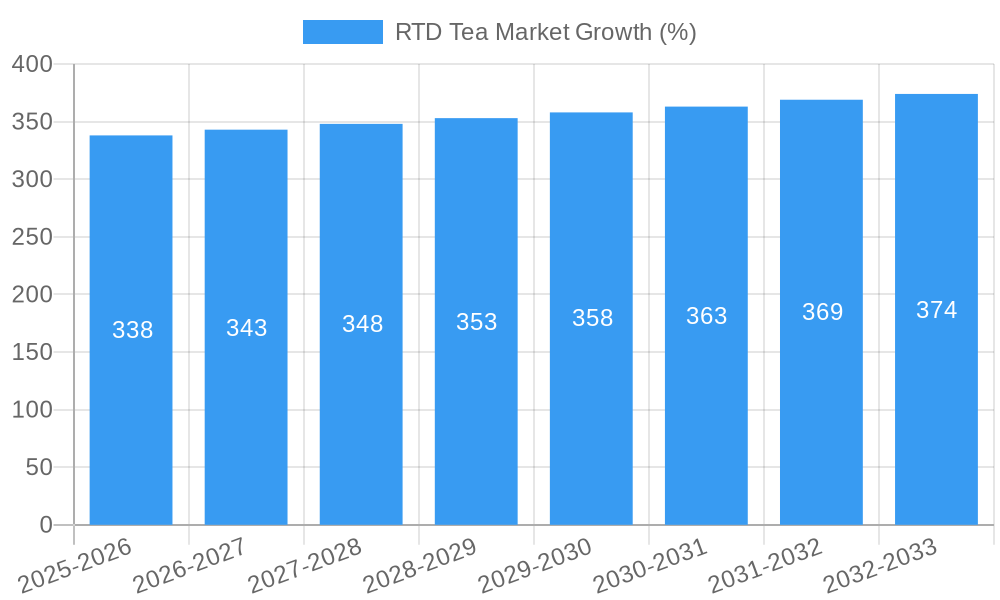
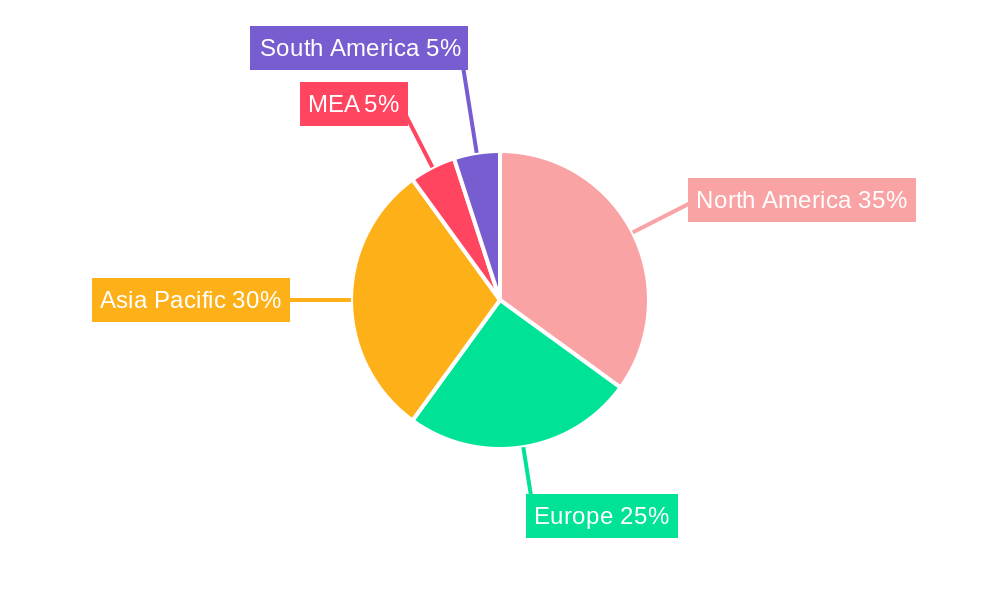
The Ready-to-Drink (RTD) tea market, valued at $22,490 million in 2025, is projected to experience steady growth, driven by increasing health consciousness among consumers and the rising popularity of convenient beverage options. The 1.50% CAGR indicates a moderate yet consistent expansion over the forecast period (2025-2033). Key drivers include the growing demand for functional beverages, the increasing preference for natural and healthier alternatives to sugary soft drinks, and the introduction of innovative flavors and packaging formats catering to diverse consumer preferences. The market is segmented by packaging type (aseptic packages, glass bottles, metal cans, PET bottles), distribution channel (off-trade, on-trade), and tea type (green tea, herbal tea, iced tea, other RTD tea). The dominance of specific segments will likely shift based on evolving consumer trends and marketing strategies employed by key players. Significant regional variations exist, with North America and Asia-Pacific potentially exhibiting faster growth rates than other regions due to higher consumption levels and greater market penetration of RTD tea brands. Competition is intense, with major players like Coca-Cola, PepsiCo, Nestle, and Unilever continually innovating to maintain their market share. Challenges include fluctuating raw material prices and the need to adapt to evolving consumer demands for sustainability and ethical sourcing.
The competitive landscape is characterized by a mix of large multinational corporations and regional players. Established brands leverage their extensive distribution networks and brand recognition to maintain market dominance, while smaller companies often focus on niche segments, offering specialized flavors or functional benefits to attract consumers. Future growth will be influenced by factors such as the increasing prevalence of online retail channels, the rise of premiumization within the RTD tea category, and the growing demand for organic and sustainably sourced products. Successful companies will need to balance cost-effectiveness with quality, innovation, and a strong focus on consumer engagement through effective marketing and branding strategies. The forecast period's growth will likely see a gradual increase in market value, reflecting the sustained, albeit moderate, demand for convenient and healthy RTD tea options.
This comprehensive report provides an in-depth analysis of the Ready-to-Drink (RTD) Tea market, covering the period 2019-2033. It offers actionable insights for industry professionals, investors, and stakeholders seeking to understand market dynamics, growth opportunities, and competitive landscapes within this dynamic beverage sector. The report leverages extensive market research and data analysis to deliver a clear and concise overview of the RTD Tea market, valued at xx Million in 2025 and projected to reach xx Million by 2033.
RTD Tea Market Structure & Innovation Trends
This section analyzes the competitive landscape of the RTD tea market, focusing on market concentration, innovation drivers, regulatory frameworks, product substitutes, end-user demographics, and mergers and acquisitions (M&A) activities. The report examines the market share held by key players like Arizona Beverages USA LLC, Nestle S.A., Asahi Group Holdings Ltd, and others, providing a detailed understanding of market concentration.
- Market Concentration: The RTD tea market exhibits a [High/Medium/Low] level of concentration, with the top five players holding approximately xx% of the market share in 2024.
- Innovation Drivers: Key innovation drivers include the rising demand for healthier beverages, increasing consumer awareness of functional benefits (e.g., antioxidants, immunity boost), and the development of new flavors and formats.
- Regulatory Frameworks: Government regulations regarding sugar content, labeling requirements, and health claims significantly impact product development and marketing strategies.
- Product Substitutes: Competition comes from other ready-to-drink beverages such as soft drinks, juices, and energy drinks.
- End-User Demographics: The target demographic is broad, encompassing various age groups and lifestyles, with significant growth potential among health-conscious consumers.
- M&A Activities: The RTD tea market has witnessed [Number] significant M&A deals in the historical period (2019-2024), with a total estimated value of xx Million. These deals primarily focus on expanding product portfolios, geographic reach, and gaining access to new technologies.
RTD Tea Market Dynamics & Trends
This section delves into the key market dynamics influencing the RTD tea market's growth trajectory. It examines market growth drivers, technological disruptions, consumer preferences, and competitive dynamics.
The global RTD tea market is experiencing robust growth, with a Compound Annual Growth Rate (CAGR) of xx% during the forecast period (2025-2033). Key drivers include:
- Health and Wellness Trends: Growing consumer awareness of health and wellness is fueling demand for healthier beverage options, including RTD teas rich in antioxidants and other beneficial compounds.
- Premiumization and Functionalization: Consumers are increasingly seeking premium and functional teas offering added benefits beyond refreshment, such as enhanced immunity, improved energy levels, or specific health claims.
- Convenience and Portability: The ease of consumption and portability of RTD teas makes them a convenient choice for on-the-go lifestyles.
- Product Diversification: The introduction of new flavors, formats, and functional ingredients contributes to market expansion and caters to evolving consumer preferences.
- E-commerce Growth: The rising popularity of online grocery shopping and direct-to-consumer (DTC) models significantly contributes to market penetration and accessibility. Market penetration is estimated at xx% in 2025, projected to increase to xx% by 2033.
Dominant Regions & Segments in RTD Tea Market
This section identifies the leading regions, countries, and segments within the RTD tea market, focusing on packaging type, distribution channel, and soft drink type.
Dominant Region: [Region Name] is identified as the leading region, primarily driven by [Key Drivers – use bullet points]:
- High per capita consumption of tea
- Favorable economic conditions
- Strong distribution networks
- Growing health consciousness
Dominant Segments: Detailed analysis of dominant segments in terms of packaging type (Aseptic packages, Glass Bottles, Metal Can, PET Bottles), distribution channel (Off-trade, On-trade), and soft drink type (Green Tea, Herbal Tea, Iced Tea, Other RTD Tea) with reasons for dominance provided in paragraphs for each segment. [For example: PET Bottles are dominant due to low cost and suitability for mass production and distribution. Off-trade channel dominates due to high retail reach and consumer preference for convenient purchasing options. Iced tea is the dominant soft drink type due to its refreshing properties and wide appeal.]
RTD Tea Market Product Innovations
The RTD tea market is witnessing significant product innovations, focusing on functional ingredients, unique flavors, and sustainable packaging. Manufacturers are incorporating ingredients like probiotics, adaptogens, and superfoods to cater to health-conscious consumers. Technological advancements in packaging, such as aseptic processing and sustainable materials, are enhancing product shelf life and reducing environmental impact. These innovations enhance competitive advantages by offering differentiated products that meet the growing demand for healthier and more sustainable beverage options.
Report Scope & Segmentation Analysis
This report segments the RTD tea market based on packaging type (Aseptic packages, Glass Bottles, Metal Can, PET Bottles), distribution channel (Off-trade, On-trade), and soft drink type (Green Tea, Herbal Tea, Iced Tea, Other RTD Tea). Each segment’s growth projections, market size, and competitive dynamics are analyzed. [Each paragraph details a segment analysis. For example: The Aseptic packaging segment is expected to witness significant growth due to its extended shelf life and cost-effectiveness. Competition within this segment is intense, with leading players employing various strategies to maintain market share].
Key Drivers of RTD Tea Market Growth
The RTD tea market's growth is driven by several factors. Increasing health consciousness among consumers fuels the demand for healthier alternatives to traditional sugary drinks. Technological advancements lead to innovative product formulations and sustainable packaging options. Favorable economic conditions in key markets, coupled with supportive government policies, further stimulate market growth.
Challenges in the RTD Tea Market Sector
The RTD tea market faces challenges, including intense competition, fluctuating raw material prices, and stringent regulatory compliance requirements. Supply chain disruptions can impact production and distribution, affecting market stability. Maintaining brand loyalty in a saturated market is crucial for sustained success.
Emerging Opportunities in RTD Tea Market
Emerging opportunities lie in expanding into new markets, particularly in developing economies with growing middle classes. Developing innovative functional teas with added health benefits caters to the rising demand for healthy beverages. Exploring sustainable and eco-friendly packaging options aligns with growing consumer preference for environmentally responsible products.
Leading Players in the RTD Tea Market Market
- Arizona Beverages USA LLC
- Nestle S.A. (Nestle)
- Asahi Group Holdings Ltd (Asahi)
- Ito En Ltd (Ito En)
- PepsiCo Inc (PepsiCo)
- Tata Consumer Products Ltd (Tata Consumer Products)
- PT Anggada Putra Rekso Mulia
- Suntory Holdings Limited (Suntory)
- Keurig Dr Pepper Inc (Keurig Dr Pepper)
- Tingyi (Cayman Islands) Holding Corporation
- The Coca-Cola Company (Coca-Cola)
- Hangzhou Wahaha Group Co Ltd
- Uni-President Enterprises Corp
- Kirin Holdings Company Limited (Kirin)
- Thai Beverages PCL
- Reily Foods Company
- Sapporo Holdings Limited (Sapporo)
Key Developments in RTD Tea Market Industry
- February 2024: Rockstar® Energy Drink (PepsiCo) launches Rockstar Focus™, expanding into the functional beverage segment. This launch targets a new consumer segment interested in energy and cognitive enhancement.
- November 2023: The Coca-Cola Company expands its ChaiChun brand with a new store in Delhi, indicating growth ambitions in the premium tea segment and direct-to-consumer strategy.
- January 2023: Lipton Tea partners with Full Cart, enhancing its brand image by associating with a social initiative promoting health and accessibility. This may improve brand image and consumer perception.
Future Outlook for RTD Tea Market Market
The RTD tea market is poised for continued growth, driven by health and wellness trends, product innovation, and expanding distribution channels. Strategic partnerships, acquisitions, and the development of innovative products tailored to specific consumer needs will shape the future landscape. The market's potential lies in capitalizing on emerging trends such as sustainability, personalization, and functional benefits to further enhance market penetration and consumer engagement.
RTD Tea Market Segmentation
-
1. Soft Drink Type
- 1.1. Green Tea
- 1.2. Herbal Tea
- 1.3. Iced Tea
- 1.4. Other RTD Tea
-
2. Packaging Type
- 2.1. Aseptic packages
- 2.2. Glass Bottles
- 2.3. Metal Can
- 2.4. PET Bottles
-
3. Distribution Channel
-
3.1. Off-trade
- 3.1.1. Convenience Stores
- 3.1.2. Online Retail
- 3.1.3. Supermarket/Hypermarket
- 3.1.4. Others
- 3.2. On-trade
-
3.1. Off-trade
RTD Tea Market Segmentation By Geography
-
1. North America
- 1.1. United States
- 1.2. Canada
- 1.3. Mexico
-
2. South America
- 2.1. Brazil
- 2.2. Argentina
- 2.3. Rest of South America
-
3. Europe
- 3.1. United Kingdom
- 3.2. Germany
- 3.3. France
- 3.4. Italy
- 3.5. Spain
- 3.6. Russia
- 3.7. Benelux
- 3.8. Nordics
- 3.9. Rest of Europe
-
4. Middle East & Africa
- 4.1. Turkey
- 4.2. Israel
- 4.3. GCC
- 4.4. North Africa
- 4.5. South Africa
- 4.6. Rest of Middle East & Africa
-
5. Asia Pacific
- 5.1. China
- 5.2. India
- 5.3. Japan
- 5.4. South Korea
- 5.5. ASEAN
- 5.6. Oceania
- 5.7. Rest of Asia Pacific
RTD Tea Market REPORT HIGHLIGHTS
| Aspects | Details |
|---|---|
| Study Period | 2019-2033 |
| Base Year | 2024 |
| Estimated Year | 2025 |
| Forecast Period | 2025-2033 |
| Historical Period | 2019-2024 |
| Growth Rate | CAGR of 1.50% from 2019-2033 |
| Segmentation |
|
Table of Contents
- 1. Introduction
- 1.1. Research Scope
- 1.2. Market Segmentation
- 1.3. Research Methodology
- 1.4. Definitions and Assumptions
- 2. Executive Summary
- 2.1. Introduction
- 3. Market Dynamics
- 3.1. Introduction
- 3.2. Market Drivers
- 3.2.1. Increasing demand for meat alternatives
- 3.3. Market Restrains
- 3.3.1. Presence of numerous alternatives in the plant proteins
- 3.4. Market Trends
- 3.4.1. OTHER KEY INDUSTRY TRENDS COVERED IN THE REPORT
- 4. Market Factor Analysis
- 4.1. Porters Five Forces
- 4.2. Supply/Value Chain
- 4.3. PESTEL analysis
- 4.4. Market Entropy
- 4.5. Patent/Trademark Analysis
- 5. Global RTD Tea Market Analysis, Insights and Forecast, 2019-2031
- 5.1. Market Analysis, Insights and Forecast - by Soft Drink Type
- 5.1.1. Green Tea
- 5.1.2. Herbal Tea
- 5.1.3. Iced Tea
- 5.1.4. Other RTD Tea
- 5.2. Market Analysis, Insights and Forecast - by Packaging Type
- 5.2.1. Aseptic packages
- 5.2.2. Glass Bottles
- 5.2.3. Metal Can
- 5.2.4. PET Bottles
- 5.3. Market Analysis, Insights and Forecast - by Distribution Channel
- 5.3.1. Off-trade
- 5.3.1.1. Convenience Stores
- 5.3.1.2. Online Retail
- 5.3.1.3. Supermarket/Hypermarket
- 5.3.1.4. Others
- 5.3.2. On-trade
- 5.3.1. Off-trade
- 5.4. Market Analysis, Insights and Forecast - by Region
- 5.4.1. North America
- 5.4.2. South America
- 5.4.3. Europe
- 5.4.4. Middle East & Africa
- 5.4.5. Asia Pacific
- 5.1. Market Analysis, Insights and Forecast - by Soft Drink Type
- 6. North America RTD Tea Market Analysis, Insights and Forecast, 2019-2031
- 6.1. Market Analysis, Insights and Forecast - by Soft Drink Type
- 6.1.1. Green Tea
- 6.1.2. Herbal Tea
- 6.1.3. Iced Tea
- 6.1.4. Other RTD Tea
- 6.2. Market Analysis, Insights and Forecast - by Packaging Type
- 6.2.1. Aseptic packages
- 6.2.2. Glass Bottles
- 6.2.3. Metal Can
- 6.2.4. PET Bottles
- 6.3. Market Analysis, Insights and Forecast - by Distribution Channel
- 6.3.1. Off-trade
- 6.3.1.1. Convenience Stores
- 6.3.1.2. Online Retail
- 6.3.1.3. Supermarket/Hypermarket
- 6.3.1.4. Others
- 6.3.2. On-trade
- 6.3.1. Off-trade
- 6.1. Market Analysis, Insights and Forecast - by Soft Drink Type
- 7. South America RTD Tea Market Analysis, Insights and Forecast, 2019-2031
- 7.1. Market Analysis, Insights and Forecast - by Soft Drink Type
- 7.1.1. Green Tea
- 7.1.2. Herbal Tea
- 7.1.3. Iced Tea
- 7.1.4. Other RTD Tea
- 7.2. Market Analysis, Insights and Forecast - by Packaging Type
- 7.2.1. Aseptic packages
- 7.2.2. Glass Bottles
- 7.2.3. Metal Can
- 7.2.4. PET Bottles
- 7.3. Market Analysis, Insights and Forecast - by Distribution Channel
- 7.3.1. Off-trade
- 7.3.1.1. Convenience Stores
- 7.3.1.2. Online Retail
- 7.3.1.3. Supermarket/Hypermarket
- 7.3.1.4. Others
- 7.3.2. On-trade
- 7.3.1. Off-trade
- 7.1. Market Analysis, Insights and Forecast - by Soft Drink Type
- 8. Europe RTD Tea Market Analysis, Insights and Forecast, 2019-2031
- 8.1. Market Analysis, Insights and Forecast - by Soft Drink Type
- 8.1.1. Green Tea
- 8.1.2. Herbal Tea
- 8.1.3. Iced Tea
- 8.1.4. Other RTD Tea
- 8.2. Market Analysis, Insights and Forecast - by Packaging Type
- 8.2.1. Aseptic packages
- 8.2.2. Glass Bottles
- 8.2.3. Metal Can
- 8.2.4. PET Bottles
- 8.3. Market Analysis, Insights and Forecast - by Distribution Channel
- 8.3.1. Off-trade
- 8.3.1.1. Convenience Stores
- 8.3.1.2. Online Retail
- 8.3.1.3. Supermarket/Hypermarket
- 8.3.1.4. Others
- 8.3.2. On-trade
- 8.3.1. Off-trade
- 8.1. Market Analysis, Insights and Forecast - by Soft Drink Type
- 9. Middle East & Africa RTD Tea Market Analysis, Insights and Forecast, 2019-2031
- 9.1. Market Analysis, Insights and Forecast - by Soft Drink Type
- 9.1.1. Green Tea
- 9.1.2. Herbal Tea
- 9.1.3. Iced Tea
- 9.1.4. Other RTD Tea
- 9.2. Market Analysis, Insights and Forecast - by Packaging Type
- 9.2.1. Aseptic packages
- 9.2.2. Glass Bottles
- 9.2.3. Metal Can
- 9.2.4. PET Bottles
- 9.3. Market Analysis, Insights and Forecast - by Distribution Channel
- 9.3.1. Off-trade
- 9.3.1.1. Convenience Stores
- 9.3.1.2. Online Retail
- 9.3.1.3. Supermarket/Hypermarket
- 9.3.1.4. Others
- 9.3.2. On-trade
- 9.3.1. Off-trade
- 9.1. Market Analysis, Insights and Forecast - by Soft Drink Type
- 10. Asia Pacific RTD Tea Market Analysis, Insights and Forecast, 2019-2031
- 10.1. Market Analysis, Insights and Forecast - by Soft Drink Type
- 10.1.1. Green Tea
- 10.1.2. Herbal Tea
- 10.1.3. Iced Tea
- 10.1.4. Other RTD Tea
- 10.2. Market Analysis, Insights and Forecast - by Packaging Type
- 10.2.1. Aseptic packages
- 10.2.2. Glass Bottles
- 10.2.3. Metal Can
- 10.2.4. PET Bottles
- 10.3. Market Analysis, Insights and Forecast - by Distribution Channel
- 10.3.1. Off-trade
- 10.3.1.1. Convenience Stores
- 10.3.1.2. Online Retail
- 10.3.1.3. Supermarket/Hypermarket
- 10.3.1.4. Others
- 10.3.2. On-trade
- 10.3.1. Off-trade
- 10.1. Market Analysis, Insights and Forecast - by Soft Drink Type
- 11. MEA RTD Tea Market Analysis, Insights and Forecast, 2019-2031
- 11.1. Market Analysis, Insights and Forecast - By Country/Sub-region
- 11.1.1 Middle East
- 11.1.2 Africa
- 12. South America RTD Tea Market Analysis, Insights and Forecast, 2019-2031
- 12.1. Market Analysis, Insights and Forecast - By Country/Sub-region
- 12.1.1 Brazil
- 12.1.2 Argentina
- 12.1.3 Rest of South America
- 13. Europe RTD Tea Market Analysis, Insights and Forecast, 2019-2031
- 13.1. Market Analysis, Insights and Forecast - By Country/Sub-region
- 13.1.1. Germany
- 14. Asia Pacific RTD Tea Market Analysis, Insights and Forecast, 2019-2031
- 14.1. Market Analysis, Insights and Forecast - By Country/Sub-region
- 14.1.1 China
- 14.1.2 Japan
- 14.1.3 India
- 14.1.4 South Korea
- 14.1.5 Taiwan
- 14.1.6 Australia
- 14.1.7 Rest of Asia-Pacific
- 15. North America RTD Tea Market Analysis, Insights and Forecast, 2019-2031
- 15.1. Market Analysis, Insights and Forecast - By Country/Sub-region
- 15.1.1. United States Canada Mexico
- 16. Competitive Analysis
- 16.1. Global Market Share Analysis 2024
- 16.2. Company Profiles
- 16.2.1 Arizona Beverages USA LLC
- 16.2.1.1. Overview
- 16.2.1.2. Products
- 16.2.1.3. SWOT Analysis
- 16.2.1.4. Recent Developments
- 16.2.1.5. Financials (Based on Availability)
- 16.2.2 Nestle S A
- 16.2.2.1. Overview
- 16.2.2.2. Products
- 16.2.2.3. SWOT Analysis
- 16.2.2.4. Recent Developments
- 16.2.2.5. Financials (Based on Availability)
- 16.2.3 Asahi Group Holdings Ltd
- 16.2.3.1. Overview
- 16.2.3.2. Products
- 16.2.3.3. SWOT Analysis
- 16.2.3.4. Recent Developments
- 16.2.3.5. Financials (Based on Availability)
- 16.2.4 Ito En Ltd
- 16.2.4.1. Overview
- 16.2.4.2. Products
- 16.2.4.3. SWOT Analysis
- 16.2.4.4. Recent Developments
- 16.2.4.5. Financials (Based on Availability)
- 16.2.5 PepsiCo Inc
- 16.2.5.1. Overview
- 16.2.5.2. Products
- 16.2.5.3. SWOT Analysis
- 16.2.5.4. Recent Developments
- 16.2.5.5. Financials (Based on Availability)
- 16.2.6 Tata Consumer Products Ltd
- 16.2.6.1. Overview
- 16.2.6.2. Products
- 16.2.6.3. SWOT Analysis
- 16.2.6.4. Recent Developments
- 16.2.6.5. Financials (Based on Availability)
- 16.2.7 PT Anggada Putra Rekso Mulia
- 16.2.7.1. Overview
- 16.2.7.2. Products
- 16.2.7.3. SWOT Analysis
- 16.2.7.4. Recent Developments
- 16.2.7.5. Financials (Based on Availability)
- 16.2.8 Suntory Holdings Limited
- 16.2.8.1. Overview
- 16.2.8.2. Products
- 16.2.8.3. SWOT Analysis
- 16.2.8.4. Recent Developments
- 16.2.8.5. Financials (Based on Availability)
- 16.2.9 Keurig Dr Pepper Inc
- 16.2.9.1. Overview
- 16.2.9.2. Products
- 16.2.9.3. SWOT Analysis
- 16.2.9.4. Recent Developments
- 16.2.9.5. Financials (Based on Availability)
- 16.2.10 Tingyi (Cayman Islands) Holding Corporation
- 16.2.10.1. Overview
- 16.2.10.2. Products
- 16.2.10.3. SWOT Analysis
- 16.2.10.4. Recent Developments
- 16.2.10.5. Financials (Based on Availability)
- 16.2.11 The Coca-Cola Company
- 16.2.11.1. Overview
- 16.2.11.2. Products
- 16.2.11.3. SWOT Analysis
- 16.2.11.4. Recent Developments
- 16.2.11.5. Financials (Based on Availability)
- 16.2.12 Hangzhou Wahaha Group Co Ltd
- 16.2.12.1. Overview
- 16.2.12.2. Products
- 16.2.12.3. SWOT Analysis
- 16.2.12.4. Recent Developments
- 16.2.12.5. Financials (Based on Availability)
- 16.2.13 Uni-President Enterprises Corp
- 16.2.13.1. Overview
- 16.2.13.2. Products
- 16.2.13.3. SWOT Analysis
- 16.2.13.4. Recent Developments
- 16.2.13.5. Financials (Based on Availability)
- 16.2.14 Kirin Holdings Company Limited
- 16.2.14.1. Overview
- 16.2.14.2. Products
- 16.2.14.3. SWOT Analysis
- 16.2.14.4. Recent Developments
- 16.2.14.5. Financials (Based on Availability)
- 16.2.15 Thai Beverages PCL
- 16.2.15.1. Overview
- 16.2.15.2. Products
- 16.2.15.3. SWOT Analysis
- 16.2.15.4. Recent Developments
- 16.2.15.5. Financials (Based on Availability)
- 16.2.16 Reily Foods Company
- 16.2.16.1. Overview
- 16.2.16.2. Products
- 16.2.16.3. SWOT Analysis
- 16.2.16.4. Recent Developments
- 16.2.16.5. Financials (Based on Availability)
- 16.2.17 Sapporo Holdings Limited
- 16.2.17.1. Overview
- 16.2.17.2. Products
- 16.2.17.3. SWOT Analysis
- 16.2.17.4. Recent Developments
- 16.2.17.5. Financials (Based on Availability)
- 16.2.1 Arizona Beverages USA LLC
List of Figures
- Figure 1: Global RTD Tea Market Revenue Breakdown (Million, %) by Region 2024 & 2032
- Figure 2: Global RTD Tea Market Volume Breakdown (K Tons, %) by Region 2024 & 2032
- Figure 3: MEA RTD Tea Market Revenue (Million), by Country 2024 & 2032
- Figure 4: MEA RTD Tea Market Volume (K Tons), by Country 2024 & 2032
- Figure 5: MEA RTD Tea Market Revenue Share (%), by Country 2024 & 2032
- Figure 6: MEA RTD Tea Market Volume Share (%), by Country 2024 & 2032
- Figure 7: South America RTD Tea Market Revenue (Million), by Country 2024 & 2032
- Figure 8: South America RTD Tea Market Volume (K Tons), by Country 2024 & 2032
- Figure 9: South America RTD Tea Market Revenue Share (%), by Country 2024 & 2032
- Figure 10: South America RTD Tea Market Volume Share (%), by Country 2024 & 2032
- Figure 11: Europe RTD Tea Market Revenue (Million), by Country 2024 & 2032
- Figure 12: Europe RTD Tea Market Volume (K Tons), by Country 2024 & 2032
- Figure 13: Europe RTD Tea Market Revenue Share (%), by Country 2024 & 2032
- Figure 14: Europe RTD Tea Market Volume Share (%), by Country 2024 & 2032
- Figure 15: Asia Pacific RTD Tea Market Revenue (Million), by Country 2024 & 2032
- Figure 16: Asia Pacific RTD Tea Market Volume (K Tons), by Country 2024 & 2032
- Figure 17: Asia Pacific RTD Tea Market Revenue Share (%), by Country 2024 & 2032
- Figure 18: Asia Pacific RTD Tea Market Volume Share (%), by Country 2024 & 2032
- Figure 19: North America RTD Tea Market Revenue (Million), by Country 2024 & 2032
- Figure 20: North America RTD Tea Market Volume (K Tons), by Country 2024 & 2032
- Figure 21: North America RTD Tea Market Revenue Share (%), by Country 2024 & 2032
- Figure 22: North America RTD Tea Market Volume Share (%), by Country 2024 & 2032
- Figure 23: North America RTD Tea Market Revenue (Million), by Soft Drink Type 2024 & 2032
- Figure 24: North America RTD Tea Market Volume (K Tons), by Soft Drink Type 2024 & 2032
- Figure 25: North America RTD Tea Market Revenue Share (%), by Soft Drink Type 2024 & 2032
- Figure 26: North America RTD Tea Market Volume Share (%), by Soft Drink Type 2024 & 2032
- Figure 27: North America RTD Tea Market Revenue (Million), by Packaging Type 2024 & 2032
- Figure 28: North America RTD Tea Market Volume (K Tons), by Packaging Type 2024 & 2032
- Figure 29: North America RTD Tea Market Revenue Share (%), by Packaging Type 2024 & 2032
- Figure 30: North America RTD Tea Market Volume Share (%), by Packaging Type 2024 & 2032
- Figure 31: North America RTD Tea Market Revenue (Million), by Distribution Channel 2024 & 2032
- Figure 32: North America RTD Tea Market Volume (K Tons), by Distribution Channel 2024 & 2032
- Figure 33: North America RTD Tea Market Revenue Share (%), by Distribution Channel 2024 & 2032
- Figure 34: North America RTD Tea Market Volume Share (%), by Distribution Channel 2024 & 2032
- Figure 35: North America RTD Tea Market Revenue (Million), by Country 2024 & 2032
- Figure 36: North America RTD Tea Market Volume (K Tons), by Country 2024 & 2032
- Figure 37: North America RTD Tea Market Revenue Share (%), by Country 2024 & 2032
- Figure 38: North America RTD Tea Market Volume Share (%), by Country 2024 & 2032
- Figure 39: South America RTD Tea Market Revenue (Million), by Soft Drink Type 2024 & 2032
- Figure 40: South America RTD Tea Market Volume (K Tons), by Soft Drink Type 2024 & 2032
- Figure 41: South America RTD Tea Market Revenue Share (%), by Soft Drink Type 2024 & 2032
- Figure 42: South America RTD Tea Market Volume Share (%), by Soft Drink Type 2024 & 2032
- Figure 43: South America RTD Tea Market Revenue (Million), by Packaging Type 2024 & 2032
- Figure 44: South America RTD Tea Market Volume (K Tons), by Packaging Type 2024 & 2032
- Figure 45: South America RTD Tea Market Revenue Share (%), by Packaging Type 2024 & 2032
- Figure 46: South America RTD Tea Market Volume Share (%), by Packaging Type 2024 & 2032
- Figure 47: South America RTD Tea Market Revenue (Million), by Distribution Channel 2024 & 2032
- Figure 48: South America RTD Tea Market Volume (K Tons), by Distribution Channel 2024 & 2032
- Figure 49: South America RTD Tea Market Revenue Share (%), by Distribution Channel 2024 & 2032
- Figure 50: South America RTD Tea Market Volume Share (%), by Distribution Channel 2024 & 2032
- Figure 51: South America RTD Tea Market Revenue (Million), by Country 2024 & 2032
- Figure 52: South America RTD Tea Market Volume (K Tons), by Country 2024 & 2032
- Figure 53: South America RTD Tea Market Revenue Share (%), by Country 2024 & 2032
- Figure 54: South America RTD Tea Market Volume Share (%), by Country 2024 & 2032
- Figure 55: Europe RTD Tea Market Revenue (Million), by Soft Drink Type 2024 & 2032
- Figure 56: Europe RTD Tea Market Volume (K Tons), by Soft Drink Type 2024 & 2032
- Figure 57: Europe RTD Tea Market Revenue Share (%), by Soft Drink Type 2024 & 2032
- Figure 58: Europe RTD Tea Market Volume Share (%), by Soft Drink Type 2024 & 2032
- Figure 59: Europe RTD Tea Market Revenue (Million), by Packaging Type 2024 & 2032
- Figure 60: Europe RTD Tea Market Volume (K Tons), by Packaging Type 2024 & 2032
- Figure 61: Europe RTD Tea Market Revenue Share (%), by Packaging Type 2024 & 2032
- Figure 62: Europe RTD Tea Market Volume Share (%), by Packaging Type 2024 & 2032
- Figure 63: Europe RTD Tea Market Revenue (Million), by Distribution Channel 2024 & 2032
- Figure 64: Europe RTD Tea Market Volume (K Tons), by Distribution Channel 2024 & 2032
- Figure 65: Europe RTD Tea Market Revenue Share (%), by Distribution Channel 2024 & 2032
- Figure 66: Europe RTD Tea Market Volume Share (%), by Distribution Channel 2024 & 2032
- Figure 67: Europe RTD Tea Market Revenue (Million), by Country 2024 & 2032
- Figure 68: Europe RTD Tea Market Volume (K Tons), by Country 2024 & 2032
- Figure 69: Europe RTD Tea Market Revenue Share (%), by Country 2024 & 2032
- Figure 70: Europe RTD Tea Market Volume Share (%), by Country 2024 & 2032
- Figure 71: Middle East & Africa RTD Tea Market Revenue (Million), by Soft Drink Type 2024 & 2032
- Figure 72: Middle East & Africa RTD Tea Market Volume (K Tons), by Soft Drink Type 2024 & 2032
- Figure 73: Middle East & Africa RTD Tea Market Revenue Share (%), by Soft Drink Type 2024 & 2032
- Figure 74: Middle East & Africa RTD Tea Market Volume Share (%), by Soft Drink Type 2024 & 2032
- Figure 75: Middle East & Africa RTD Tea Market Revenue (Million), by Packaging Type 2024 & 2032
- Figure 76: Middle East & Africa RTD Tea Market Volume (K Tons), by Packaging Type 2024 & 2032
- Figure 77: Middle East & Africa RTD Tea Market Revenue Share (%), by Packaging Type 2024 & 2032
- Figure 78: Middle East & Africa RTD Tea Market Volume Share (%), by Packaging Type 2024 & 2032
- Figure 79: Middle East & Africa RTD Tea Market Revenue (Million), by Distribution Channel 2024 & 2032
- Figure 80: Middle East & Africa RTD Tea Market Volume (K Tons), by Distribution Channel 2024 & 2032
- Figure 81: Middle East & Africa RTD Tea Market Revenue Share (%), by Distribution Channel 2024 & 2032
- Figure 82: Middle East & Africa RTD Tea Market Volume Share (%), by Distribution Channel 2024 & 2032
- Figure 83: Middle East & Africa RTD Tea Market Revenue (Million), by Country 2024 & 2032
- Figure 84: Middle East & Africa RTD Tea Market Volume (K Tons), by Country 2024 & 2032
- Figure 85: Middle East & Africa RTD Tea Market Revenue Share (%), by Country 2024 & 2032
- Figure 86: Middle East & Africa RTD Tea Market Volume Share (%), by Country 2024 & 2032
- Figure 87: Asia Pacific RTD Tea Market Revenue (Million), by Soft Drink Type 2024 & 2032
- Figure 88: Asia Pacific RTD Tea Market Volume (K Tons), by Soft Drink Type 2024 & 2032
- Figure 89: Asia Pacific RTD Tea Market Revenue Share (%), by Soft Drink Type 2024 & 2032
- Figure 90: Asia Pacific RTD Tea Market Volume Share (%), by Soft Drink Type 2024 & 2032
- Figure 91: Asia Pacific RTD Tea Market Revenue (Million), by Packaging Type 2024 & 2032
- Figure 92: Asia Pacific RTD Tea Market Volume (K Tons), by Packaging Type 2024 & 2032
- Figure 93: Asia Pacific RTD Tea Market Revenue Share (%), by Packaging Type 2024 & 2032
- Figure 94: Asia Pacific RTD Tea Market Volume Share (%), by Packaging Type 2024 & 2032
- Figure 95: Asia Pacific RTD Tea Market Revenue (Million), by Distribution Channel 2024 & 2032
- Figure 96: Asia Pacific RTD Tea Market Volume (K Tons), by Distribution Channel 2024 & 2032
- Figure 97: Asia Pacific RTD Tea Market Revenue Share (%), by Distribution Channel 2024 & 2032
- Figure 98: Asia Pacific RTD Tea Market Volume Share (%), by Distribution Channel 2024 & 2032
- Figure 99: Asia Pacific RTD Tea Market Revenue (Million), by Country 2024 & 2032
- Figure 100: Asia Pacific RTD Tea Market Volume (K Tons), by Country 2024 & 2032
- Figure 101: Asia Pacific RTD Tea Market Revenue Share (%), by Country 2024 & 2032
- Figure 102: Asia Pacific RTD Tea Market Volume Share (%), by Country 2024 & 2032
List of Tables
- Table 1: Global RTD Tea Market Revenue Million Forecast, by Region 2019 & 2032
- Table 2: Global RTD Tea Market Volume K Tons Forecast, by Region 2019 & 2032
- Table 3: Global RTD Tea Market Revenue Million Forecast, by Soft Drink Type 2019 & 2032
- Table 4: Global RTD Tea Market Volume K Tons Forecast, by Soft Drink Type 2019 & 2032
- Table 5: Global RTD Tea Market Revenue Million Forecast, by Packaging Type 2019 & 2032
- Table 6: Global RTD Tea Market Volume K Tons Forecast, by Packaging Type 2019 & 2032
- Table 7: Global RTD Tea Market Revenue Million Forecast, by Distribution Channel 2019 & 2032
- Table 8: Global RTD Tea Market Volume K Tons Forecast, by Distribution Channel 2019 & 2032
- Table 9: Global RTD Tea Market Revenue Million Forecast, by Region 2019 & 2032
- Table 10: Global RTD Tea Market Volume K Tons Forecast, by Region 2019 & 2032
- Table 11: Global RTD Tea Market Revenue Million Forecast, by Country 2019 & 2032
- Table 12: Global RTD Tea Market Volume K Tons Forecast, by Country 2019 & 2032
- Table 13: Middle East RTD Tea Market Revenue (Million) Forecast, by Application 2019 & 2032
- Table 14: Middle East RTD Tea Market Volume (K Tons) Forecast, by Application 2019 & 2032
- Table 15: Africa RTD Tea Market Revenue (Million) Forecast, by Application 2019 & 2032
- Table 16: Africa RTD Tea Market Volume (K Tons) Forecast, by Application 2019 & 2032
- Table 17: Global RTD Tea Market Revenue Million Forecast, by Country 2019 & 2032
- Table 18: Global RTD Tea Market Volume K Tons Forecast, by Country 2019 & 2032
- Table 19: Brazil RTD Tea Market Revenue (Million) Forecast, by Application 2019 & 2032
- Table 20: Brazil RTD Tea Market Volume (K Tons) Forecast, by Application 2019 & 2032
- Table 21: Argentina RTD Tea Market Revenue (Million) Forecast, by Application 2019 & 2032
- Table 22: Argentina RTD Tea Market Volume (K Tons) Forecast, by Application 2019 & 2032
- Table 23: Rest of South America RTD Tea Market Revenue (Million) Forecast, by Application 2019 & 2032
- Table 24: Rest of South America RTD Tea Market Volume (K Tons) Forecast, by Application 2019 & 2032
- Table 25: Global RTD Tea Market Revenue Million Forecast, by Country 2019 & 2032
- Table 26: Global RTD Tea Market Volume K Tons Forecast, by Country 2019 & 2032
- Table 27: Germany RTD Tea Market Revenue (Million) Forecast, by Application 2019 & 2032
- Table 28: Germany RTD Tea Market Volume (K Tons) Forecast, by Application 2019 & 2032
- Table 29: Global RTD Tea Market Revenue Million Forecast, by Country 2019 & 2032
- Table 30: Global RTD Tea Market Volume K Tons Forecast, by Country 2019 & 2032
- Table 31: China RTD Tea Market Revenue (Million) Forecast, by Application 2019 & 2032
- Table 32: China RTD Tea Market Volume (K Tons) Forecast, by Application 2019 & 2032
- Table 33: Japan RTD Tea Market Revenue (Million) Forecast, by Application 2019 & 2032
- Table 34: Japan RTD Tea Market Volume (K Tons) Forecast, by Application 2019 & 2032
- Table 35: India RTD Tea Market Revenue (Million) Forecast, by Application 2019 & 2032
- Table 36: India RTD Tea Market Volume (K Tons) Forecast, by Application 2019 & 2032
- Table 37: South Korea RTD Tea Market Revenue (Million) Forecast, by Application 2019 & 2032
- Table 38: South Korea RTD Tea Market Volume (K Tons) Forecast, by Application 2019 & 2032
- Table 39: Taiwan RTD Tea Market Revenue (Million) Forecast, by Application 2019 & 2032
- Table 40: Taiwan RTD Tea Market Volume (K Tons) Forecast, by Application 2019 & 2032
- Table 41: Australia RTD Tea Market Revenue (Million) Forecast, by Application 2019 & 2032
- Table 42: Australia RTD Tea Market Volume (K Tons) Forecast, by Application 2019 & 2032
- Table 43: Rest of Asia-Pacific RTD Tea Market Revenue (Million) Forecast, by Application 2019 & 2032
- Table 44: Rest of Asia-Pacific RTD Tea Market Volume (K Tons) Forecast, by Application 2019 & 2032
- Table 45: Global RTD Tea Market Revenue Million Forecast, by Country 2019 & 2032
- Table 46: Global RTD Tea Market Volume K Tons Forecast, by Country 2019 & 2032
- Table 47: United States Canada Mexico RTD Tea Market Revenue (Million) Forecast, by Application 2019 & 2032
- Table 48: United States Canada Mexico RTD Tea Market Volume (K Tons) Forecast, by Application 2019 & 2032
- Table 49: Global RTD Tea Market Revenue Million Forecast, by Soft Drink Type 2019 & 2032
- Table 50: Global RTD Tea Market Volume K Tons Forecast, by Soft Drink Type 2019 & 2032
- Table 51: Global RTD Tea Market Revenue Million Forecast, by Packaging Type 2019 & 2032
- Table 52: Global RTD Tea Market Volume K Tons Forecast, by Packaging Type 2019 & 2032
- Table 53: Global RTD Tea Market Revenue Million Forecast, by Distribution Channel 2019 & 2032
- Table 54: Global RTD Tea Market Volume K Tons Forecast, by Distribution Channel 2019 & 2032
- Table 55: Global RTD Tea Market Revenue Million Forecast, by Country 2019 & 2032
- Table 56: Global RTD Tea Market Volume K Tons Forecast, by Country 2019 & 2032
- Table 57: United States RTD Tea Market Revenue (Million) Forecast, by Application 2019 & 2032
- Table 58: United States RTD Tea Market Volume (K Tons) Forecast, by Application 2019 & 2032
- Table 59: Canada RTD Tea Market Revenue (Million) Forecast, by Application 2019 & 2032
- Table 60: Canada RTD Tea Market Volume (K Tons) Forecast, by Application 2019 & 2032
- Table 61: Mexico RTD Tea Market Revenue (Million) Forecast, by Application 2019 & 2032
- Table 62: Mexico RTD Tea Market Volume (K Tons) Forecast, by Application 2019 & 2032
- Table 63: Global RTD Tea Market Revenue Million Forecast, by Soft Drink Type 2019 & 2032
- Table 64: Global RTD Tea Market Volume K Tons Forecast, by Soft Drink Type 2019 & 2032
- Table 65: Global RTD Tea Market Revenue Million Forecast, by Packaging Type 2019 & 2032
- Table 66: Global RTD Tea Market Volume K Tons Forecast, by Packaging Type 2019 & 2032
- Table 67: Global RTD Tea Market Revenue Million Forecast, by Distribution Channel 2019 & 2032
- Table 68: Global RTD Tea Market Volume K Tons Forecast, by Distribution Channel 2019 & 2032
- Table 69: Global RTD Tea Market Revenue Million Forecast, by Country 2019 & 2032
- Table 70: Global RTD Tea Market Volume K Tons Forecast, by Country 2019 & 2032
- Table 71: Brazil RTD Tea Market Revenue (Million) Forecast, by Application 2019 & 2032
- Table 72: Brazil RTD Tea Market Volume (K Tons) Forecast, by Application 2019 & 2032
- Table 73: Argentina RTD Tea Market Revenue (Million) Forecast, by Application 2019 & 2032
- Table 74: Argentina RTD Tea Market Volume (K Tons) Forecast, by Application 2019 & 2032
- Table 75: Rest of South America RTD Tea Market Revenue (Million) Forecast, by Application 2019 & 2032
- Table 76: Rest of South America RTD Tea Market Volume (K Tons) Forecast, by Application 2019 & 2032
- Table 77: Global RTD Tea Market Revenue Million Forecast, by Soft Drink Type 2019 & 2032
- Table 78: Global RTD Tea Market Volume K Tons Forecast, by Soft Drink Type 2019 & 2032
- Table 79: Global RTD Tea Market Revenue Million Forecast, by Packaging Type 2019 & 2032
- Table 80: Global RTD Tea Market Volume K Tons Forecast, by Packaging Type 2019 & 2032
- Table 81: Global RTD Tea Market Revenue Million Forecast, by Distribution Channel 2019 & 2032
- Table 82: Global RTD Tea Market Volume K Tons Forecast, by Distribution Channel 2019 & 2032
- Table 83: Global RTD Tea Market Revenue Million Forecast, by Country 2019 & 2032
- Table 84: Global RTD Tea Market Volume K Tons Forecast, by Country 2019 & 2032
- Table 85: United Kingdom RTD Tea Market Revenue (Million) Forecast, by Application 2019 & 2032
- Table 86: United Kingdom RTD Tea Market Volume (K Tons) Forecast, by Application 2019 & 2032
- Table 87: Germany RTD Tea Market Revenue (Million) Forecast, by Application 2019 & 2032
- Table 88: Germany RTD Tea Market Volume (K Tons) Forecast, by Application 2019 & 2032
- Table 89: France RTD Tea Market Revenue (Million) Forecast, by Application 2019 & 2032
- Table 90: France RTD Tea Market Volume (K Tons) Forecast, by Application 2019 & 2032
- Table 91: Italy RTD Tea Market Revenue (Million) Forecast, by Application 2019 & 2032
- Table 92: Italy RTD Tea Market Volume (K Tons) Forecast, by Application 2019 & 2032
- Table 93: Spain RTD Tea Market Revenue (Million) Forecast, by Application 2019 & 2032
- Table 94: Spain RTD Tea Market Volume (K Tons) Forecast, by Application 2019 & 2032
- Table 95: Russia RTD Tea Market Revenue (Million) Forecast, by Application 2019 & 2032
- Table 96: Russia RTD Tea Market Volume (K Tons) Forecast, by Application 2019 & 2032
- Table 97: Benelux RTD Tea Market Revenue (Million) Forecast, by Application 2019 & 2032
- Table 98: Benelux RTD Tea Market Volume (K Tons) Forecast, by Application 2019 & 2032
- Table 99: Nordics RTD Tea Market Revenue (Million) Forecast, by Application 2019 & 2032
- Table 100: Nordics RTD Tea Market Volume (K Tons) Forecast, by Application 2019 & 2032
- Table 101: Rest of Europe RTD Tea Market Revenue (Million) Forecast, by Application 2019 & 2032
- Table 102: Rest of Europe RTD Tea Market Volume (K Tons) Forecast, by Application 2019 & 2032
- Table 103: Global RTD Tea Market Revenue Million Forecast, by Soft Drink Type 2019 & 2032
- Table 104: Global RTD Tea Market Volume K Tons Forecast, by Soft Drink Type 2019 & 2032
- Table 105: Global RTD Tea Market Revenue Million Forecast, by Packaging Type 2019 & 2032
- Table 106: Global RTD Tea Market Volume K Tons Forecast, by Packaging Type 2019 & 2032
- Table 107: Global RTD Tea Market Revenue Million Forecast, by Distribution Channel 2019 & 2032
- Table 108: Global RTD Tea Market Volume K Tons Forecast, by Distribution Channel 2019 & 2032
- Table 109: Global RTD Tea Market Revenue Million Forecast, by Country 2019 & 2032
- Table 110: Global RTD Tea Market Volume K Tons Forecast, by Country 2019 & 2032
- Table 111: Turkey RTD Tea Market Revenue (Million) Forecast, by Application 2019 & 2032
- Table 112: Turkey RTD Tea Market Volume (K Tons) Forecast, by Application 2019 & 2032
- Table 113: Israel RTD Tea Market Revenue (Million) Forecast, by Application 2019 & 2032
- Table 114: Israel RTD Tea Market Volume (K Tons) Forecast, by Application 2019 & 2032
- Table 115: GCC RTD Tea Market Revenue (Million) Forecast, by Application 2019 & 2032
- Table 116: GCC RTD Tea Market Volume (K Tons) Forecast, by Application 2019 & 2032
- Table 117: North Africa RTD Tea Market Revenue (Million) Forecast, by Application 2019 & 2032
- Table 118: North Africa RTD Tea Market Volume (K Tons) Forecast, by Application 2019 & 2032
- Table 119: South Africa RTD Tea Market Revenue (Million) Forecast, by Application 2019 & 2032
- Table 120: South Africa RTD Tea Market Volume (K Tons) Forecast, by Application 2019 & 2032
- Table 121: Rest of Middle East & Africa RTD Tea Market Revenue (Million) Forecast, by Application 2019 & 2032
- Table 122: Rest of Middle East & Africa RTD Tea Market Volume (K Tons) Forecast, by Application 2019 & 2032
- Table 123: Global RTD Tea Market Revenue Million Forecast, by Soft Drink Type 2019 & 2032
- Table 124: Global RTD Tea Market Volume K Tons Forecast, by Soft Drink Type 2019 & 2032
- Table 125: Global RTD Tea Market Revenue Million Forecast, by Packaging Type 2019 & 2032
- Table 126: Global RTD Tea Market Volume K Tons Forecast, by Packaging Type 2019 & 2032
- Table 127: Global RTD Tea Market Revenue Million Forecast, by Distribution Channel 2019 & 2032
- Table 128: Global RTD Tea Market Volume K Tons Forecast, by Distribution Channel 2019 & 2032
- Table 129: Global RTD Tea Market Revenue Million Forecast, by Country 2019 & 2032
- Table 130: Global RTD Tea Market Volume K Tons Forecast, by Country 2019 & 2032
- Table 131: China RTD Tea Market Revenue (Million) Forecast, by Application 2019 & 2032
- Table 132: China RTD Tea Market Volume (K Tons) Forecast, by Application 2019 & 2032
- Table 133: India RTD Tea Market Revenue (Million) Forecast, by Application 2019 & 2032
- Table 134: India RTD Tea Market Volume (K Tons) Forecast, by Application 2019 & 2032
- Table 135: Japan RTD Tea Market Revenue (Million) Forecast, by Application 2019 & 2032
- Table 136: Japan RTD Tea Market Volume (K Tons) Forecast, by Application 2019 & 2032
- Table 137: South Korea RTD Tea Market Revenue (Million) Forecast, by Application 2019 & 2032
- Table 138: South Korea RTD Tea Market Volume (K Tons) Forecast, by Application 2019 & 2032
- Table 139: ASEAN RTD Tea Market Revenue (Million) Forecast, by Application 2019 & 2032
- Table 140: ASEAN RTD Tea Market Volume (K Tons) Forecast, by Application 2019 & 2032
- Table 141: Oceania RTD Tea Market Revenue (Million) Forecast, by Application 2019 & 2032
- Table 142: Oceania RTD Tea Market Volume (K Tons) Forecast, by Application 2019 & 2032
- Table 143: Rest of Asia Pacific RTD Tea Market Revenue (Million) Forecast, by Application 2019 & 2032
- Table 144: Rest of Asia Pacific RTD Tea Market Volume (K Tons) Forecast, by Application 2019 & 2032
Frequently Asked Questions
1. What is the projected Compound Annual Growth Rate (CAGR) of the RTD Tea Market?
The projected CAGR is approximately 1.50%.
2. Which companies are prominent players in the RTD Tea Market?
Key companies in the market include Arizona Beverages USA LLC, Nestle S A, Asahi Group Holdings Ltd, Ito En Ltd, PepsiCo Inc, Tata Consumer Products Ltd, PT Anggada Putra Rekso Mulia, Suntory Holdings Limited, Keurig Dr Pepper Inc, Tingyi (Cayman Islands) Holding Corporation, The Coca-Cola Company, Hangzhou Wahaha Group Co Ltd, Uni-President Enterprises Corp, Kirin Holdings Company Limited, Thai Beverages PCL, Reily Foods Company, Sapporo Holdings Limited.
3. What are the main segments of the RTD Tea Market?
The market segments include Soft Drink Type, Packaging Type, Distribution Channel.
4. Can you provide details about the market size?
The market size is estimated to be USD 22490 Million as of 2022.
5. What are some drivers contributing to market growth?
Increasing demand for meat alternatives.
6. What are the notable trends driving market growth?
OTHER KEY INDUSTRY TRENDS COVERED IN THE REPORT.
7. Are there any restraints impacting market growth?
Presence of numerous alternatives in the plant proteins.
8. Can you provide examples of recent developments in the market?
February 2024: Rockstar® Energy Drink, a subsidiary of PepsiCo, Inc unveiled “Rockstar Focus™,” a new line of energy drinks delivering energy & mental boost made with innovative ingredients like Lion’s Mane, a mushroom used in traditional eastern cultures, and providing 200 mg of caffeine. These products are avilable in retail channels in Saudi Arabia, UAE and Qatar.November 2023: The Coca-Cola Company's brand ChaiChun brought exquisite teas to Delhi with its new store, The ChaiChun Store, expanding its business.January 2023: Lipton Tea has announced a new partnership with Full Cart, a program within nonprofit U.S. Hunger, and a virtual food pantry to make heart-friendly nutrition and grocery assistance more accessible.
9. What pricing options are available for accessing the report?
Pricing options include single-user, multi-user, and enterprise licenses priced at USD 3800, USD 4500, and USD 5800 respectively.
10. Is the market size provided in terms of value or volume?
The market size is provided in terms of value, measured in Million and volume, measured in K Tons.
11. Are there any specific market keywords associated with the report?
Yes, the market keyword associated with the report is "RTD Tea Market," which aids in identifying and referencing the specific market segment covered.
12. How do I determine which pricing option suits my needs best?
The pricing options vary based on user requirements and access needs. Individual users may opt for single-user licenses, while businesses requiring broader access may choose multi-user or enterprise licenses for cost-effective access to the report.
13. Are there any additional resources or data provided in the RTD Tea Market report?
While the report offers comprehensive insights, it's advisable to review the specific contents or supplementary materials provided to ascertain if additional resources or data are available.
14. How can I stay updated on further developments or reports in the RTD Tea Market?
To stay informed about further developments, trends, and reports in the RTD Tea Market, consider subscribing to industry newsletters, following relevant companies and organizations, or regularly checking reputable industry news sources and publications.
Methodology
Step 1 - Identification of Relevant Samples Size from Population Database


Step 2 - Approaches for Defining Global Market Size (Value, Volume* & Price*)

Note*: In applicable scenarios
Step 3 - Data Sources
Primary Research
- Web Analytics
- Survey Reports
- Research Institute
- Latest Research Reports
- Opinion Leaders
Secondary Research
- Annual Reports
- White Paper
- Latest Press Release
- Industry Association
- Paid Database
- Investor Presentations

Step 4 - Data Triangulation
Involves using different sources of information in order to increase the validity of a study
These sources are likely to be stakeholders in a program - participants, other researchers, program staff, other community members, and so on.
Then we put all data in single framework & apply various statistical tools to find out the dynamic on the market.
During the analysis stage, feedback from the stakeholder groups would be compared to determine areas of agreement as well as areas of divergence


