
Key Insights
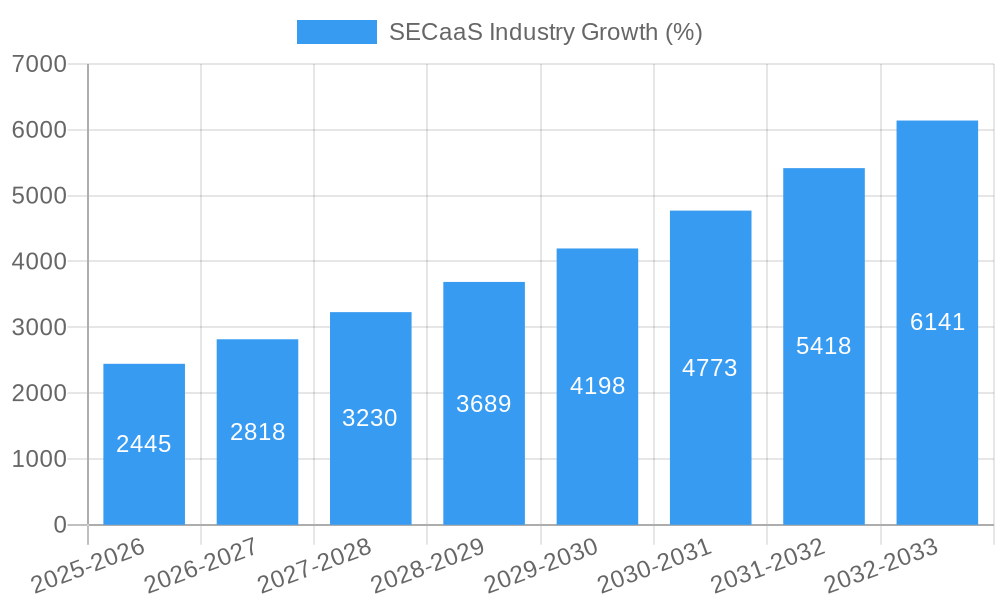
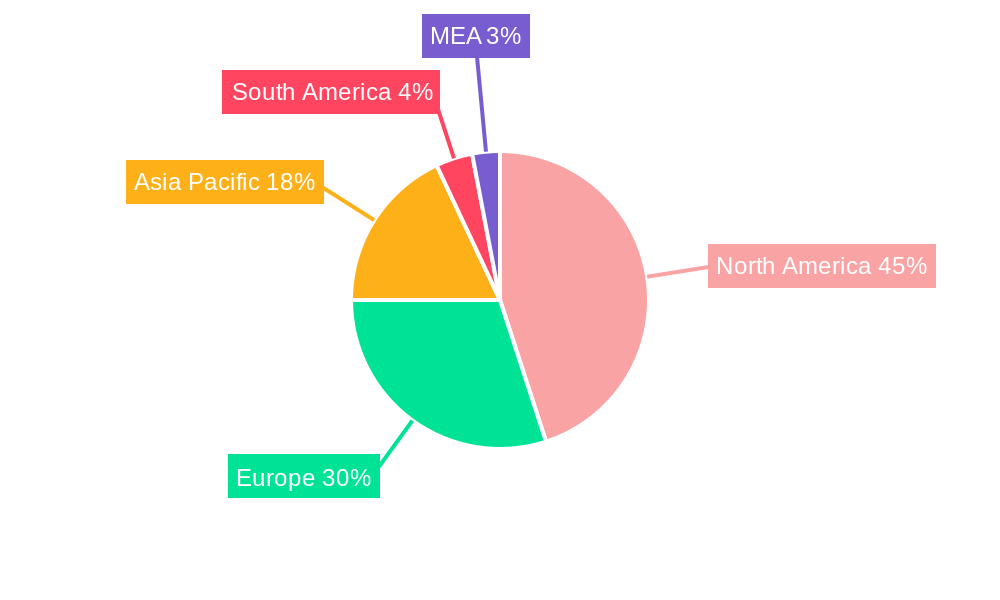
The Secure Cloud Access Security Broker (SECaaS) market is experiencing robust growth, driven by the increasing adoption of cloud services and the rising need for enhanced security measures to protect sensitive data. The market's Compound Annual Growth Rate (CAGR) of 16.30% from 2019 to 2024 indicates a significant expansion, projected to continue in the forecast period (2025-2033). This growth is fueled by several key factors. The proliferation of remote work models necessitates secure access to cloud applications, driving demand for SECaaS solutions. Furthermore, the increasing sophistication of cyber threats and the stringent regulatory requirements surrounding data privacy are compelling organizations of all sizes to invest in robust security solutions like SECaaS. The market is segmented by solution type (Identity and Access Management, Secure Email Gateway, Secure Web Gateway, Vulnerability Management, Security Information and Event Management, Application Security Testing, and Other Solutions) and organization size (Small and Medium Enterprises and Large Enterprises). Large enterprises currently dominate the market due to their higher budgets and complex IT infrastructures, but the SME segment is showing rapid growth due to increasing cloud adoption and awareness of security risks. Geographically, North America currently holds a significant market share, followed by Europe and Asia Pacific. However, the Asia Pacific region is poised for significant growth due to rapid digital transformation and increasing cloud adoption across various sectors.
The competitive landscape of the SECaaS market is characterized by both established players and emerging vendors. Companies like IBM, Cisco, McAfee, and others offer comprehensive SECaaS solutions. However, several smaller, specialized vendors are gaining traction by offering niche solutions or focusing on specific market segments. While the market presents significant opportunities for growth, challenges remain. Integration complexities with existing IT infrastructure, the need for skilled security professionals to manage SECaaS solutions, and concerns about the cost of implementation and ongoing maintenance are potential restraints. To overcome these challenges, vendors are focusing on developing user-friendly interfaces, offering flexible pricing models, and providing robust customer support. Looking forward, the SECaaS market is expected to maintain its high growth trajectory, driven by continuous innovation, evolving security threats, and the ever-increasing reliance on cloud technologies. The focus will likely shift towards AI-powered threat detection, improved data loss prevention capabilities, and enhanced compliance features.
SECaaS Industry Market Report: 2019-2033
This comprehensive report provides a detailed analysis of the Security-as-a-Service (SECaaS) industry, offering invaluable insights for industry professionals, investors, and strategic decision-makers. Covering the period from 2019 to 2033, with a base year of 2025 and a forecast period of 2025-2033, this report delivers actionable intelligence on market size, growth drivers, competitive landscape, and future trends. The market is valued at $XX Million in 2025 and is projected to reach $XX Million by 2033, exhibiting a CAGR of XX%.
SECaaS Industry Market Structure & Innovation Trends
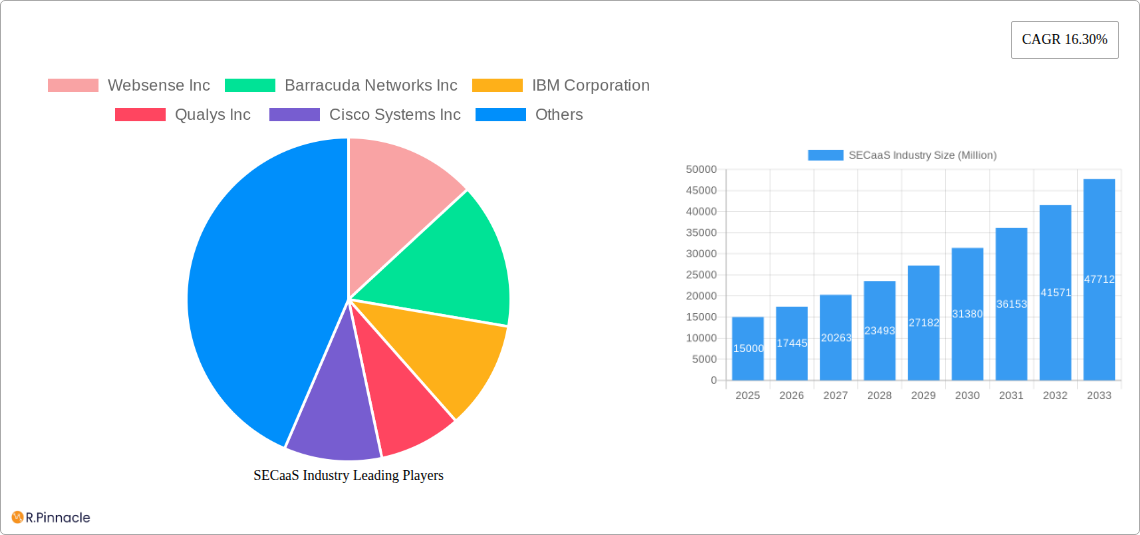
The SECaaS market is characterized by a moderately concentrated structure, with several major players holding significant market share. Companies like IBM Corporation, Cisco Systems Inc, Proofpoint Inc, and Trend Micro Incorporated are key players, although precise market share data requires further proprietary analysis within the full report. Innovation is driven by the increasing need for robust cybersecurity solutions, coupled with the rising adoption of cloud computing and the proliferation of sophisticated cyber threats. Regulatory frameworks like GDPR and CCPA are influencing the development and adoption of SECaaS solutions, forcing companies to prioritize data privacy and security. The report analyzes the impact of M&A activities, with deal values reaching $XX Million in the past five years, and further details available within the full report. Key factors affecting the market structure include product differentiation, technological advancements, and pricing strategies. The end-user demographics span small and medium enterprises (SMEs), large enterprises, and government organizations, each having specific security needs driving adoption across different segments.
SECaaS Industry Market Dynamics & Trends
The SECaaS market is experiencing robust growth, driven by several key factors. The increasing prevalence of cyberattacks, rising adoption of cloud-based services, and the growing need for cost-effective security solutions are major contributors to this expansion. Technological disruptions, such as the emergence of AI and machine learning in cybersecurity, are further shaping the market landscape. Consumer preferences are shifting towards flexible, subscription-based security models, which align perfectly with the SECaaS offerings. Competitive dynamics are intense, with companies vying for market share through product innovation, strategic partnerships, and aggressive marketing campaigns. The report details these dynamics through a deeper analysis of CAGR and market penetration rates.
Dominant Regions & Segments in SECaaS Industry
- Leading Region: North America currently holds the largest market share due to its robust technological infrastructure, high adoption of cloud services, and strong regulatory environment.
- Leading Segment (By Solution): Secure Web Gateway currently dominates the market due to the increasing reliance on internet-based applications and the rising threat of web-borne attacks.
- Leading Segment (By Organization Size): Large Enterprises are the primary adopters of SECaaS solutions, owing to their substantial IT budgets and heightened security concerns.
Key Drivers:
- North America: Strong technological infrastructure, high cybersecurity awareness, and robust regulatory frameworks.
- Europe: Increasing regulatory pressure (GDPR), rising digital transformation initiatives, and growing adoption of cloud services.
- Asia-Pacific: Rapid economic growth, expanding IT infrastructure, and increasing government investments in cybersecurity.
The dominance analysis within the full report further explores the interplay between economic policies, infrastructure development, and government regulations.
SECaaS Industry Product Innovations
Recent product innovations in SECaaS emphasize advanced threat detection capabilities, automated security responses, and improved integration with existing IT infrastructure. The use of AI and machine learning in threat detection and response is becoming increasingly prevalent. This focus on automation and improved threat detection enhances efficiency and reduces the burden on security personnel. The market is witnessing a significant push towards offering more comprehensive, integrated security solutions rather than disparate point solutions. The success of these new products is primarily driven by their ability to effectively address the evolving cyber threat landscape and adapt to changing customer needs.
Report Scope & Segmentation Analysis
This report segments the SECaaS market by solution (Identity and Access Management, Secure Email Gateway, Secure Web Gateway, Vulnerability Management, Security Information and Event Management, Application Security Testing, Other Solutions) and by organization size (Small and Medium Enterprises, Large Enterprises). Each segment is analyzed in terms of market size, growth projections, and competitive dynamics. Growth projections for each segment are provided, taking into account the projected growth of the overall market and segment-specific factors. The full report contains detailed market sizing and competitive analyses for each segment.
Key Drivers of SECaaS Industry Growth
The SECaaS market's growth is primarily fueled by several factors: the escalating frequency and severity of cyberattacks, the rising adoption of cloud-based services and remote work models, increasing demand for cost-effective and scalable security solutions, and the growing awareness of data privacy and security regulations. Technological advancements such as AI and machine learning are further enhancing the capabilities of SECaaS offerings, contributing to the market's upward trajectory.
Challenges in the SECaaS Industry Sector
The SECaaS industry faces several challenges, including maintaining security in the face of evolving cyber threats, managing data privacy concerns in compliance with regulations like GDPR and CCPA, integrating SECaaS solutions with existing IT infrastructure, and managing the cost of providing high-quality security services. These challenges impact market growth by potentially limiting adoption or increasing the overall costs for users. Specific quantifiable impacts are detailed in the full report.
Emerging Opportunities in SECaaS Industry
Emerging opportunities abound in the SECaaS market, primarily driven by the increasing adoption of IoT devices, the rise of edge computing, and the growing need for security solutions tailored to specific industry verticals. The development and deployment of next-generation security technologies, such as AI-powered threat intelligence, offer substantial opportunities for growth and innovation within the industry. Exploring these new markets and technologies is crucial for organizations seeking a competitive edge.
Leading Players in the SECaaS Industry Market
- Websense Inc
- Barracuda Networks Inc
- IBM Corporation
- Qualys Inc
- Cisco Systems Inc
- Proofpoint Inc
- Trend Micro Incorporated
- McAfee (Intel)
- ZSCaler Inc
- Symantec Corporation
- Sophos PLC
- Dell Technologies
Key Developments in SECaaS Industry
- June 2022: Allot Ltd. partnered with Proximus to launch cybersecurity services for mobile residential customers in Luxembourg, highlighting the expanding market for SECaaS within the telecom sector.
- February 2022: Nokia launched new SaaS services focused on analytics and security, indicating a broader shift towards cloud-based security solutions and emphasizing the growing importance of agility and cost-effectiveness in the sector.
Future Outlook for SECaaS Industry Market
The future of the SECaaS market is bright, driven by the continuous evolution of cyber threats and the increasing demand for robust and scalable security solutions. Strategic opportunities lie in leveraging emerging technologies, such as AI and machine learning, to enhance security capabilities and improve customer experience. Further market expansion is expected, particularly in emerging economies and across diverse industry sectors as digital transformation continues to accelerate.
SECaaS Industry Segmentation
-
1. Solution
- 1.1. Identity and Access Management
- 1.2. Secure Email Gateway
- 1.3. Secure Web Gateway
- 1.4. Vulnerability Management
- 1.5. Security Information and Event Management
- 1.6. Application Security Testing
- 1.7. Other Solutions
-
2. Organization Size
- 2.1. Small and Medium Enterprises
- 2.2. Large Enterprises
SECaaS Industry Segmentation By Geography
-
1. North America
- 1.1. United States
- 1.2. Canada
-
2. Europe
- 2.1. United Kingdom
- 2.2. Germany
- 2.3. France
- 2.4. Rest of Europe
-
3. Asia Pacific
- 3.1. China
- 3.2. India
- 3.3. Japan
- 3.4. Australia
- 3.5. Rest of Asia Pacific
- 4. Latin America
- 5. Middle East
SECaaS Industry REPORT HIGHLIGHTS
| Aspects | Details |
|---|---|
| Study Period | 2019-2033 |
| Base Year | 2024 |
| Estimated Year | 2025 |
| Forecast Period | 2025-2033 |
| Historical Period | 2019-2024 |
| Growth Rate | CAGR of 16.30% from 2019-2033 |
| Segmentation |
|
Table of Contents
- 1. Introduction
- 1.1. Research Scope
- 1.2. Market Segmentation
- 1.3. Research Methodology
- 1.4. Definitions and Assumptions
- 2. Executive Summary
- 2.1. Introduction
- 3. Market Dynamics
- 3.1. Introduction
- 3.2. Market Drivers
- 3.2.1. Increasing Need for Advanced Cloud Security Solutions; Increasing Trend of BYOD in Enterprises
- 3.3. Market Restrains
- 3.3.1. Vulnerability of Cloud-Based Applications to Cyber Crimes
- 3.4. Market Trends
- 3.4.1. Secure Email Gateway is Expected to Hold a Significant Share
- 4. Market Factor Analysis
- 4.1. Porters Five Forces
- 4.2. Supply/Value Chain
- 4.3. PESTEL analysis
- 4.4. Market Entropy
- 4.5. Patent/Trademark Analysis
- 5. Global SECaaS Industry Analysis, Insights and Forecast, 2019-2031
- 5.1. Market Analysis, Insights and Forecast - by Solution
- 5.1.1. Identity and Access Management
- 5.1.2. Secure Email Gateway
- 5.1.3. Secure Web Gateway
- 5.1.4. Vulnerability Management
- 5.1.5. Security Information and Event Management
- 5.1.6. Application Security Testing
- 5.1.7. Other Solutions
- 5.2. Market Analysis, Insights and Forecast - by Organization Size
- 5.2.1. Small and Medium Enterprises
- 5.2.2. Large Enterprises
- 5.3. Market Analysis, Insights and Forecast - by Region
- 5.3.1. North America
- 5.3.2. Europe
- 5.3.3. Asia Pacific
- 5.3.4. Latin America
- 5.3.5. Middle East
- 5.1. Market Analysis, Insights and Forecast - by Solution
- 6. North America SECaaS Industry Analysis, Insights and Forecast, 2019-2031
- 6.1. Market Analysis, Insights and Forecast - by Solution
- 6.1.1. Identity and Access Management
- 6.1.2. Secure Email Gateway
- 6.1.3. Secure Web Gateway
- 6.1.4. Vulnerability Management
- 6.1.5. Security Information and Event Management
- 6.1.6. Application Security Testing
- 6.1.7. Other Solutions
- 6.2. Market Analysis, Insights and Forecast - by Organization Size
- 6.2.1. Small and Medium Enterprises
- 6.2.2. Large Enterprises
- 6.1. Market Analysis, Insights and Forecast - by Solution
- 7. Europe SECaaS Industry Analysis, Insights and Forecast, 2019-2031
- 7.1. Market Analysis, Insights and Forecast - by Solution
- 7.1.1. Identity and Access Management
- 7.1.2. Secure Email Gateway
- 7.1.3. Secure Web Gateway
- 7.1.4. Vulnerability Management
- 7.1.5. Security Information and Event Management
- 7.1.6. Application Security Testing
- 7.1.7. Other Solutions
- 7.2. Market Analysis, Insights and Forecast - by Organization Size
- 7.2.1. Small and Medium Enterprises
- 7.2.2. Large Enterprises
- 7.1. Market Analysis, Insights and Forecast - by Solution
- 8. Asia Pacific SECaaS Industry Analysis, Insights and Forecast, 2019-2031
- 8.1. Market Analysis, Insights and Forecast - by Solution
- 8.1.1. Identity and Access Management
- 8.1.2. Secure Email Gateway
- 8.1.3. Secure Web Gateway
- 8.1.4. Vulnerability Management
- 8.1.5. Security Information and Event Management
- 8.1.6. Application Security Testing
- 8.1.7. Other Solutions
- 8.2. Market Analysis, Insights and Forecast - by Organization Size
- 8.2.1. Small and Medium Enterprises
- 8.2.2. Large Enterprises
- 8.1. Market Analysis, Insights and Forecast - by Solution
- 9. Latin America SECaaS Industry Analysis, Insights and Forecast, 2019-2031
- 9.1. Market Analysis, Insights and Forecast - by Solution
- 9.1.1. Identity and Access Management
- 9.1.2. Secure Email Gateway
- 9.1.3. Secure Web Gateway
- 9.1.4. Vulnerability Management
- 9.1.5. Security Information and Event Management
- 9.1.6. Application Security Testing
- 9.1.7. Other Solutions
- 9.2. Market Analysis, Insights and Forecast - by Organization Size
- 9.2.1. Small and Medium Enterprises
- 9.2.2. Large Enterprises
- 9.1. Market Analysis, Insights and Forecast - by Solution
- 10. Middle East SECaaS Industry Analysis, Insights and Forecast, 2019-2031
- 10.1. Market Analysis, Insights and Forecast - by Solution
- 10.1.1. Identity and Access Management
- 10.1.2. Secure Email Gateway
- 10.1.3. Secure Web Gateway
- 10.1.4. Vulnerability Management
- 10.1.5. Security Information and Event Management
- 10.1.6. Application Security Testing
- 10.1.7. Other Solutions
- 10.2. Market Analysis, Insights and Forecast - by Organization Size
- 10.2.1. Small and Medium Enterprises
- 10.2.2. Large Enterprises
- 10.1. Market Analysis, Insights and Forecast - by Solution
- 11. North America SECaaS Industry Analysis, Insights and Forecast, 2019-2031
- 11.1. Market Analysis, Insights and Forecast - By Country/Sub-region
- 11.1.1 United States
- 11.1.2 Canada
- 11.1.3 Mexico
- 12. Europe SECaaS Industry Analysis, Insights and Forecast, 2019-2031
- 12.1. Market Analysis, Insights and Forecast - By Country/Sub-region
- 12.1.1 Germany
- 12.1.2 United Kingdom
- 12.1.3 France
- 12.1.4 Spain
- 12.1.5 Italy
- 12.1.6 Spain
- 12.1.7 Belgium
- 12.1.8 Netherland
- 12.1.9 Nordics
- 12.1.10 Rest of Europe
- 13. Asia Pacific SECaaS Industry Analysis, Insights and Forecast, 2019-2031
- 13.1. Market Analysis, Insights and Forecast - By Country/Sub-region
- 13.1.1 China
- 13.1.2 Japan
- 13.1.3 India
- 13.1.4 South Korea
- 13.1.5 Southeast Asia
- 13.1.6 Australia
- 13.1.7 Indonesia
- 13.1.8 Phillipes
- 13.1.9 Singapore
- 13.1.10 Thailandc
- 13.1.11 Rest of Asia Pacific
- 14. South America SECaaS Industry Analysis, Insights and Forecast, 2019-2031
- 14.1. Market Analysis, Insights and Forecast - By Country/Sub-region
- 14.1.1 Brazil
- 14.1.2 Argentina
- 14.1.3 Peru
- 14.1.4 Chile
- 14.1.5 Colombia
- 14.1.6 Ecuador
- 14.1.7 Venezuela
- 14.1.8 Rest of South America
- 15. North America SECaaS Industry Analysis, Insights and Forecast, 2019-2031
- 15.1. Market Analysis, Insights and Forecast - By Country/Sub-region
- 15.1.1 United States
- 15.1.2 Canada
- 15.1.3 Mexico
- 16. MEA SECaaS Industry Analysis, Insights and Forecast, 2019-2031
- 16.1. Market Analysis, Insights and Forecast - By Country/Sub-region
- 16.1.1 United Arab Emirates
- 16.1.2 Saudi Arabia
- 16.1.3 South Africa
- 16.1.4 Rest of Middle East and Africa
- 17. Competitive Analysis
- 17.1. Global Market Share Analysis 2024
- 17.2. Company Profiles
- 17.2.1 Websense Inc
- 17.2.1.1. Overview
- 17.2.1.2. Products
- 17.2.1.3. SWOT Analysis
- 17.2.1.4. Recent Developments
- 17.2.1.5. Financials (Based on Availability)
- 17.2.2 Barracuda Networks Inc
- 17.2.2.1. Overview
- 17.2.2.2. Products
- 17.2.2.3. SWOT Analysis
- 17.2.2.4. Recent Developments
- 17.2.2.5. Financials (Based on Availability)
- 17.2.3 IBM Corporation
- 17.2.3.1. Overview
- 17.2.3.2. Products
- 17.2.3.3. SWOT Analysis
- 17.2.3.4. Recent Developments
- 17.2.3.5. Financials (Based on Availability)
- 17.2.4 Qualys Inc
- 17.2.4.1. Overview
- 17.2.4.2. Products
- 17.2.4.3. SWOT Analysis
- 17.2.4.4. Recent Developments
- 17.2.4.5. Financials (Based on Availability)
- 17.2.5 Cisco Systems Inc
- 17.2.5.1. Overview
- 17.2.5.2. Products
- 17.2.5.3. SWOT Analysis
- 17.2.5.4. Recent Developments
- 17.2.5.5. Financials (Based on Availability)
- 17.2.6 Proofpoint Inc
- 17.2.6.1. Overview
- 17.2.6.2. Products
- 17.2.6.3. SWOT Analysis
- 17.2.6.4. Recent Developments
- 17.2.6.5. Financials (Based on Availability)
- 17.2.7 Trend Micro Incorporated
- 17.2.7.1. Overview
- 17.2.7.2. Products
- 17.2.7.3. SWOT Analysis
- 17.2.7.4. Recent Developments
- 17.2.7.5. Financials (Based on Availability)
- 17.2.8 McAfee (Intel)
- 17.2.8.1. Overview
- 17.2.8.2. Products
- 17.2.8.3. SWOT Analysis
- 17.2.8.4. Recent Developments
- 17.2.8.5. Financials (Based on Availability)
- 17.2.9 ZSCaler Inc
- 17.2.9.1. Overview
- 17.2.9.2. Products
- 17.2.9.3. SWOT Analysis
- 17.2.9.4. Recent Developments
- 17.2.9.5. Financials (Based on Availability)
- 17.2.10 Symantec Corporation
- 17.2.10.1. Overview
- 17.2.10.2. Products
- 17.2.10.3. SWOT Analysis
- 17.2.10.4. Recent Developments
- 17.2.10.5. Financials (Based on Availability)
- 17.2.11 Sophos PLC
- 17.2.11.1. Overview
- 17.2.11.2. Products
- 17.2.11.3. SWOT Analysis
- 17.2.11.4. Recent Developments
- 17.2.11.5. Financials (Based on Availability)
- 17.2.12 Dell Technologies
- 17.2.12.1. Overview
- 17.2.12.2. Products
- 17.2.12.3. SWOT Analysis
- 17.2.12.4. Recent Developments
- 17.2.12.5. Financials (Based on Availability)
- 17.2.1 Websense Inc
List of Figures
- Figure 1: Global SECaaS Industry Revenue Breakdown (Million, %) by Region 2024 & 2032
- Figure 2: North America SECaaS Industry Revenue (Million), by Country 2024 & 2032
- Figure 3: North America SECaaS Industry Revenue Share (%), by Country 2024 & 2032
- Figure 4: Europe SECaaS Industry Revenue (Million), by Country 2024 & 2032
- Figure 5: Europe SECaaS Industry Revenue Share (%), by Country 2024 & 2032
- Figure 6: Asia Pacific SECaaS Industry Revenue (Million), by Country 2024 & 2032
- Figure 7: Asia Pacific SECaaS Industry Revenue Share (%), by Country 2024 & 2032
- Figure 8: South America SECaaS Industry Revenue (Million), by Country 2024 & 2032
- Figure 9: South America SECaaS Industry Revenue Share (%), by Country 2024 & 2032
- Figure 10: North America SECaaS Industry Revenue (Million), by Country 2024 & 2032
- Figure 11: North America SECaaS Industry Revenue Share (%), by Country 2024 & 2032
- Figure 12: MEA SECaaS Industry Revenue (Million), by Country 2024 & 2032
- Figure 13: MEA SECaaS Industry Revenue Share (%), by Country 2024 & 2032
- Figure 14: North America SECaaS Industry Revenue (Million), by Solution 2024 & 2032
- Figure 15: North America SECaaS Industry Revenue Share (%), by Solution 2024 & 2032
- Figure 16: North America SECaaS Industry Revenue (Million), by Organization Size 2024 & 2032
- Figure 17: North America SECaaS Industry Revenue Share (%), by Organization Size 2024 & 2032
- Figure 18: North America SECaaS Industry Revenue (Million), by Country 2024 & 2032
- Figure 19: North America SECaaS Industry Revenue Share (%), by Country 2024 & 2032
- Figure 20: Europe SECaaS Industry Revenue (Million), by Solution 2024 & 2032
- Figure 21: Europe SECaaS Industry Revenue Share (%), by Solution 2024 & 2032
- Figure 22: Europe SECaaS Industry Revenue (Million), by Organization Size 2024 & 2032
- Figure 23: Europe SECaaS Industry Revenue Share (%), by Organization Size 2024 & 2032
- Figure 24: Europe SECaaS Industry Revenue (Million), by Country 2024 & 2032
- Figure 25: Europe SECaaS Industry Revenue Share (%), by Country 2024 & 2032
- Figure 26: Asia Pacific SECaaS Industry Revenue (Million), by Solution 2024 & 2032
- Figure 27: Asia Pacific SECaaS Industry Revenue Share (%), by Solution 2024 & 2032
- Figure 28: Asia Pacific SECaaS Industry Revenue (Million), by Organization Size 2024 & 2032
- Figure 29: Asia Pacific SECaaS Industry Revenue Share (%), by Organization Size 2024 & 2032
- Figure 30: Asia Pacific SECaaS Industry Revenue (Million), by Country 2024 & 2032
- Figure 31: Asia Pacific SECaaS Industry Revenue Share (%), by Country 2024 & 2032
- Figure 32: Latin America SECaaS Industry Revenue (Million), by Solution 2024 & 2032
- Figure 33: Latin America SECaaS Industry Revenue Share (%), by Solution 2024 & 2032
- Figure 34: Latin America SECaaS Industry Revenue (Million), by Organization Size 2024 & 2032
- Figure 35: Latin America SECaaS Industry Revenue Share (%), by Organization Size 2024 & 2032
- Figure 36: Latin America SECaaS Industry Revenue (Million), by Country 2024 & 2032
- Figure 37: Latin America SECaaS Industry Revenue Share (%), by Country 2024 & 2032
- Figure 38: Middle East SECaaS Industry Revenue (Million), by Solution 2024 & 2032
- Figure 39: Middle East SECaaS Industry Revenue Share (%), by Solution 2024 & 2032
- Figure 40: Middle East SECaaS Industry Revenue (Million), by Organization Size 2024 & 2032
- Figure 41: Middle East SECaaS Industry Revenue Share (%), by Organization Size 2024 & 2032
- Figure 42: Middle East SECaaS Industry Revenue (Million), by Country 2024 & 2032
- Figure 43: Middle East SECaaS Industry Revenue Share (%), by Country 2024 & 2032
List of Tables
- Table 1: Global SECaaS Industry Revenue Million Forecast, by Region 2019 & 2032
- Table 2: Global SECaaS Industry Revenue Million Forecast, by Solution 2019 & 2032
- Table 3: Global SECaaS Industry Revenue Million Forecast, by Organization Size 2019 & 2032
- Table 4: Global SECaaS Industry Revenue Million Forecast, by Region 2019 & 2032
- Table 5: Global SECaaS Industry Revenue Million Forecast, by Country 2019 & 2032
- Table 6: United States SECaaS Industry Revenue (Million) Forecast, by Application 2019 & 2032
- Table 7: Canada SECaaS Industry Revenue (Million) Forecast, by Application 2019 & 2032
- Table 8: Mexico SECaaS Industry Revenue (Million) Forecast, by Application 2019 & 2032
- Table 9: Global SECaaS Industry Revenue Million Forecast, by Country 2019 & 2032
- Table 10: Germany SECaaS Industry Revenue (Million) Forecast, by Application 2019 & 2032
- Table 11: United Kingdom SECaaS Industry Revenue (Million) Forecast, by Application 2019 & 2032
- Table 12: France SECaaS Industry Revenue (Million) Forecast, by Application 2019 & 2032
- Table 13: Spain SECaaS Industry Revenue (Million) Forecast, by Application 2019 & 2032
- Table 14: Italy SECaaS Industry Revenue (Million) Forecast, by Application 2019 & 2032
- Table 15: Spain SECaaS Industry Revenue (Million) Forecast, by Application 2019 & 2032
- Table 16: Belgium SECaaS Industry Revenue (Million) Forecast, by Application 2019 & 2032
- Table 17: Netherland SECaaS Industry Revenue (Million) Forecast, by Application 2019 & 2032
- Table 18: Nordics SECaaS Industry Revenue (Million) Forecast, by Application 2019 & 2032
- Table 19: Rest of Europe SECaaS Industry Revenue (Million) Forecast, by Application 2019 & 2032
- Table 20: Global SECaaS Industry Revenue Million Forecast, by Country 2019 & 2032
- Table 21: China SECaaS Industry Revenue (Million) Forecast, by Application 2019 & 2032
- Table 22: Japan SECaaS Industry Revenue (Million) Forecast, by Application 2019 & 2032
- Table 23: India SECaaS Industry Revenue (Million) Forecast, by Application 2019 & 2032
- Table 24: South Korea SECaaS Industry Revenue (Million) Forecast, by Application 2019 & 2032
- Table 25: Southeast Asia SECaaS Industry Revenue (Million) Forecast, by Application 2019 & 2032
- Table 26: Australia SECaaS Industry Revenue (Million) Forecast, by Application 2019 & 2032
- Table 27: Indonesia SECaaS Industry Revenue (Million) Forecast, by Application 2019 & 2032
- Table 28: Phillipes SECaaS Industry Revenue (Million) Forecast, by Application 2019 & 2032
- Table 29: Singapore SECaaS Industry Revenue (Million) Forecast, by Application 2019 & 2032
- Table 30: Thailandc SECaaS Industry Revenue (Million) Forecast, by Application 2019 & 2032
- Table 31: Rest of Asia Pacific SECaaS Industry Revenue (Million) Forecast, by Application 2019 & 2032
- Table 32: Global SECaaS Industry Revenue Million Forecast, by Country 2019 & 2032
- Table 33: Brazil SECaaS Industry Revenue (Million) Forecast, by Application 2019 & 2032
- Table 34: Argentina SECaaS Industry Revenue (Million) Forecast, by Application 2019 & 2032
- Table 35: Peru SECaaS Industry Revenue (Million) Forecast, by Application 2019 & 2032
- Table 36: Chile SECaaS Industry Revenue (Million) Forecast, by Application 2019 & 2032
- Table 37: Colombia SECaaS Industry Revenue (Million) Forecast, by Application 2019 & 2032
- Table 38: Ecuador SECaaS Industry Revenue (Million) Forecast, by Application 2019 & 2032
- Table 39: Venezuela SECaaS Industry Revenue (Million) Forecast, by Application 2019 & 2032
- Table 40: Rest of South America SECaaS Industry Revenue (Million) Forecast, by Application 2019 & 2032
- Table 41: Global SECaaS Industry Revenue Million Forecast, by Country 2019 & 2032
- Table 42: United States SECaaS Industry Revenue (Million) Forecast, by Application 2019 & 2032
- Table 43: Canada SECaaS Industry Revenue (Million) Forecast, by Application 2019 & 2032
- Table 44: Mexico SECaaS Industry Revenue (Million) Forecast, by Application 2019 & 2032
- Table 45: Global SECaaS Industry Revenue Million Forecast, by Country 2019 & 2032
- Table 46: United Arab Emirates SECaaS Industry Revenue (Million) Forecast, by Application 2019 & 2032
- Table 47: Saudi Arabia SECaaS Industry Revenue (Million) Forecast, by Application 2019 & 2032
- Table 48: South Africa SECaaS Industry Revenue (Million) Forecast, by Application 2019 & 2032
- Table 49: Rest of Middle East and Africa SECaaS Industry Revenue (Million) Forecast, by Application 2019 & 2032
- Table 50: Global SECaaS Industry Revenue Million Forecast, by Solution 2019 & 2032
- Table 51: Global SECaaS Industry Revenue Million Forecast, by Organization Size 2019 & 2032
- Table 52: Global SECaaS Industry Revenue Million Forecast, by Country 2019 & 2032
- Table 53: United States SECaaS Industry Revenue (Million) Forecast, by Application 2019 & 2032
- Table 54: Canada SECaaS Industry Revenue (Million) Forecast, by Application 2019 & 2032
- Table 55: Global SECaaS Industry Revenue Million Forecast, by Solution 2019 & 2032
- Table 56: Global SECaaS Industry Revenue Million Forecast, by Organization Size 2019 & 2032
- Table 57: Global SECaaS Industry Revenue Million Forecast, by Country 2019 & 2032
- Table 58: United Kingdom SECaaS Industry Revenue (Million) Forecast, by Application 2019 & 2032
- Table 59: Germany SECaaS Industry Revenue (Million) Forecast, by Application 2019 & 2032
- Table 60: France SECaaS Industry Revenue (Million) Forecast, by Application 2019 & 2032
- Table 61: Rest of Europe SECaaS Industry Revenue (Million) Forecast, by Application 2019 & 2032
- Table 62: Global SECaaS Industry Revenue Million Forecast, by Solution 2019 & 2032
- Table 63: Global SECaaS Industry Revenue Million Forecast, by Organization Size 2019 & 2032
- Table 64: Global SECaaS Industry Revenue Million Forecast, by Country 2019 & 2032
- Table 65: China SECaaS Industry Revenue (Million) Forecast, by Application 2019 & 2032
- Table 66: India SECaaS Industry Revenue (Million) Forecast, by Application 2019 & 2032
- Table 67: Japan SECaaS Industry Revenue (Million) Forecast, by Application 2019 & 2032
- Table 68: Australia SECaaS Industry Revenue (Million) Forecast, by Application 2019 & 2032
- Table 69: Rest of Asia Pacific SECaaS Industry Revenue (Million) Forecast, by Application 2019 & 2032
- Table 70: Global SECaaS Industry Revenue Million Forecast, by Solution 2019 & 2032
- Table 71: Global SECaaS Industry Revenue Million Forecast, by Organization Size 2019 & 2032
- Table 72: Global SECaaS Industry Revenue Million Forecast, by Country 2019 & 2032
- Table 73: Global SECaaS Industry Revenue Million Forecast, by Solution 2019 & 2032
- Table 74: Global SECaaS Industry Revenue Million Forecast, by Organization Size 2019 & 2032
- Table 75: Global SECaaS Industry Revenue Million Forecast, by Country 2019 & 2032
Frequently Asked Questions
1. What is the projected Compound Annual Growth Rate (CAGR) of the SECaaS Industry?
The projected CAGR is approximately 16.30%.
2. Which companies are prominent players in the SECaaS Industry?
Key companies in the market include Websense Inc, Barracuda Networks Inc, IBM Corporation, Qualys Inc , Cisco Systems Inc, Proofpoint Inc, Trend Micro Incorporated, McAfee (Intel), ZSCaler Inc, Symantec Corporation, Sophos PLC, Dell Technologies.
3. What are the main segments of the SECaaS Industry?
The market segments include Solution, Organization Size.
4. Can you provide details about the market size?
The market size is estimated to be USD XX Million as of 2022.
5. What are some drivers contributing to market growth?
Increasing Need for Advanced Cloud Security Solutions; Increasing Trend of BYOD in Enterprises.
6. What are the notable trends driving market growth?
Secure Email Gateway is Expected to Hold a Significant Share.
7. Are there any restraints impacting market growth?
Vulnerability of Cloud-Based Applications to Cyber Crimes.
8. Can you provide examples of recent developments in the market?
June 2022: Allot Ltd., a provider of innovative network intelligence and security-as-a-service (SECaaS) solutions for communication service providers (CSPs) and enterprises, declared that communications service provider Proximus, under its Tango brand name, introduced cybersecurity services for its mobile residential customers in Luxembourg based on Allot NetworkSecure.
9. What pricing options are available for accessing the report?
Pricing options include single-user, multi-user, and enterprise licenses priced at USD 4750, USD 5250, and USD 8750 respectively.
10. Is the market size provided in terms of value or volume?
The market size is provided in terms of value, measured in Million.
11. Are there any specific market keywords associated with the report?
Yes, the market keyword associated with the report is "SECaaS Industry," which aids in identifying and referencing the specific market segment covered.
12. How do I determine which pricing option suits my needs best?
The pricing options vary based on user requirements and access needs. Individual users may opt for single-user licenses, while businesses requiring broader access may choose multi-user or enterprise licenses for cost-effective access to the report.
13. Are there any additional resources or data provided in the SECaaS Industry report?
While the report offers comprehensive insights, it's advisable to review the specific contents or supplementary materials provided to ascertain if additional resources or data are available.
14. How can I stay updated on further developments or reports in the SECaaS Industry?
To stay informed about further developments, trends, and reports in the SECaaS Industry, consider subscribing to industry newsletters, following relevant companies and organizations, or regularly checking reputable industry news sources and publications.
Methodology
Step 1 - Identification of Relevant Samples Size from Population Database


Step 2 - Approaches for Defining Global Market Size (Value, Volume* & Price*)

Note*: In applicable scenarios
Step 3 - Data Sources
Primary Research
- Web Analytics
- Survey Reports
- Research Institute
- Latest Research Reports
- Opinion Leaders
Secondary Research
- Annual Reports
- White Paper
- Latest Press Release
- Industry Association
- Paid Database
- Investor Presentations

Step 4 - Data Triangulation
Involves using different sources of information in order to increase the validity of a study
These sources are likely to be stakeholders in a program - participants, other researchers, program staff, other community members, and so on.
Then we put all data in single framework & apply various statistical tools to find out the dynamic on the market.
During the analysis stage, feedback from the stakeholder groups would be compared to determine areas of agreement as well as areas of divergence


