
Key Insights
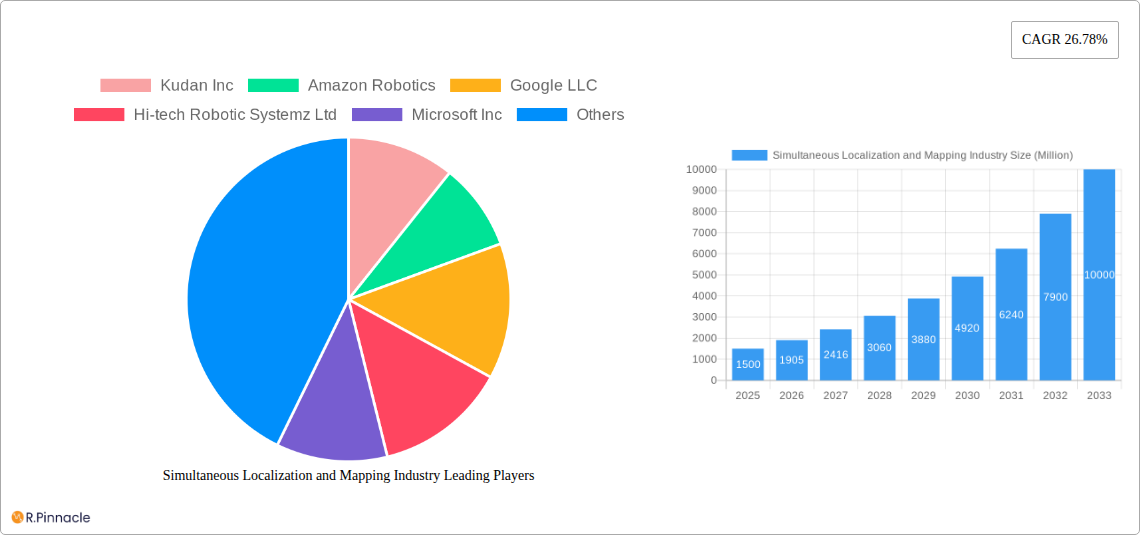
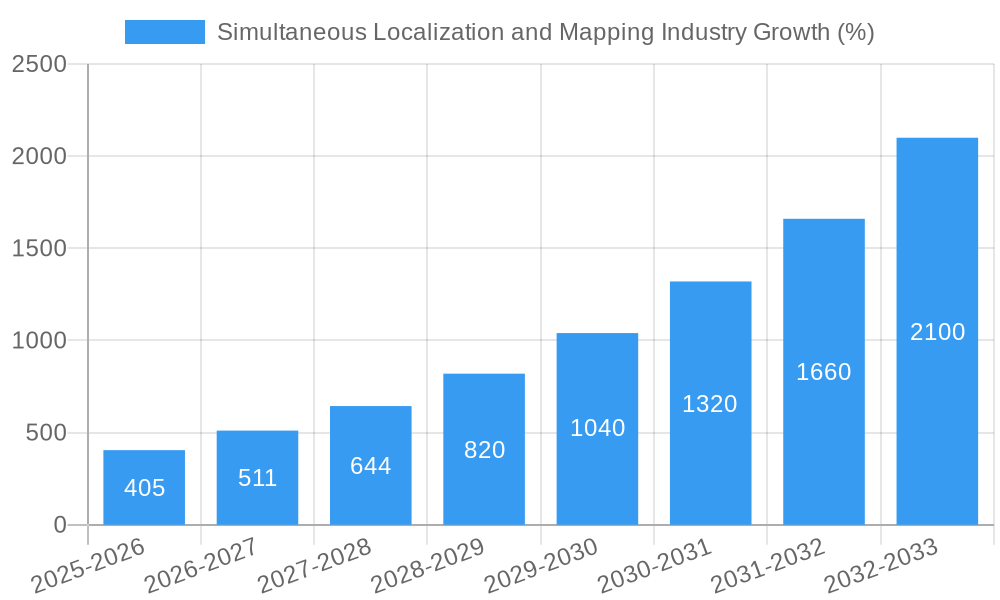
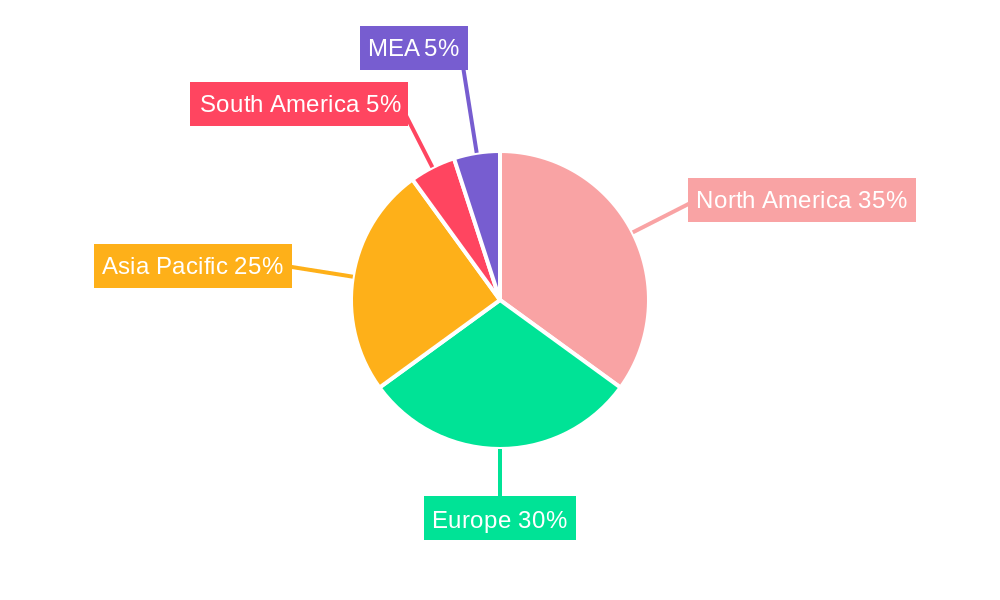
The Simultaneous Localization and Mapping (SLAM) market is experiencing robust growth, fueled by the increasing adoption of autonomous vehicles, robotics, and augmented/virtual reality (AR/VR) technologies. A 26.78% Compound Annual Growth Rate (CAGR) from 2019 to 2024 indicates a significant expansion, projecting substantial market value by 2033. Key drivers include advancements in sensor technology (like LiDAR and cameras), the development of more sophisticated algorithms, and the rising demand for efficient navigation solutions in diverse applications. The market is segmented by SLAM type (EKF SLAM, Fast SLAM, Graph-Based SLAM, others), offering (2D and 3D SLAM), and application (UAVs and robots, AR/VR, autonomous vehicles, and others). The prevalence of 3D SLAM is expected to increase due to its ability to provide more comprehensive environmental mapping. Geographic distribution shows strong growth across North America, Europe, and Asia Pacific, with significant contributions from countries like the United States, China, and Germany. However, market penetration in developing economies holds significant future potential. The presence of major tech companies like Google, Amazon, and Apple underscores the strategic importance of SLAM technology and its potential to revolutionize various industries. While challenges remain in terms of computational complexity and real-time performance optimization, ongoing research and development efforts are continuously improving SLAM algorithms, paving the way for wider adoption and market expansion.
The competitive landscape is characterized by a mix of established tech giants and specialized robotics companies. The strategic investments and acquisitions within the industry suggest a continued focus on innovation and market consolidation. The diverse applications of SLAM technology across multiple sectors ensure sustained demand and market expansion. The future of SLAM will likely witness the integration of artificial intelligence (AI) and machine learning (ML) for enhanced decision-making and adaptation capabilities, leading to more robust and reliable navigation systems. This will further broaden the applications of SLAM and contribute to its continued growth trajectory. Specific restraints, while not explicitly detailed, might include the high initial investment costs for implementing SLAM technology and the need for ongoing software updates and maintenance.
Simultaneous Localization and Mapping (SLAM) Industry Market Report: 2019-2033
This comprehensive report provides an in-depth analysis of the Simultaneous Localization and Mapping (SLAM) industry, offering invaluable insights for industry professionals, investors, and researchers. With a study period spanning 2019-2033, a base year of 2025, and a forecast period of 2025-2033, this report projects a market valued at $xx Million in 2025, experiencing a robust CAGR of xx% during the forecast period. The report leverages extensive data analysis to provide actionable strategies and forecasts, covering key segments, prominent players, and emerging trends.
Simultaneous Localization and Mapping Industry Market Structure & Innovation Trends
The SLAM market exhibits a moderately concentrated structure, with a few key players holding significant market share, while numerous smaller companies contribute to innovation. The market share of the top 5 players is estimated at xx%. Mergers and acquisitions (M&A) activity has been moderate, with deal values totaling approximately $xx Million in the historical period (2019-2024). Key innovation drivers include advancements in sensor technology (LiDAR, cameras, IMUs), improved algorithms (EKF SLAM, Graph-based SLAM), and increasing demand for autonomous systems. Regulatory frameworks, particularly concerning data privacy and safety standards for autonomous vehicles, significantly impact market growth. Product substitutes, such as GPS-based systems, remain a competitive factor, although SLAM technology offers superior accuracy and performance in GPS-denied environments. The end-user demographics are diverse, including manufacturers of robots and autonomous vehicles, AR/VR developers, and logistics companies.
- Market Concentration: Moderately concentrated, top 5 players hold xx% market share.
- M&A Activity (2019-2024): Total deal value approximately $xx Million.
- Key Innovation Drivers: Sensor technology advancements, improved algorithms, growing demand for autonomous systems.
- Regulatory Landscape: Significant impact from data privacy and safety regulations.
- Product Substitutes: GPS-based systems, but SLAM offers superior accuracy.
Simultaneous Localization and Mapping Industry Market Dynamics & Trends
The SLAM market is experiencing robust growth driven by several factors. The increasing adoption of autonomous vehicles across various sectors (logistics, agriculture, etc.) is a primary growth driver. Technological advancements, particularly in AI and machine learning, are enhancing SLAM algorithm performance and enabling more sophisticated applications. Consumer preference for convenient and efficient services fuels the demand for automation in various industries. Competitive dynamics are characterized by intense innovation and strategic partnerships among companies specializing in sensors, software, and hardware for SLAM systems. The market penetration of SLAM technology is increasing rapidly across various applications, with significant growth anticipated in the autonomous vehicle and robotics sectors. This growth trajectory reflects a market responding to the need for sophisticated location and mapping capabilities in increasingly automated environments. The overall growth exhibits a positive market outlook, characterized by increasing adoption and continuous innovation.
Dominant Regions & Segments in Simultaneous Localization and Mapping Industry
The North American market currently dominates the SLAM industry, driven by substantial investments in research and development, a strong presence of key players, and a high demand for autonomous solutions. However, the Asia-Pacific region is witnessing rapid growth, fueled by expanding industrial automation and infrastructure development. Within segments, the 3D SLAM offering and the autonomous vehicle application segment show the highest growth potential due to their increasing importance in various technological domains.
Key Drivers by Region:
- North America: High R&D investment, strong presence of major players, high demand for autonomous systems.
- Asia-Pacific: Rapid growth in industrial automation, infrastructure development, and government support.
Dominant Segments:
By Offering: 3D SLAM is the fastest-growing segment due to its broader application potential.
By Application: Autonomous vehicles show the highest growth potential due to increased demand for self-driving cars, trucks, and delivery robots.
By Type: Graph-Based SLAM is gaining traction due to its ability to handle large-scale environments and loop closures efficiently.
Simultaneous Localization and Mapping Industry Product Innovations
Recent innovations in SLAM technology include the development of more robust and accurate algorithms, improved sensor integration, and the introduction of plug-and-play software platforms for easier implementation. These advancements enable faster development cycles and lower costs for SLAM-based applications. The market is seeing a trend toward more versatile and adaptable systems that can be easily customized to various environments and applications. The increasing use of AI and machine learning is creating more accurate and resilient SLAM systems.
Report Scope & Segmentation Analysis
This report segments the SLAM market by type (EKF SLAM, Fast SLAM, Graph-Based SLAM, Others), offering (2D SLAM, 3D SLAM), and application (UAV and Robots, AR/VR, Autonomous Vehicles, Other Applications). Each segment's growth projection, market size, and competitive dynamics are meticulously analyzed. For example, the 3D SLAM segment is expected to witness significant growth due to its applicability in diverse sectors. Similarly, the autonomous vehicle application segment is poised for exponential growth. Growth within individual segments will be significantly impacted by advances in sensor technology, and improvements in computational power.
Key Drivers of Simultaneous Localization and Mapping Industry Growth
Several factors are driving the growth of the SLAM industry. Advancements in sensor technology (LiDAR, cameras, IMUs) provide more accurate and reliable data for SLAM algorithms. The increasing demand for autonomous systems in various sectors (robotics, automotive, AR/VR) is fueling market growth. Government initiatives and investments in research and development for autonomous technologies are also contributing factors. Finally, the decreasing cost of SLAM hardware and software is making the technology more accessible to a broader range of applications.
Challenges in the Simultaneous Localization and Mapping Industry Sector
The SLAM industry faces challenges such as the high cost of development and implementation, especially for complex applications. Data privacy and security concerns can hinder adoption, especially for autonomous vehicles and robots collecting sensitive data. The accuracy and robustness of SLAM systems can be impacted by environmental factors (lighting, weather), limiting their applicability in certain settings. Competitive pressures from established players and startups are also influencing market dynamics.
Emerging Opportunities in Simultaneous Localization and Mapping Industry
Emerging opportunities include the integration of SLAM technology with other advanced technologies such as AI, machine learning, and cloud computing. Expansion into new markets, such as precision agriculture, healthcare, and security, presents substantial growth potential. The development of more energy-efficient and cost-effective SLAM systems would further increase market adoption. Growth within niche markets, such as specialized robotics applications, presents strong growth potential.
Leading Players in the Simultaneous Localization and Mapping Industry Market
- Kudan Inc
- Amazon Robotics
- Google LLC
- Hi-tech Robotic Systemz Ltd
- Microsoft Inc
- MAXST Developers
- Apple Inc
- Aethon Inc
- ClearPath Robotics
- Rethink Robotic
Key Developments in Simultaneous Localization and Mapping Industry
- July 2022: Polymath Robotics developed an SDK-integrated plug-and-play software platform for automating industrial vehicles.
- November 2022: dConstruct integrated Ouster digital lidar to create highly accurate SLAMs for autonomous robot deployment in environments like The Galen smart office building in Singapore.
- February 2023: KUKA launched an Intralogistics Robot with wheel sensors and laser scanners, designed for safe collaboration with human workers.
Future Outlook for Simultaneous Localization and Mapping Industry Market
The SLAM market is poised for continued strong growth driven by increasing demand for automation and advancements in sensor and algorithm technologies. Strategic partnerships between technology providers and end-users will play a crucial role in shaping market development. Expansion into new applications and sectors will offer lucrative opportunities for businesses, creating a very positive outlook for the coming decade.
Simultaneous Localization and Mapping Industry Segmentation
-
1. Type
- 1.1. EKF SLAM
- 1.2. Fast SLAM
- 1.3. Graph-Based SLAM
- 1.4. Others
-
2. Offering
- 2.1. 2D SLAM
- 2.2. 3D SLAM
-
3. Application
- 3.1. UAV and Robots
- 3.2. AR/VR
- 3.3. Autonomous Vehicles
- 3.4. Other Applications
Simultaneous Localization and Mapping Industry Segmentation By Geography
-
1. North America
- 1.1. United States
- 1.2. Canada
-
2. Europe
- 2.1. Germany
- 2.2. United Kingdoms
- 2.3. France
- 2.4. Rest of the Europe
-
3. Asia Pacific
- 3.1. China
- 3.2. India
- 3.3. Japan
- 3.4. Rest of Asia Pacific
- 4. Middle East and Africa
Simultaneous Localization and Mapping Industry REPORT HIGHLIGHTS
| Aspects | Details |
|---|---|
| Study Period | 2019-2033 |
| Base Year | 2024 |
| Estimated Year | 2025 |
| Forecast Period | 2025-2033 |
| Historical Period | 2019-2024 |
| Growth Rate | CAGR of 26.78% from 2019-2033 |
| Segmentation |
|
Table of Contents
- 1. Introduction
- 1.1. Research Scope
- 1.2. Market Segmentation
- 1.3. Research Methodology
- 1.4. Definitions and Assumptions
- 2. Executive Summary
- 2.1. Introduction
- 3. Market Dynamics
- 3.1. Introduction
- 3.2. Market Drivers
- 3.2.1. Growing Penetration of Mapping Technologies in Domestic Robots and UAV; Advancements in Visual SLAM Algorithm; Increasing Application of SLAM in Augmented Reality
- 3.3. Market Restrains
- 3.3.1. ; The Risk of Interference from Other Wireless Device
- 3.4. Market Trends
- 3.4.1. UAVs and Robots Will Experience Significant Growth in the Market
- 4. Market Factor Analysis
- 4.1. Porters Five Forces
- 4.2. Supply/Value Chain
- 4.3. PESTEL analysis
- 4.4. Market Entropy
- 4.5. Patent/Trademark Analysis
- 5. Global Simultaneous Localization and Mapping Industry Analysis, Insights and Forecast, 2019-2031
- 5.1. Market Analysis, Insights and Forecast - by Type
- 5.1.1. EKF SLAM
- 5.1.2. Fast SLAM
- 5.1.3. Graph-Based SLAM
- 5.1.4. Others
- 5.2. Market Analysis, Insights and Forecast - by Offering
- 5.2.1. 2D SLAM
- 5.2.2. 3D SLAM
- 5.3. Market Analysis, Insights and Forecast - by Application
- 5.3.1. UAV and Robots
- 5.3.2. AR/VR
- 5.3.3. Autonomous Vehicles
- 5.3.4. Other Applications
- 5.4. Market Analysis, Insights and Forecast - by Region
- 5.4.1. North America
- 5.4.2. Europe
- 5.4.3. Asia Pacific
- 5.4.4. Middle East and Africa
- 5.1. Market Analysis, Insights and Forecast - by Type
- 6. North America Simultaneous Localization and Mapping Industry Analysis, Insights and Forecast, 2019-2031
- 6.1. Market Analysis, Insights and Forecast - by Type
- 6.1.1. EKF SLAM
- 6.1.2. Fast SLAM
- 6.1.3. Graph-Based SLAM
- 6.1.4. Others
- 6.2. Market Analysis, Insights and Forecast - by Offering
- 6.2.1. 2D SLAM
- 6.2.2. 3D SLAM
- 6.3. Market Analysis, Insights and Forecast - by Application
- 6.3.1. UAV and Robots
- 6.3.2. AR/VR
- 6.3.3. Autonomous Vehicles
- 6.3.4. Other Applications
- 6.1. Market Analysis, Insights and Forecast - by Type
- 7. Europe Simultaneous Localization and Mapping Industry Analysis, Insights and Forecast, 2019-2031
- 7.1. Market Analysis, Insights and Forecast - by Type
- 7.1.1. EKF SLAM
- 7.1.2. Fast SLAM
- 7.1.3. Graph-Based SLAM
- 7.1.4. Others
- 7.2. Market Analysis, Insights and Forecast - by Offering
- 7.2.1. 2D SLAM
- 7.2.2. 3D SLAM
- 7.3. Market Analysis, Insights and Forecast - by Application
- 7.3.1. UAV and Robots
- 7.3.2. AR/VR
- 7.3.3. Autonomous Vehicles
- 7.3.4. Other Applications
- 7.1. Market Analysis, Insights and Forecast - by Type
- 8. Asia Pacific Simultaneous Localization and Mapping Industry Analysis, Insights and Forecast, 2019-2031
- 8.1. Market Analysis, Insights and Forecast - by Type
- 8.1.1. EKF SLAM
- 8.1.2. Fast SLAM
- 8.1.3. Graph-Based SLAM
- 8.1.4. Others
- 8.2. Market Analysis, Insights and Forecast - by Offering
- 8.2.1. 2D SLAM
- 8.2.2. 3D SLAM
- 8.3. Market Analysis, Insights and Forecast - by Application
- 8.3.1. UAV and Robots
- 8.3.2. AR/VR
- 8.3.3. Autonomous Vehicles
- 8.3.4. Other Applications
- 8.1. Market Analysis, Insights and Forecast - by Type
- 9. Middle East and Africa Simultaneous Localization and Mapping Industry Analysis, Insights and Forecast, 2019-2031
- 9.1. Market Analysis, Insights and Forecast - by Type
- 9.1.1. EKF SLAM
- 9.1.2. Fast SLAM
- 9.1.3. Graph-Based SLAM
- 9.1.4. Others
- 9.2. Market Analysis, Insights and Forecast - by Offering
- 9.2.1. 2D SLAM
- 9.2.2. 3D SLAM
- 9.3. Market Analysis, Insights and Forecast - by Application
- 9.3.1. UAV and Robots
- 9.3.2. AR/VR
- 9.3.3. Autonomous Vehicles
- 9.3.4. Other Applications
- 9.1. Market Analysis, Insights and Forecast - by Type
- 10. North America Simultaneous Localization and Mapping Industry Analysis, Insights and Forecast, 2019-2031
- 10.1. Market Analysis, Insights and Forecast - By Country/Sub-region
- 10.1.1 United States
- 10.1.2 Canada
- 10.1.3 Mexico
- 11. Europe Simultaneous Localization and Mapping Industry Analysis, Insights and Forecast, 2019-2031
- 11.1. Market Analysis, Insights and Forecast - By Country/Sub-region
- 11.1.1 Germany
- 11.1.2 United Kingdom
- 11.1.3 France
- 11.1.4 Spain
- 11.1.5 Italy
- 11.1.6 Spain
- 11.1.7 Belgium
- 11.1.8 Netherland
- 11.1.9 Nordics
- 11.1.10 Rest of Europe
- 12. Asia Pacific Simultaneous Localization and Mapping Industry Analysis, Insights and Forecast, 2019-2031
- 12.1. Market Analysis, Insights and Forecast - By Country/Sub-region
- 12.1.1 China
- 12.1.2 Japan
- 12.1.3 India
- 12.1.4 South Korea
- 12.1.5 Southeast Asia
- 12.1.6 Australia
- 12.1.7 Indonesia
- 12.1.8 Phillipes
- 12.1.9 Singapore
- 12.1.10 Thailandc
- 12.1.11 Rest of Asia Pacific
- 13. South America Simultaneous Localization and Mapping Industry Analysis, Insights and Forecast, 2019-2031
- 13.1. Market Analysis, Insights and Forecast - By Country/Sub-region
- 13.1.1 Brazil
- 13.1.2 Argentina
- 13.1.3 Peru
- 13.1.4 Chile
- 13.1.5 Colombia
- 13.1.6 Ecuador
- 13.1.7 Venezuela
- 13.1.8 Rest of South America
- 14. North America Simultaneous Localization and Mapping Industry Analysis, Insights and Forecast, 2019-2031
- 14.1. Market Analysis, Insights and Forecast - By Country/Sub-region
- 14.1.1 United States
- 14.1.2 Canada
- 14.1.3 Mexico
- 15. MEA Simultaneous Localization and Mapping Industry Analysis, Insights and Forecast, 2019-2031
- 15.1. Market Analysis, Insights and Forecast - By Country/Sub-region
- 15.1.1 United Arab Emirates
- 15.1.2 Saudi Arabia
- 15.1.3 South Africa
- 15.1.4 Rest of Middle East and Africa
- 16. Competitive Analysis
- 16.1. Global Market Share Analysis 2024
- 16.2. Company Profiles
- 16.2.1 Kudan Inc
- 16.2.1.1. Overview
- 16.2.1.2. Products
- 16.2.1.3. SWOT Analysis
- 16.2.1.4. Recent Developments
- 16.2.1.5. Financials (Based on Availability)
- 16.2.2 Amazon Robotics
- 16.2.2.1. Overview
- 16.2.2.2. Products
- 16.2.2.3. SWOT Analysis
- 16.2.2.4. Recent Developments
- 16.2.2.5. Financials (Based on Availability)
- 16.2.3 Google LLC
- 16.2.3.1. Overview
- 16.2.3.2. Products
- 16.2.3.3. SWOT Analysis
- 16.2.3.4. Recent Developments
- 16.2.3.5. Financials (Based on Availability)
- 16.2.4 Hi-tech Robotic Systemz Ltd
- 16.2.4.1. Overview
- 16.2.4.2. Products
- 16.2.4.3. SWOT Analysis
- 16.2.4.4. Recent Developments
- 16.2.4.5. Financials (Based on Availability)
- 16.2.5 Microsoft Inc
- 16.2.5.1. Overview
- 16.2.5.2. Products
- 16.2.5.3. SWOT Analysis
- 16.2.5.4. Recent Developments
- 16.2.5.5. Financials (Based on Availability)
- 16.2.6 MAXST Developers
- 16.2.6.1. Overview
- 16.2.6.2. Products
- 16.2.6.3. SWOT Analysis
- 16.2.6.4. Recent Developments
- 16.2.6.5. Financials (Based on Availability)
- 16.2.7 Apple Inc
- 16.2.7.1. Overview
- 16.2.7.2. Products
- 16.2.7.3. SWOT Analysis
- 16.2.7.4. Recent Developments
- 16.2.7.5. Financials (Based on Availability)
- 16.2.8 Aethon Inc
- 16.2.8.1. Overview
- 16.2.8.2. Products
- 16.2.8.3. SWOT Analysis
- 16.2.8.4. Recent Developments
- 16.2.8.5. Financials (Based on Availability)
- 16.2.9 ClearPath Robotics
- 16.2.9.1. Overview
- 16.2.9.2. Products
- 16.2.9.3. SWOT Analysis
- 16.2.9.4. Recent Developments
- 16.2.9.5. Financials (Based on Availability)
- 16.2.10 Rethink Robotic
- 16.2.10.1. Overview
- 16.2.10.2. Products
- 16.2.10.3. SWOT Analysis
- 16.2.10.4. Recent Developments
- 16.2.10.5. Financials (Based on Availability)
- 16.2.1 Kudan Inc
List of Figures
- Figure 1: Global Simultaneous Localization and Mapping Industry Revenue Breakdown (Million, %) by Region 2024 & 2032
- Figure 2: North America Simultaneous Localization and Mapping Industry Revenue (Million), by Country 2024 & 2032
- Figure 3: North America Simultaneous Localization and Mapping Industry Revenue Share (%), by Country 2024 & 2032
- Figure 4: Europe Simultaneous Localization and Mapping Industry Revenue (Million), by Country 2024 & 2032
- Figure 5: Europe Simultaneous Localization and Mapping Industry Revenue Share (%), by Country 2024 & 2032
- Figure 6: Asia Pacific Simultaneous Localization and Mapping Industry Revenue (Million), by Country 2024 & 2032
- Figure 7: Asia Pacific Simultaneous Localization and Mapping Industry Revenue Share (%), by Country 2024 & 2032
- Figure 8: South America Simultaneous Localization and Mapping Industry Revenue (Million), by Country 2024 & 2032
- Figure 9: South America Simultaneous Localization and Mapping Industry Revenue Share (%), by Country 2024 & 2032
- Figure 10: North America Simultaneous Localization and Mapping Industry Revenue (Million), by Country 2024 & 2032
- Figure 11: North America Simultaneous Localization and Mapping Industry Revenue Share (%), by Country 2024 & 2032
- Figure 12: MEA Simultaneous Localization and Mapping Industry Revenue (Million), by Country 2024 & 2032
- Figure 13: MEA Simultaneous Localization and Mapping Industry Revenue Share (%), by Country 2024 & 2032
- Figure 14: North America Simultaneous Localization and Mapping Industry Revenue (Million), by Type 2024 & 2032
- Figure 15: North America Simultaneous Localization and Mapping Industry Revenue Share (%), by Type 2024 & 2032
- Figure 16: North America Simultaneous Localization and Mapping Industry Revenue (Million), by Offering 2024 & 2032
- Figure 17: North America Simultaneous Localization and Mapping Industry Revenue Share (%), by Offering 2024 & 2032
- Figure 18: North America Simultaneous Localization and Mapping Industry Revenue (Million), by Application 2024 & 2032
- Figure 19: North America Simultaneous Localization and Mapping Industry Revenue Share (%), by Application 2024 & 2032
- Figure 20: North America Simultaneous Localization and Mapping Industry Revenue (Million), by Country 2024 & 2032
- Figure 21: North America Simultaneous Localization and Mapping Industry Revenue Share (%), by Country 2024 & 2032
- Figure 22: Europe Simultaneous Localization and Mapping Industry Revenue (Million), by Type 2024 & 2032
- Figure 23: Europe Simultaneous Localization and Mapping Industry Revenue Share (%), by Type 2024 & 2032
- Figure 24: Europe Simultaneous Localization and Mapping Industry Revenue (Million), by Offering 2024 & 2032
- Figure 25: Europe Simultaneous Localization and Mapping Industry Revenue Share (%), by Offering 2024 & 2032
- Figure 26: Europe Simultaneous Localization and Mapping Industry Revenue (Million), by Application 2024 & 2032
- Figure 27: Europe Simultaneous Localization and Mapping Industry Revenue Share (%), by Application 2024 & 2032
- Figure 28: Europe Simultaneous Localization and Mapping Industry Revenue (Million), by Country 2024 & 2032
- Figure 29: Europe Simultaneous Localization and Mapping Industry Revenue Share (%), by Country 2024 & 2032
- Figure 30: Asia Pacific Simultaneous Localization and Mapping Industry Revenue (Million), by Type 2024 & 2032
- Figure 31: Asia Pacific Simultaneous Localization and Mapping Industry Revenue Share (%), by Type 2024 & 2032
- Figure 32: Asia Pacific Simultaneous Localization and Mapping Industry Revenue (Million), by Offering 2024 & 2032
- Figure 33: Asia Pacific Simultaneous Localization and Mapping Industry Revenue Share (%), by Offering 2024 & 2032
- Figure 34: Asia Pacific Simultaneous Localization and Mapping Industry Revenue (Million), by Application 2024 & 2032
- Figure 35: Asia Pacific Simultaneous Localization and Mapping Industry Revenue Share (%), by Application 2024 & 2032
- Figure 36: Asia Pacific Simultaneous Localization and Mapping Industry Revenue (Million), by Country 2024 & 2032
- Figure 37: Asia Pacific Simultaneous Localization and Mapping Industry Revenue Share (%), by Country 2024 & 2032
- Figure 38: Middle East and Africa Simultaneous Localization and Mapping Industry Revenue (Million), by Type 2024 & 2032
- Figure 39: Middle East and Africa Simultaneous Localization and Mapping Industry Revenue Share (%), by Type 2024 & 2032
- Figure 40: Middle East and Africa Simultaneous Localization and Mapping Industry Revenue (Million), by Offering 2024 & 2032
- Figure 41: Middle East and Africa Simultaneous Localization and Mapping Industry Revenue Share (%), by Offering 2024 & 2032
- Figure 42: Middle East and Africa Simultaneous Localization and Mapping Industry Revenue (Million), by Application 2024 & 2032
- Figure 43: Middle East and Africa Simultaneous Localization and Mapping Industry Revenue Share (%), by Application 2024 & 2032
- Figure 44: Middle East and Africa Simultaneous Localization and Mapping Industry Revenue (Million), by Country 2024 & 2032
- Figure 45: Middle East and Africa Simultaneous Localization and Mapping Industry Revenue Share (%), by Country 2024 & 2032
List of Tables
- Table 1: Global Simultaneous Localization and Mapping Industry Revenue Million Forecast, by Region 2019 & 2032
- Table 2: Global Simultaneous Localization and Mapping Industry Revenue Million Forecast, by Type 2019 & 2032
- Table 3: Global Simultaneous Localization and Mapping Industry Revenue Million Forecast, by Offering 2019 & 2032
- Table 4: Global Simultaneous Localization and Mapping Industry Revenue Million Forecast, by Application 2019 & 2032
- Table 5: Global Simultaneous Localization and Mapping Industry Revenue Million Forecast, by Region 2019 & 2032
- Table 6: Global Simultaneous Localization and Mapping Industry Revenue Million Forecast, by Country 2019 & 2032
- Table 7: United States Simultaneous Localization and Mapping Industry Revenue (Million) Forecast, by Application 2019 & 2032
- Table 8: Canada Simultaneous Localization and Mapping Industry Revenue (Million) Forecast, by Application 2019 & 2032
- Table 9: Mexico Simultaneous Localization and Mapping Industry Revenue (Million) Forecast, by Application 2019 & 2032
- Table 10: Global Simultaneous Localization and Mapping Industry Revenue Million Forecast, by Country 2019 & 2032
- Table 11: Germany Simultaneous Localization and Mapping Industry Revenue (Million) Forecast, by Application 2019 & 2032
- Table 12: United Kingdom Simultaneous Localization and Mapping Industry Revenue (Million) Forecast, by Application 2019 & 2032
- Table 13: France Simultaneous Localization and Mapping Industry Revenue (Million) Forecast, by Application 2019 & 2032
- Table 14: Spain Simultaneous Localization and Mapping Industry Revenue (Million) Forecast, by Application 2019 & 2032
- Table 15: Italy Simultaneous Localization and Mapping Industry Revenue (Million) Forecast, by Application 2019 & 2032
- Table 16: Spain Simultaneous Localization and Mapping Industry Revenue (Million) Forecast, by Application 2019 & 2032
- Table 17: Belgium Simultaneous Localization and Mapping Industry Revenue (Million) Forecast, by Application 2019 & 2032
- Table 18: Netherland Simultaneous Localization and Mapping Industry Revenue (Million) Forecast, by Application 2019 & 2032
- Table 19: Nordics Simultaneous Localization and Mapping Industry Revenue (Million) Forecast, by Application 2019 & 2032
- Table 20: Rest of Europe Simultaneous Localization and Mapping Industry Revenue (Million) Forecast, by Application 2019 & 2032
- Table 21: Global Simultaneous Localization and Mapping Industry Revenue Million Forecast, by Country 2019 & 2032
- Table 22: China Simultaneous Localization and Mapping Industry Revenue (Million) Forecast, by Application 2019 & 2032
- Table 23: Japan Simultaneous Localization and Mapping Industry Revenue (Million) Forecast, by Application 2019 & 2032
- Table 24: India Simultaneous Localization and Mapping Industry Revenue (Million) Forecast, by Application 2019 & 2032
- Table 25: South Korea Simultaneous Localization and Mapping Industry Revenue (Million) Forecast, by Application 2019 & 2032
- Table 26: Southeast Asia Simultaneous Localization and Mapping Industry Revenue (Million) Forecast, by Application 2019 & 2032
- Table 27: Australia Simultaneous Localization and Mapping Industry Revenue (Million) Forecast, by Application 2019 & 2032
- Table 28: Indonesia Simultaneous Localization and Mapping Industry Revenue (Million) Forecast, by Application 2019 & 2032
- Table 29: Phillipes Simultaneous Localization and Mapping Industry Revenue (Million) Forecast, by Application 2019 & 2032
- Table 30: Singapore Simultaneous Localization and Mapping Industry Revenue (Million) Forecast, by Application 2019 & 2032
- Table 31: Thailandc Simultaneous Localization and Mapping Industry Revenue (Million) Forecast, by Application 2019 & 2032
- Table 32: Rest of Asia Pacific Simultaneous Localization and Mapping Industry Revenue (Million) Forecast, by Application 2019 & 2032
- Table 33: Global Simultaneous Localization and Mapping Industry Revenue Million Forecast, by Country 2019 & 2032
- Table 34: Brazil Simultaneous Localization and Mapping Industry Revenue (Million) Forecast, by Application 2019 & 2032
- Table 35: Argentina Simultaneous Localization and Mapping Industry Revenue (Million) Forecast, by Application 2019 & 2032
- Table 36: Peru Simultaneous Localization and Mapping Industry Revenue (Million) Forecast, by Application 2019 & 2032
- Table 37: Chile Simultaneous Localization and Mapping Industry Revenue (Million) Forecast, by Application 2019 & 2032
- Table 38: Colombia Simultaneous Localization and Mapping Industry Revenue (Million) Forecast, by Application 2019 & 2032
- Table 39: Ecuador Simultaneous Localization and Mapping Industry Revenue (Million) Forecast, by Application 2019 & 2032
- Table 40: Venezuela Simultaneous Localization and Mapping Industry Revenue (Million) Forecast, by Application 2019 & 2032
- Table 41: Rest of South America Simultaneous Localization and Mapping Industry Revenue (Million) Forecast, by Application 2019 & 2032
- Table 42: Global Simultaneous Localization and Mapping Industry Revenue Million Forecast, by Country 2019 & 2032
- Table 43: United States Simultaneous Localization and Mapping Industry Revenue (Million) Forecast, by Application 2019 & 2032
- Table 44: Canada Simultaneous Localization and Mapping Industry Revenue (Million) Forecast, by Application 2019 & 2032
- Table 45: Mexico Simultaneous Localization and Mapping Industry Revenue (Million) Forecast, by Application 2019 & 2032
- Table 46: Global Simultaneous Localization and Mapping Industry Revenue Million Forecast, by Country 2019 & 2032
- Table 47: United Arab Emirates Simultaneous Localization and Mapping Industry Revenue (Million) Forecast, by Application 2019 & 2032
- Table 48: Saudi Arabia Simultaneous Localization and Mapping Industry Revenue (Million) Forecast, by Application 2019 & 2032
- Table 49: South Africa Simultaneous Localization and Mapping Industry Revenue (Million) Forecast, by Application 2019 & 2032
- Table 50: Rest of Middle East and Africa Simultaneous Localization and Mapping Industry Revenue (Million) Forecast, by Application 2019 & 2032
- Table 51: Global Simultaneous Localization and Mapping Industry Revenue Million Forecast, by Type 2019 & 2032
- Table 52: Global Simultaneous Localization and Mapping Industry Revenue Million Forecast, by Offering 2019 & 2032
- Table 53: Global Simultaneous Localization and Mapping Industry Revenue Million Forecast, by Application 2019 & 2032
- Table 54: Global Simultaneous Localization and Mapping Industry Revenue Million Forecast, by Country 2019 & 2032
- Table 55: United States Simultaneous Localization and Mapping Industry Revenue (Million) Forecast, by Application 2019 & 2032
- Table 56: Canada Simultaneous Localization and Mapping Industry Revenue (Million) Forecast, by Application 2019 & 2032
- Table 57: Global Simultaneous Localization and Mapping Industry Revenue Million Forecast, by Type 2019 & 2032
- Table 58: Global Simultaneous Localization and Mapping Industry Revenue Million Forecast, by Offering 2019 & 2032
- Table 59: Global Simultaneous Localization and Mapping Industry Revenue Million Forecast, by Application 2019 & 2032
- Table 60: Global Simultaneous Localization and Mapping Industry Revenue Million Forecast, by Country 2019 & 2032
- Table 61: Germany Simultaneous Localization and Mapping Industry Revenue (Million) Forecast, by Application 2019 & 2032
- Table 62: United Kingdoms Simultaneous Localization and Mapping Industry Revenue (Million) Forecast, by Application 2019 & 2032
- Table 63: France Simultaneous Localization and Mapping Industry Revenue (Million) Forecast, by Application 2019 & 2032
- Table 64: Rest of the Europe Simultaneous Localization and Mapping Industry Revenue (Million) Forecast, by Application 2019 & 2032
- Table 65: Global Simultaneous Localization and Mapping Industry Revenue Million Forecast, by Type 2019 & 2032
- Table 66: Global Simultaneous Localization and Mapping Industry Revenue Million Forecast, by Offering 2019 & 2032
- Table 67: Global Simultaneous Localization and Mapping Industry Revenue Million Forecast, by Application 2019 & 2032
- Table 68: Global Simultaneous Localization and Mapping Industry Revenue Million Forecast, by Country 2019 & 2032
- Table 69: China Simultaneous Localization and Mapping Industry Revenue (Million) Forecast, by Application 2019 & 2032
- Table 70: India Simultaneous Localization and Mapping Industry Revenue (Million) Forecast, by Application 2019 & 2032
- Table 71: Japan Simultaneous Localization and Mapping Industry Revenue (Million) Forecast, by Application 2019 & 2032
- Table 72: Rest of Asia Pacific Simultaneous Localization and Mapping Industry Revenue (Million) Forecast, by Application 2019 & 2032
- Table 73: Global Simultaneous Localization and Mapping Industry Revenue Million Forecast, by Type 2019 & 2032
- Table 74: Global Simultaneous Localization and Mapping Industry Revenue Million Forecast, by Offering 2019 & 2032
- Table 75: Global Simultaneous Localization and Mapping Industry Revenue Million Forecast, by Application 2019 & 2032
- Table 76: Global Simultaneous Localization and Mapping Industry Revenue Million Forecast, by Country 2019 & 2032
Frequently Asked Questions
1. What is the projected Compound Annual Growth Rate (CAGR) of the Simultaneous Localization and Mapping Industry?
The projected CAGR is approximately 26.78%.
2. Which companies are prominent players in the Simultaneous Localization and Mapping Industry?
Key companies in the market include Kudan Inc, Amazon Robotics, Google LLC, Hi-tech Robotic Systemz Ltd, Microsoft Inc, MAXST Developers, Apple Inc, Aethon Inc, ClearPath Robotics, Rethink Robotic.
3. What are the main segments of the Simultaneous Localization and Mapping Industry?
The market segments include Type, Offering, Application.
4. Can you provide details about the market size?
The market size is estimated to be USD XX Million as of 2022.
5. What are some drivers contributing to market growth?
Growing Penetration of Mapping Technologies in Domestic Robots and UAV; Advancements in Visual SLAM Algorithm; Increasing Application of SLAM in Augmented Reality.
6. What are the notable trends driving market growth?
UAVs and Robots Will Experience Significant Growth in the Market.
7. Are there any restraints impacting market growth?
; The Risk of Interference from Other Wireless Device.
8. Can you provide examples of recent developments in the market?
November 2022 - Singapore based autonomous navigation solutions provider dConstruct introduced Ouster digital lidar to create highly accurate SLAMs and point cloud maps. Dconstruct creates these maps virtually and then studies the deployment of autonomous robots and the inspection and reconstruction of working environments. For instance - A map of a smart office building, The Galen, in Singapore was created on the cloud and was used to facilitate the deployment of autonomous robots ranging from cleaning robots to last-mile delivery robots.
9. What pricing options are available for accessing the report?
Pricing options include single-user, multi-user, and enterprise licenses priced at USD 4750, USD 5250, and USD 8750 respectively.
10. Is the market size provided in terms of value or volume?
The market size is provided in terms of value, measured in Million.
11. Are there any specific market keywords associated with the report?
Yes, the market keyword associated with the report is "Simultaneous Localization and Mapping Industry," which aids in identifying and referencing the specific market segment covered.
12. How do I determine which pricing option suits my needs best?
The pricing options vary based on user requirements and access needs. Individual users may opt for single-user licenses, while businesses requiring broader access may choose multi-user or enterprise licenses for cost-effective access to the report.
13. Are there any additional resources or data provided in the Simultaneous Localization and Mapping Industry report?
While the report offers comprehensive insights, it's advisable to review the specific contents or supplementary materials provided to ascertain if additional resources or data are available.
14. How can I stay updated on further developments or reports in the Simultaneous Localization and Mapping Industry?
To stay informed about further developments, trends, and reports in the Simultaneous Localization and Mapping Industry, consider subscribing to industry newsletters, following relevant companies and organizations, or regularly checking reputable industry news sources and publications.
Methodology
Step 1 - Identification of Relevant Samples Size from Population Database


Step 2 - Approaches for Defining Global Market Size (Value, Volume* & Price*)

Note*: In applicable scenarios
Step 3 - Data Sources
Primary Research
- Web Analytics
- Survey Reports
- Research Institute
- Latest Research Reports
- Opinion Leaders
Secondary Research
- Annual Reports
- White Paper
- Latest Press Release
- Industry Association
- Paid Database
- Investor Presentations

Step 4 - Data Triangulation
Involves using different sources of information in order to increase the validity of a study
These sources are likely to be stakeholders in a program - participants, other researchers, program staff, other community members, and so on.
Then we put all data in single framework & apply various statistical tools to find out the dynamic on the market.
During the analysis stage, feedback from the stakeholder groups would be compared to determine areas of agreement as well as areas of divergence


