
Key Insights
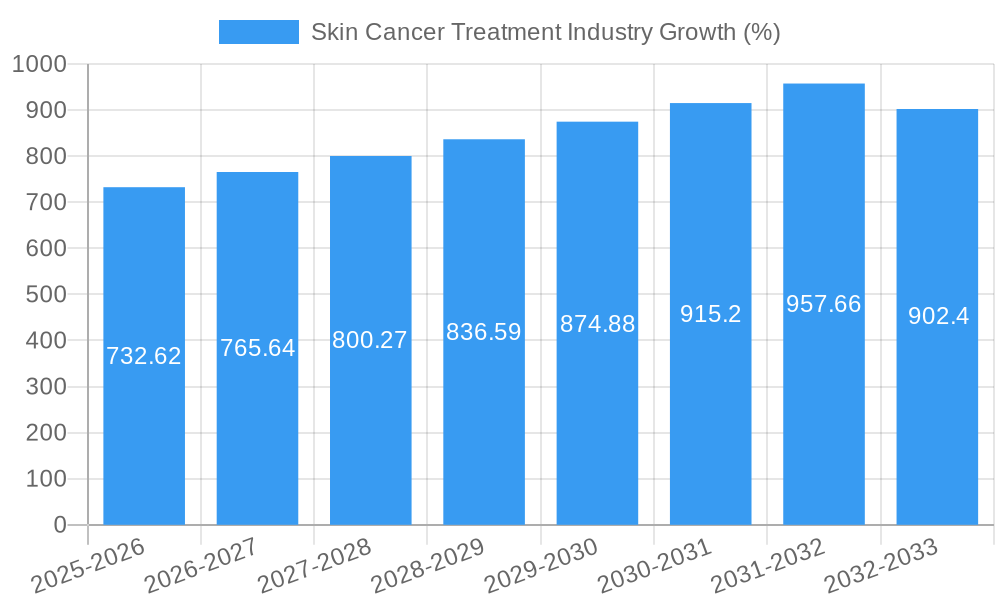
The global skin cancer treatment market, valued at $13.82 billion in 2025, is projected to experience robust growth, driven by a rising incidence of skin cancer globally, advances in targeted therapies, and increased awareness among the population. The compound annual growth rate (CAGR) of 5.21% from 2025 to 2033 indicates a significant expansion of this market. Key drivers include the development of innovative treatment modalities like immunotherapies, targeted therapies, and improved diagnostic techniques. Increasing geriatric populations in developed nations, along with higher exposure to ultraviolet (UV) radiation, contribute to the surge in skin cancer cases, fueling market demand. Market segmentation reveals melanoma and non-melanoma skin cancers as major contributors, with therapeutics dominating the treatment segment. While advancements in treatment offer hope, challenges remain, including high treatment costs, potential side effects associated with certain therapies, and the need for improved early detection methods. Competition among major pharmaceutical companies like Amgen, Roche, and Pfizer underscores the significant investment in this space. Geographical analysis suggests North America and Europe currently hold larger market shares due to higher healthcare expenditure and established healthcare infrastructure; however, emerging markets in Asia-Pacific are expected to show significant growth driven by increasing awareness and improved access to healthcare.
The market's growth trajectory is influenced by several factors. Technological advancements continuously refine treatment approaches, leading to improved outcomes and increased patient survival rates. However, limitations such as the development of drug resistance and the high cost of innovative therapies present ongoing challenges. Government initiatives promoting skin cancer awareness and early detection programs play a vital role in shaping market dynamics. Further research and development efforts focusing on personalized medicine and preventative strategies will likely influence the market's future growth. The increasing adoption of minimally invasive procedures and the expansion of teledermatology are also expected to contribute positively to market expansion. A comprehensive understanding of these multifaceted factors is essential for strategic market positioning and investment decisions within the skin cancer treatment industry.

Skin Cancer Treatment Industry Market Report: 2019-2033
This comprehensive report provides a detailed analysis of the Skin Cancer Treatment industry, projecting a market value of $XX Million by 2033. The study period covers 2019-2033, with a base year of 2025 and a forecast period of 2025-2033. This report is essential for industry professionals, investors, and researchers seeking actionable insights into this rapidly evolving market.
Skin Cancer Treatment Industry Market Structure & Innovation Trends
The skin cancer treatment market is characterized by a moderately concentrated structure, with a few large pharmaceutical companies holding significant market share. Key players include Bristol-Myers Squibb Company, Pfizer Inc, F. Hoffmann-La Roche Ltd, Novartis AG, Merck & Co Inc, and Amgen Inc, among others. However, a growing number of smaller biotech firms are contributing to innovation, driving competition and diversifying the market.
- Market Share: Top 5 players account for approximately XX% of the global market share (2025 estimate).
- M&A Activity: The last 5 years have witnessed a notable increase in mergers and acquisitions (M&A), with deal values exceeding $XX Million in total. This highlights the strategic importance of this market and the competitive landscape.
- Innovation Drivers: Key drivers include advancements in immunotherapy, targeted therapies, and diagnostic technologies. Regulatory frameworks, particularly FDA approvals, significantly impact market dynamics. Product substitutes, such as alternative therapies and lifestyle modifications, also influence market growth.
- End-User Demographics: The aging global population, increasing UV radiation exposure, and rising awareness about skin cancer are significant factors contributing to market growth.
Skin Cancer Treatment Industry Market Dynamics & Trends
The skin cancer treatment market is experiencing robust growth, driven primarily by technological advancements and a rising prevalence of skin cancer globally. The market is expected to register a Compound Annual Growth Rate (CAGR) of XX% during the forecast period (2025-2033). This growth is fueled by:
- Increased adoption of innovative therapies, such as immunotherapy and targeted therapies.
- Growing demand for early diagnosis and screening methods due to increased awareness.
- Expansion of healthcare infrastructure and improved access to specialized treatments in developing economies.
- Rising research and development investment in novel treatment approaches.
- Increased government initiatives to raise awareness and improve early diagnosis.
The market is also witnessing technological disruptions, including the emergence of personalized medicine approaches and the application of artificial intelligence in diagnostics and treatment. Consumer preferences are shifting towards minimally invasive treatments with fewer side effects. Competition is intensifying as both established players and new entrants continuously introduce new products and services.
Dominant Regions & Segments in Skin Cancer Treatment Industry
The global skin cancer treatment market is a dynamic landscape shaped by several key factors. North America currently holds the largest market share, driven by a confluence of factors including high healthcare expenditure, a robust and advanced healthcare infrastructure, and unfortunately, a high prevalence of skin cancer. However, the Asia-Pacific region is poised for the most rapid growth in the coming years, fueled by a surge in disposable incomes, increasing awareness of skin cancer prevention and treatment, and substantial investments in expanding healthcare capabilities. Europe maintains a significant presence, characterized by stringent regulatory frameworks and high healthcare standards that contribute to market stability and consistent growth.
- By Cancer Type: Melanoma, due to its aggressive nature and high mortality rate, represents a substantial portion of the market, commanding the highest segment value compared to non-melanoma skin cancers and other types. The increasing incidence of melanoma globally significantly impacts market growth projections.
- By Treatment Type: The market is broadly categorized into diagnostic and therapeutic segments. Diagnostic segments, encompassing advanced imaging technologies and sophisticated biopsy techniques, are crucial for early detection and accurate diagnosis, representing a significant portion of the overall market value. The therapeutics segment, encompassing a wide range of treatments including surgery, radiation therapy, chemotherapy, immunotherapy, and targeted therapies, constitutes the most valuable sector, with ongoing innovation driving significant growth.
- Key Regional Drivers:
- North America: High prevalence rates, advanced healthcare infrastructure, substantial healthcare expenditure, and well-established regulatory frameworks contribute to North America's continued market leadership. The presence of numerous key players and ongoing research and development further solidify its position.
- Asia Pacific: The region's growth is fueled by a rapidly expanding middle class with increased access to healthcare, rising awareness campaigns promoting early detection and prevention, and significant government investment in healthcare infrastructure improvements.
- Europe: Stringent regulatory environments ensure high treatment standards, driving market stability and fostering innovation within the industry. The focus on evidence-based medicine and advanced treatment protocols contributes to Europe's consistent growth.
Skin Cancer Treatment Industry Product Innovations
Recent innovations have focused on targeted therapies, immunotherapies, and advanced diagnostic tools that provide more precise and effective treatments with improved patient outcomes. The development of combination therapies and personalized medicine approaches further enhances the effectiveness and efficacy of treatment. These innovations are addressing the limitations of traditional therapies and improving patient compliance and satisfaction.
Report Scope & Segmentation Analysis
This report segments the skin cancer treatment market based on cancer type (Melanoma, Non-Melanoma), treatment type (Diagnosis, Therapeutics – including surgery, radiation, chemotherapy, immunotherapy, targeted therapy), and geography. Each segment is analyzed in terms of its market size, growth rate, competitive dynamics, and key players. Market sizes are provided for each segment, with growth projections extending to 2033. The competitive landscape of each segment is assessed considering various factors such as market share, innovation, and geographical reach.
Key Drivers of Skin Cancer Treatment Industry Growth
The growth of the skin cancer treatment market is driven by several factors, including the rising prevalence of skin cancer, technological advancements, increasing healthcare expenditure, and supportive regulatory frameworks. The development of novel therapies, like immunotherapies, and improved diagnostic tools significantly contributes to the market growth. Furthermore, the increasing awareness and proactive measures for early detection and treatment play a crucial role in accelerating market expansion.
Challenges in the Skin Cancer Treatment Industry Sector
The skin cancer treatment market faces challenges, including the high cost of novel therapies, the complexities of treatment and potential side effects, stringent regulatory requirements and approvals processes, and the need for patient education and compliance. Supply chain disruptions, variations in healthcare systems across regions, and the emergence of drug resistance also present significant obstacles to market growth. These factors influence treatment accessibility, affordability, and effectiveness.
Emerging Opportunities in Skin Cancer Treatment Industry
Emerging opportunities lie in the development of personalized medicine approaches, advanced diagnostic tools, and innovative treatment modalities. The expansion into new markets, particularly in developing economies, presents significant potential. Further research and development in novel therapies, focusing on overcoming drug resistance and improving treatment efficacy, represents a key opportunity area. Furthermore, the growing focus on preventive measures and early detection presents significant growth prospects.
Leading Players in the Skin Cancer Treatment Industry Market
- Sirnaomics Inc
- Daiichi Sankyo Company Limited
- Sanofi
- Novartis AG
- Amgen Inc
- Merck & Co Inc
- F Hoffmann-La Roche Ltd
- Abbott
- Labcorp
- Sun Pharmaceutical Industries Ltd
- QIAGEN
- Bristol-Myers Squibb Company
- Pfizer Inc
Key Developments in Skin Cancer Treatment Industry Industry
- March 2022: The FDA approved nivolumab and relatlimab-rmbw (Opdualag, Bristol-Myers Squibb Company) for adult and pediatric patients (12 years or older) with unresectable or metastatic melanoma. This approval significantly expanded treatment options for melanoma patients.
- January 2022: SkinCure Oncology launched GentleCure.com, an educational platform offering evidence-based treatment options for BCC and SCC. This highlights the growing importance of patient education and access to information.
Future Outlook for Skin Cancer Treatment Industry Market
The future of the skin cancer treatment market appears promising, driven by continued innovation in therapies and diagnostics, expanding healthcare infrastructure in developing economies, and a growing global awareness of skin cancer prevention and early detection. The market is poised for further growth, driven by the increasing prevalence of skin cancer, advancements in personalized medicine, and the introduction of novel therapeutic modalities. Strategic partnerships, collaborations, and investments in R&D will further shape the landscape, ensuring continued progress and accessibility in skin cancer treatment.
Skin Cancer Treatment Industry Segmentation
-
1. Cancer Type
- 1.1. Melanoma
- 1.2. Non-melanoma
-
2. Type
-
2.1. Diagnosis
- 2.1.1. Dermatoscopy
- 2.1.2. Biopsy
- 2.1.3. Genetic Tests
- 2.1.4. Others
-
2.2. Therapeutics
- 2.2.1. Chemotherapy
- 2.2.2. Immunotherapy
- 2.2.3. Targeted Therapy
-
2.1. Diagnosis
Skin Cancer Treatment Industry Segmentation By Geography
-
1. North America
- 1.1. United States
- 1.2. Canada
- 1.3. Mexico
-
2. Europe
- 2.1. Germany
- 2.2. United Kingdom
- 2.3. France
- 2.4. Italy
- 2.5. Spain
- 2.6. Rest of Europe
-
3. Asia Pacific
- 3.1. China
- 3.2. Japan
- 3.3. India
- 3.4. Australia
- 3.5. South Korea
- 3.6. Rest of Asia Pacific
-
4. Middle East and Africa
- 4.1. GCC
- 4.2. South Africa
- 4.3. Rest of Middle East and Africa
-
5. South America
- 5.1. Brazil
- 5.2. Argentina
- 5.3. Rest of South America

Skin Cancer Treatment Industry REPORT HIGHLIGHTS
| Aspects | Details |
|---|---|
| Study Period | 2019-2033 |
| Base Year | 2024 |
| Estimated Year | 2025 |
| Forecast Period | 2025-2033 |
| Historical Period | 2019-2024 |
| Growth Rate | CAGR of 5.21% from 2019-2033 |
| Segmentation |
|
Table of Contents
- 1. Introduction
- 1.1. Research Scope
- 1.2. Market Segmentation
- 1.3. Research Methodology
- 1.4. Definitions and Assumptions
- 2. Executive Summary
- 2.1. Introduction
- 3. Market Dynamics
- 3.1. Introduction
- 3.2. Market Drivers
- 3.2.1. Increasing Incidence of Skin Cancer; Rising Awareness About Skin Cancer; Extensive Research and Developments
- 3.3. Market Restrains
- 3.3.1. High Cost Associated with Therapy; Stringent Regulatory Framework
- 3.4. Market Trends
- 3.4.1. Non-Melanoma by Cancer Type Segment is Expected to Grow Over the Forecast Period
- 4. Market Factor Analysis
- 4.1. Porters Five Forces
- 4.2. Supply/Value Chain
- 4.3. PESTEL analysis
- 4.4. Market Entropy
- 4.5. Patent/Trademark Analysis
- 5. Global Skin Cancer Treatment Industry Analysis, Insights and Forecast, 2019-2031
- 5.1. Market Analysis, Insights and Forecast - by Cancer Type
- 5.1.1. Melanoma
- 5.1.2. Non-melanoma
- 5.2. Market Analysis, Insights and Forecast - by Type
- 5.2.1. Diagnosis
- 5.2.1.1. Dermatoscopy
- 5.2.1.2. Biopsy
- 5.2.1.3. Genetic Tests
- 5.2.1.4. Others
- 5.2.2. Therapeutics
- 5.2.2.1. Chemotherapy
- 5.2.2.2. Immunotherapy
- 5.2.2.3. Targeted Therapy
- 5.2.1. Diagnosis
- 5.3. Market Analysis, Insights and Forecast - by Region
- 5.3.1. North America
- 5.3.2. Europe
- 5.3.3. Asia Pacific
- 5.3.4. Middle East and Africa
- 5.3.5. South America
- 5.1. Market Analysis, Insights and Forecast - by Cancer Type
- 6. North America Skin Cancer Treatment Industry Analysis, Insights and Forecast, 2019-2031
- 6.1. Market Analysis, Insights and Forecast - by Cancer Type
- 6.1.1. Melanoma
- 6.1.2. Non-melanoma
- 6.2. Market Analysis, Insights and Forecast - by Type
- 6.2.1. Diagnosis
- 6.2.1.1. Dermatoscopy
- 6.2.1.2. Biopsy
- 6.2.1.3. Genetic Tests
- 6.2.1.4. Others
- 6.2.2. Therapeutics
- 6.2.2.1. Chemotherapy
- 6.2.2.2. Immunotherapy
- 6.2.2.3. Targeted Therapy
- 6.2.1. Diagnosis
- 6.1. Market Analysis, Insights and Forecast - by Cancer Type
- 7. Europe Skin Cancer Treatment Industry Analysis, Insights and Forecast, 2019-2031
- 7.1. Market Analysis, Insights and Forecast - by Cancer Type
- 7.1.1. Melanoma
- 7.1.2. Non-melanoma
- 7.2. Market Analysis, Insights and Forecast - by Type
- 7.2.1. Diagnosis
- 7.2.1.1. Dermatoscopy
- 7.2.1.2. Biopsy
- 7.2.1.3. Genetic Tests
- 7.2.1.4. Others
- 7.2.2. Therapeutics
- 7.2.2.1. Chemotherapy
- 7.2.2.2. Immunotherapy
- 7.2.2.3. Targeted Therapy
- 7.2.1. Diagnosis
- 7.1. Market Analysis, Insights and Forecast - by Cancer Type
- 8. Asia Pacific Skin Cancer Treatment Industry Analysis, Insights and Forecast, 2019-2031
- 8.1. Market Analysis, Insights and Forecast - by Cancer Type
- 8.1.1. Melanoma
- 8.1.2. Non-melanoma
- 8.2. Market Analysis, Insights and Forecast - by Type
- 8.2.1. Diagnosis
- 8.2.1.1. Dermatoscopy
- 8.2.1.2. Biopsy
- 8.2.1.3. Genetic Tests
- 8.2.1.4. Others
- 8.2.2. Therapeutics
- 8.2.2.1. Chemotherapy
- 8.2.2.2. Immunotherapy
- 8.2.2.3. Targeted Therapy
- 8.2.1. Diagnosis
- 8.1. Market Analysis, Insights and Forecast - by Cancer Type
- 9. Middle East and Africa Skin Cancer Treatment Industry Analysis, Insights and Forecast, 2019-2031
- 9.1. Market Analysis, Insights and Forecast - by Cancer Type
- 9.1.1. Melanoma
- 9.1.2. Non-melanoma
- 9.2. Market Analysis, Insights and Forecast - by Type
- 9.2.1. Diagnosis
- 9.2.1.1. Dermatoscopy
- 9.2.1.2. Biopsy
- 9.2.1.3. Genetic Tests
- 9.2.1.4. Others
- 9.2.2. Therapeutics
- 9.2.2.1. Chemotherapy
- 9.2.2.2. Immunotherapy
- 9.2.2.3. Targeted Therapy
- 9.2.1. Diagnosis
- 9.1. Market Analysis, Insights and Forecast - by Cancer Type
- 10. South America Skin Cancer Treatment Industry Analysis, Insights and Forecast, 2019-2031
- 10.1. Market Analysis, Insights and Forecast - by Cancer Type
- 10.1.1. Melanoma
- 10.1.2. Non-melanoma
- 10.2. Market Analysis, Insights and Forecast - by Type
- 10.2.1. Diagnosis
- 10.2.1.1. Dermatoscopy
- 10.2.1.2. Biopsy
- 10.2.1.3. Genetic Tests
- 10.2.1.4. Others
- 10.2.2. Therapeutics
- 10.2.2.1. Chemotherapy
- 10.2.2.2. Immunotherapy
- 10.2.2.3. Targeted Therapy
- 10.2.1. Diagnosis
- 10.1. Market Analysis, Insights and Forecast - by Cancer Type
- 11. North Americ Skin Cancer Treatment Industry Analysis, Insights and Forecast, 2019-2031
- 11.1. Market Analysis, Insights and Forecast - By Country/Sub-region
- 11.1.1 United States
- 11.1.2 Canada
- 11.1.3 Mexico
- 12. South America Skin Cancer Treatment Industry Analysis, Insights and Forecast, 2019-2031
- 12.1. Market Analysis, Insights and Forecast - By Country/Sub-region
- 12.1.1 Brazil
- 12.1.2 Mexico
- 12.1.3 Rest of South America
- 13. Europe Skin Cancer Treatment Industry Analysis, Insights and Forecast, 2019-2031
- 13.1. Market Analysis, Insights and Forecast - By Country/Sub-region
- 13.1.1 Germany
- 13.1.2 United Kingdom
- 13.1.3 France
- 13.1.4 Italy
- 13.1.5 Spain
- 13.1.6 Rest of Europe
- 14. Asia Pacific Skin Cancer Treatment Industry Analysis, Insights and Forecast, 2019-2031
- 14.1. Market Analysis, Insights and Forecast - By Country/Sub-region
- 14.1.1 China
- 14.1.2 Japan
- 14.1.3 India
- 14.1.4 South Korea
- 14.1.5 Taiwan
- 14.1.6 Australia
- 14.1.7 Rest of Asia-Pacific
- 15. MEA Skin Cancer Treatment Industry Analysis, Insights and Forecast, 2019-2031
- 15.1. Market Analysis, Insights and Forecast - By Country/Sub-region
- 15.1.1 Middle East
- 15.1.2 Africa
- 16. Competitive Analysis
- 16.1. Global Market Share Analysis 2024
- 16.2. Company Profiles
- 16.2.1 Sirnaomics Inc *List Not Exhaustive
- 16.2.1.1. Overview
- 16.2.1.2. Products
- 16.2.1.3. SWOT Analysis
- 16.2.1.4. Recent Developments
- 16.2.1.5. Financials (Based on Availability)
- 16.2.2 Daiichi Sankyo Company Limited
- 16.2.2.1. Overview
- 16.2.2.2. Products
- 16.2.2.3. SWOT Analysis
- 16.2.2.4. Recent Developments
- 16.2.2.5. Financials (Based on Availability)
- 16.2.3 Sanofi
- 16.2.3.1. Overview
- 16.2.3.2. Products
- 16.2.3.3. SWOT Analysis
- 16.2.3.4. Recent Developments
- 16.2.3.5. Financials (Based on Availability)
- 16.2.4 Novartis AG
- 16.2.4.1. Overview
- 16.2.4.2. Products
- 16.2.4.3. SWOT Analysis
- 16.2.4.4. Recent Developments
- 16.2.4.5. Financials (Based on Availability)
- 16.2.5 Amgen Inc
- 16.2.5.1. Overview
- 16.2.5.2. Products
- 16.2.5.3. SWOT Analysis
- 16.2.5.4. Recent Developments
- 16.2.5.5. Financials (Based on Availability)
- 16.2.6 Merck & Co Inc
- 16.2.6.1. Overview
- 16.2.6.2. Products
- 16.2.6.3. SWOT Analysis
- 16.2.6.4. Recent Developments
- 16.2.6.5. Financials (Based on Availability)
- 16.2.7 F Hoffmann-La Roche Ltd
- 16.2.7.1. Overview
- 16.2.7.2. Products
- 16.2.7.3. SWOT Analysis
- 16.2.7.4. Recent Developments
- 16.2.7.5. Financials (Based on Availability)
- 16.2.8 Abbott
- 16.2.8.1. Overview
- 16.2.8.2. Products
- 16.2.8.3. SWOT Analysis
- 16.2.8.4. Recent Developments
- 16.2.8.5. Financials (Based on Availability)
- 16.2.9 Labcorp
- 16.2.9.1. Overview
- 16.2.9.2. Products
- 16.2.9.3. SWOT Analysis
- 16.2.9.4. Recent Developments
- 16.2.9.5. Financials (Based on Availability)
- 16.2.10 Sun Pharmaceutical Industries Ltd
- 16.2.10.1. Overview
- 16.2.10.2. Products
- 16.2.10.3. SWOT Analysis
- 16.2.10.4. Recent Developments
- 16.2.10.5. Financials (Based on Availability)
- 16.2.11 QIAGEN
- 16.2.11.1. Overview
- 16.2.11.2. Products
- 16.2.11.3. SWOT Analysis
- 16.2.11.4. Recent Developments
- 16.2.11.5. Financials (Based on Availability)
- 16.2.12 Bristol-Myers Squibb Company
- 16.2.12.1. Overview
- 16.2.12.2. Products
- 16.2.12.3. SWOT Analysis
- 16.2.12.4. Recent Developments
- 16.2.12.5. Financials (Based on Availability)
- 16.2.13 Pfizer Inc
- 16.2.13.1. Overview
- 16.2.13.2. Products
- 16.2.13.3. SWOT Analysis
- 16.2.13.4. Recent Developments
- 16.2.13.5. Financials (Based on Availability)
- 16.2.1 Sirnaomics Inc *List Not Exhaustive
List of Figures
- Figure 1: Global Skin Cancer Treatment Industry Revenue Breakdown (Million, %) by Region 2024 & 2032
- Figure 2: North Americ Skin Cancer Treatment Industry Revenue (Million), by Country 2024 & 2032
- Figure 3: North Americ Skin Cancer Treatment Industry Revenue Share (%), by Country 2024 & 2032
- Figure 4: South America Skin Cancer Treatment Industry Revenue (Million), by Country 2024 & 2032
- Figure 5: South America Skin Cancer Treatment Industry Revenue Share (%), by Country 2024 & 2032
- Figure 6: Europe Skin Cancer Treatment Industry Revenue (Million), by Country 2024 & 2032
- Figure 7: Europe Skin Cancer Treatment Industry Revenue Share (%), by Country 2024 & 2032
- Figure 8: Asia Pacific Skin Cancer Treatment Industry Revenue (Million), by Country 2024 & 2032
- Figure 9: Asia Pacific Skin Cancer Treatment Industry Revenue Share (%), by Country 2024 & 2032
- Figure 10: MEA Skin Cancer Treatment Industry Revenue (Million), by Country 2024 & 2032
- Figure 11: MEA Skin Cancer Treatment Industry Revenue Share (%), by Country 2024 & 2032
- Figure 12: North America Skin Cancer Treatment Industry Revenue (Million), by Cancer Type 2024 & 2032
- Figure 13: North America Skin Cancer Treatment Industry Revenue Share (%), by Cancer Type 2024 & 2032
- Figure 14: North America Skin Cancer Treatment Industry Revenue (Million), by Type 2024 & 2032
- Figure 15: North America Skin Cancer Treatment Industry Revenue Share (%), by Type 2024 & 2032
- Figure 16: North America Skin Cancer Treatment Industry Revenue (Million), by Country 2024 & 2032
- Figure 17: North America Skin Cancer Treatment Industry Revenue Share (%), by Country 2024 & 2032
- Figure 18: Europe Skin Cancer Treatment Industry Revenue (Million), by Cancer Type 2024 & 2032
- Figure 19: Europe Skin Cancer Treatment Industry Revenue Share (%), by Cancer Type 2024 & 2032
- Figure 20: Europe Skin Cancer Treatment Industry Revenue (Million), by Type 2024 & 2032
- Figure 21: Europe Skin Cancer Treatment Industry Revenue Share (%), by Type 2024 & 2032
- Figure 22: Europe Skin Cancer Treatment Industry Revenue (Million), by Country 2024 & 2032
- Figure 23: Europe Skin Cancer Treatment Industry Revenue Share (%), by Country 2024 & 2032
- Figure 24: Asia Pacific Skin Cancer Treatment Industry Revenue (Million), by Cancer Type 2024 & 2032
- Figure 25: Asia Pacific Skin Cancer Treatment Industry Revenue Share (%), by Cancer Type 2024 & 2032
- Figure 26: Asia Pacific Skin Cancer Treatment Industry Revenue (Million), by Type 2024 & 2032
- Figure 27: Asia Pacific Skin Cancer Treatment Industry Revenue Share (%), by Type 2024 & 2032
- Figure 28: Asia Pacific Skin Cancer Treatment Industry Revenue (Million), by Country 2024 & 2032
- Figure 29: Asia Pacific Skin Cancer Treatment Industry Revenue Share (%), by Country 2024 & 2032
- Figure 30: Middle East and Africa Skin Cancer Treatment Industry Revenue (Million), by Cancer Type 2024 & 2032
- Figure 31: Middle East and Africa Skin Cancer Treatment Industry Revenue Share (%), by Cancer Type 2024 & 2032
- Figure 32: Middle East and Africa Skin Cancer Treatment Industry Revenue (Million), by Type 2024 & 2032
- Figure 33: Middle East and Africa Skin Cancer Treatment Industry Revenue Share (%), by Type 2024 & 2032
- Figure 34: Middle East and Africa Skin Cancer Treatment Industry Revenue (Million), by Country 2024 & 2032
- Figure 35: Middle East and Africa Skin Cancer Treatment Industry Revenue Share (%), by Country 2024 & 2032
- Figure 36: South America Skin Cancer Treatment Industry Revenue (Million), by Cancer Type 2024 & 2032
- Figure 37: South America Skin Cancer Treatment Industry Revenue Share (%), by Cancer Type 2024 & 2032
- Figure 38: South America Skin Cancer Treatment Industry Revenue (Million), by Type 2024 & 2032
- Figure 39: South America Skin Cancer Treatment Industry Revenue Share (%), by Type 2024 & 2032
- Figure 40: South America Skin Cancer Treatment Industry Revenue (Million), by Country 2024 & 2032
- Figure 41: South America Skin Cancer Treatment Industry Revenue Share (%), by Country 2024 & 2032
List of Tables
- Table 1: Global Skin Cancer Treatment Industry Revenue Million Forecast, by Region 2019 & 2032
- Table 2: Global Skin Cancer Treatment Industry Revenue Million Forecast, by Cancer Type 2019 & 2032
- Table 3: Global Skin Cancer Treatment Industry Revenue Million Forecast, by Type 2019 & 2032
- Table 4: Global Skin Cancer Treatment Industry Revenue Million Forecast, by Region 2019 & 2032
- Table 5: Global Skin Cancer Treatment Industry Revenue Million Forecast, by Country 2019 & 2032
- Table 6: United States Skin Cancer Treatment Industry Revenue (Million) Forecast, by Application 2019 & 2032
- Table 7: Canada Skin Cancer Treatment Industry Revenue (Million) Forecast, by Application 2019 & 2032
- Table 8: Mexico Skin Cancer Treatment Industry Revenue (Million) Forecast, by Application 2019 & 2032
- Table 9: Global Skin Cancer Treatment Industry Revenue Million Forecast, by Country 2019 & 2032
- Table 10: Brazil Skin Cancer Treatment Industry Revenue (Million) Forecast, by Application 2019 & 2032
- Table 11: Mexico Skin Cancer Treatment Industry Revenue (Million) Forecast, by Application 2019 & 2032
- Table 12: Rest of South America Skin Cancer Treatment Industry Revenue (Million) Forecast, by Application 2019 & 2032
- Table 13: Global Skin Cancer Treatment Industry Revenue Million Forecast, by Country 2019 & 2032
- Table 14: Germany Skin Cancer Treatment Industry Revenue (Million) Forecast, by Application 2019 & 2032
- Table 15: United Kingdom Skin Cancer Treatment Industry Revenue (Million) Forecast, by Application 2019 & 2032
- Table 16: France Skin Cancer Treatment Industry Revenue (Million) Forecast, by Application 2019 & 2032
- Table 17: Italy Skin Cancer Treatment Industry Revenue (Million) Forecast, by Application 2019 & 2032
- Table 18: Spain Skin Cancer Treatment Industry Revenue (Million) Forecast, by Application 2019 & 2032
- Table 19: Rest of Europe Skin Cancer Treatment Industry Revenue (Million) Forecast, by Application 2019 & 2032
- Table 20: Global Skin Cancer Treatment Industry Revenue Million Forecast, by Country 2019 & 2032
- Table 21: China Skin Cancer Treatment Industry Revenue (Million) Forecast, by Application 2019 & 2032
- Table 22: Japan Skin Cancer Treatment Industry Revenue (Million) Forecast, by Application 2019 & 2032
- Table 23: India Skin Cancer Treatment Industry Revenue (Million) Forecast, by Application 2019 & 2032
- Table 24: South Korea Skin Cancer Treatment Industry Revenue (Million) Forecast, by Application 2019 & 2032
- Table 25: Taiwan Skin Cancer Treatment Industry Revenue (Million) Forecast, by Application 2019 & 2032
- Table 26: Australia Skin Cancer Treatment Industry Revenue (Million) Forecast, by Application 2019 & 2032
- Table 27: Rest of Asia-Pacific Skin Cancer Treatment Industry Revenue (Million) Forecast, by Application 2019 & 2032
- Table 28: Global Skin Cancer Treatment Industry Revenue Million Forecast, by Country 2019 & 2032
- Table 29: Middle East Skin Cancer Treatment Industry Revenue (Million) Forecast, by Application 2019 & 2032
- Table 30: Africa Skin Cancer Treatment Industry Revenue (Million) Forecast, by Application 2019 & 2032
- Table 31: Global Skin Cancer Treatment Industry Revenue Million Forecast, by Cancer Type 2019 & 2032
- Table 32: Global Skin Cancer Treatment Industry Revenue Million Forecast, by Type 2019 & 2032
- Table 33: Global Skin Cancer Treatment Industry Revenue Million Forecast, by Country 2019 & 2032
- Table 34: United States Skin Cancer Treatment Industry Revenue (Million) Forecast, by Application 2019 & 2032
- Table 35: Canada Skin Cancer Treatment Industry Revenue (Million) Forecast, by Application 2019 & 2032
- Table 36: Mexico Skin Cancer Treatment Industry Revenue (Million) Forecast, by Application 2019 & 2032
- Table 37: Global Skin Cancer Treatment Industry Revenue Million Forecast, by Cancer Type 2019 & 2032
- Table 38: Global Skin Cancer Treatment Industry Revenue Million Forecast, by Type 2019 & 2032
- Table 39: Global Skin Cancer Treatment Industry Revenue Million Forecast, by Country 2019 & 2032
- Table 40: Germany Skin Cancer Treatment Industry Revenue (Million) Forecast, by Application 2019 & 2032
- Table 41: United Kingdom Skin Cancer Treatment Industry Revenue (Million) Forecast, by Application 2019 & 2032
- Table 42: France Skin Cancer Treatment Industry Revenue (Million) Forecast, by Application 2019 & 2032
- Table 43: Italy Skin Cancer Treatment Industry Revenue (Million) Forecast, by Application 2019 & 2032
- Table 44: Spain Skin Cancer Treatment Industry Revenue (Million) Forecast, by Application 2019 & 2032
- Table 45: Rest of Europe Skin Cancer Treatment Industry Revenue (Million) Forecast, by Application 2019 & 2032
- Table 46: Global Skin Cancer Treatment Industry Revenue Million Forecast, by Cancer Type 2019 & 2032
- Table 47: Global Skin Cancer Treatment Industry Revenue Million Forecast, by Type 2019 & 2032
- Table 48: Global Skin Cancer Treatment Industry Revenue Million Forecast, by Country 2019 & 2032
- Table 49: China Skin Cancer Treatment Industry Revenue (Million) Forecast, by Application 2019 & 2032
- Table 50: Japan Skin Cancer Treatment Industry Revenue (Million) Forecast, by Application 2019 & 2032
- Table 51: India Skin Cancer Treatment Industry Revenue (Million) Forecast, by Application 2019 & 2032
- Table 52: Australia Skin Cancer Treatment Industry Revenue (Million) Forecast, by Application 2019 & 2032
- Table 53: South Korea Skin Cancer Treatment Industry Revenue (Million) Forecast, by Application 2019 & 2032
- Table 54: Rest of Asia Pacific Skin Cancer Treatment Industry Revenue (Million) Forecast, by Application 2019 & 2032
- Table 55: Global Skin Cancer Treatment Industry Revenue Million Forecast, by Cancer Type 2019 & 2032
- Table 56: Global Skin Cancer Treatment Industry Revenue Million Forecast, by Type 2019 & 2032
- Table 57: Global Skin Cancer Treatment Industry Revenue Million Forecast, by Country 2019 & 2032
- Table 58: GCC Skin Cancer Treatment Industry Revenue (Million) Forecast, by Application 2019 & 2032
- Table 59: South Africa Skin Cancer Treatment Industry Revenue (Million) Forecast, by Application 2019 & 2032
- Table 60: Rest of Middle East and Africa Skin Cancer Treatment Industry Revenue (Million) Forecast, by Application 2019 & 2032
- Table 61: Global Skin Cancer Treatment Industry Revenue Million Forecast, by Cancer Type 2019 & 2032
- Table 62: Global Skin Cancer Treatment Industry Revenue Million Forecast, by Type 2019 & 2032
- Table 63: Global Skin Cancer Treatment Industry Revenue Million Forecast, by Country 2019 & 2032
- Table 64: Brazil Skin Cancer Treatment Industry Revenue (Million) Forecast, by Application 2019 & 2032
- Table 65: Argentina Skin Cancer Treatment Industry Revenue (Million) Forecast, by Application 2019 & 2032
- Table 66: Rest of South America Skin Cancer Treatment Industry Revenue (Million) Forecast, by Application 2019 & 2032
Frequently Asked Questions
1. What is the projected Compound Annual Growth Rate (CAGR) of the Skin Cancer Treatment Industry?
The projected CAGR is approximately 5.21%.
2. Which companies are prominent players in the Skin Cancer Treatment Industry?
Key companies in the market include Sirnaomics Inc *List Not Exhaustive, Daiichi Sankyo Company Limited, Sanofi, Novartis AG, Amgen Inc, Merck & Co Inc, F Hoffmann-La Roche Ltd, Abbott, Labcorp, Sun Pharmaceutical Industries Ltd, QIAGEN, Bristol-Myers Squibb Company, Pfizer Inc.
3. What are the main segments of the Skin Cancer Treatment Industry?
The market segments include Cancer Type, Type.
4. Can you provide details about the market size?
The market size is estimated to be USD 13.82 Million as of 2022.
5. What are some drivers contributing to market growth?
Increasing Incidence of Skin Cancer; Rising Awareness About Skin Cancer; Extensive Research and Developments.
6. What are the notable trends driving market growth?
Non-Melanoma by Cancer Type Segment is Expected to Grow Over the Forecast Period.
7. Are there any restraints impacting market growth?
High Cost Associated with Therapy; Stringent Regulatory Framework.
8. Can you provide examples of recent developments in the market?
In March 2022, the United States Food and Drug Administration approved nivolumab and relatlimab-rmbw (Opdualag, Bristol-Myers Squibb Company) for adult and pediatric patients 12 years of age or older with unresectable or metastatic melanoma. Opdualag is a fixed-dose combination of the LAG-3-blocking antibody relatlimab and the programmed death receptor-1 blocking antibody nivolumab.
9. What pricing options are available for accessing the report?
Pricing options include single-user, multi-user, and enterprise licenses priced at USD 4750, USD 5250, and USD 8750 respectively.
10. Is the market size provided in terms of value or volume?
The market size is provided in terms of value, measured in Million.
11. Are there any specific market keywords associated with the report?
Yes, the market keyword associated with the report is "Skin Cancer Treatment Industry," which aids in identifying and referencing the specific market segment covered.
12. How do I determine which pricing option suits my needs best?
The pricing options vary based on user requirements and access needs. Individual users may opt for single-user licenses, while businesses requiring broader access may choose multi-user or enterprise licenses for cost-effective access to the report.
13. Are there any additional resources or data provided in the Skin Cancer Treatment Industry report?
While the report offers comprehensive insights, it's advisable to review the specific contents or supplementary materials provided to ascertain if additional resources or data are available.
14. How can I stay updated on further developments or reports in the Skin Cancer Treatment Industry?
To stay informed about further developments, trends, and reports in the Skin Cancer Treatment Industry, consider subscribing to industry newsletters, following relevant companies and organizations, or regularly checking reputable industry news sources and publications.
Methodology
Step 1 - Identification of Relevant Samples Size from Population Database


Step 2 - Approaches for Defining Global Market Size (Value, Volume* & Price*)

Note*: In applicable scenarios
Step 3 - Data Sources
Primary Research
- Web Analytics
- Survey Reports
- Research Institute
- Latest Research Reports
- Opinion Leaders
Secondary Research
- Annual Reports
- White Paper
- Latest Press Release
- Industry Association
- Paid Database
- Investor Presentations

Step 4 - Data Triangulation
Involves using different sources of information in order to increase the validity of a study
These sources are likely to be stakeholders in a program - participants, other researchers, program staff, other community members, and so on.
Then we put all data in single framework & apply various statistical tools to find out the dynamic on the market.
During the analysis stage, feedback from the stakeholder groups would be compared to determine areas of agreement as well as areas of divergence


