
Key Insights
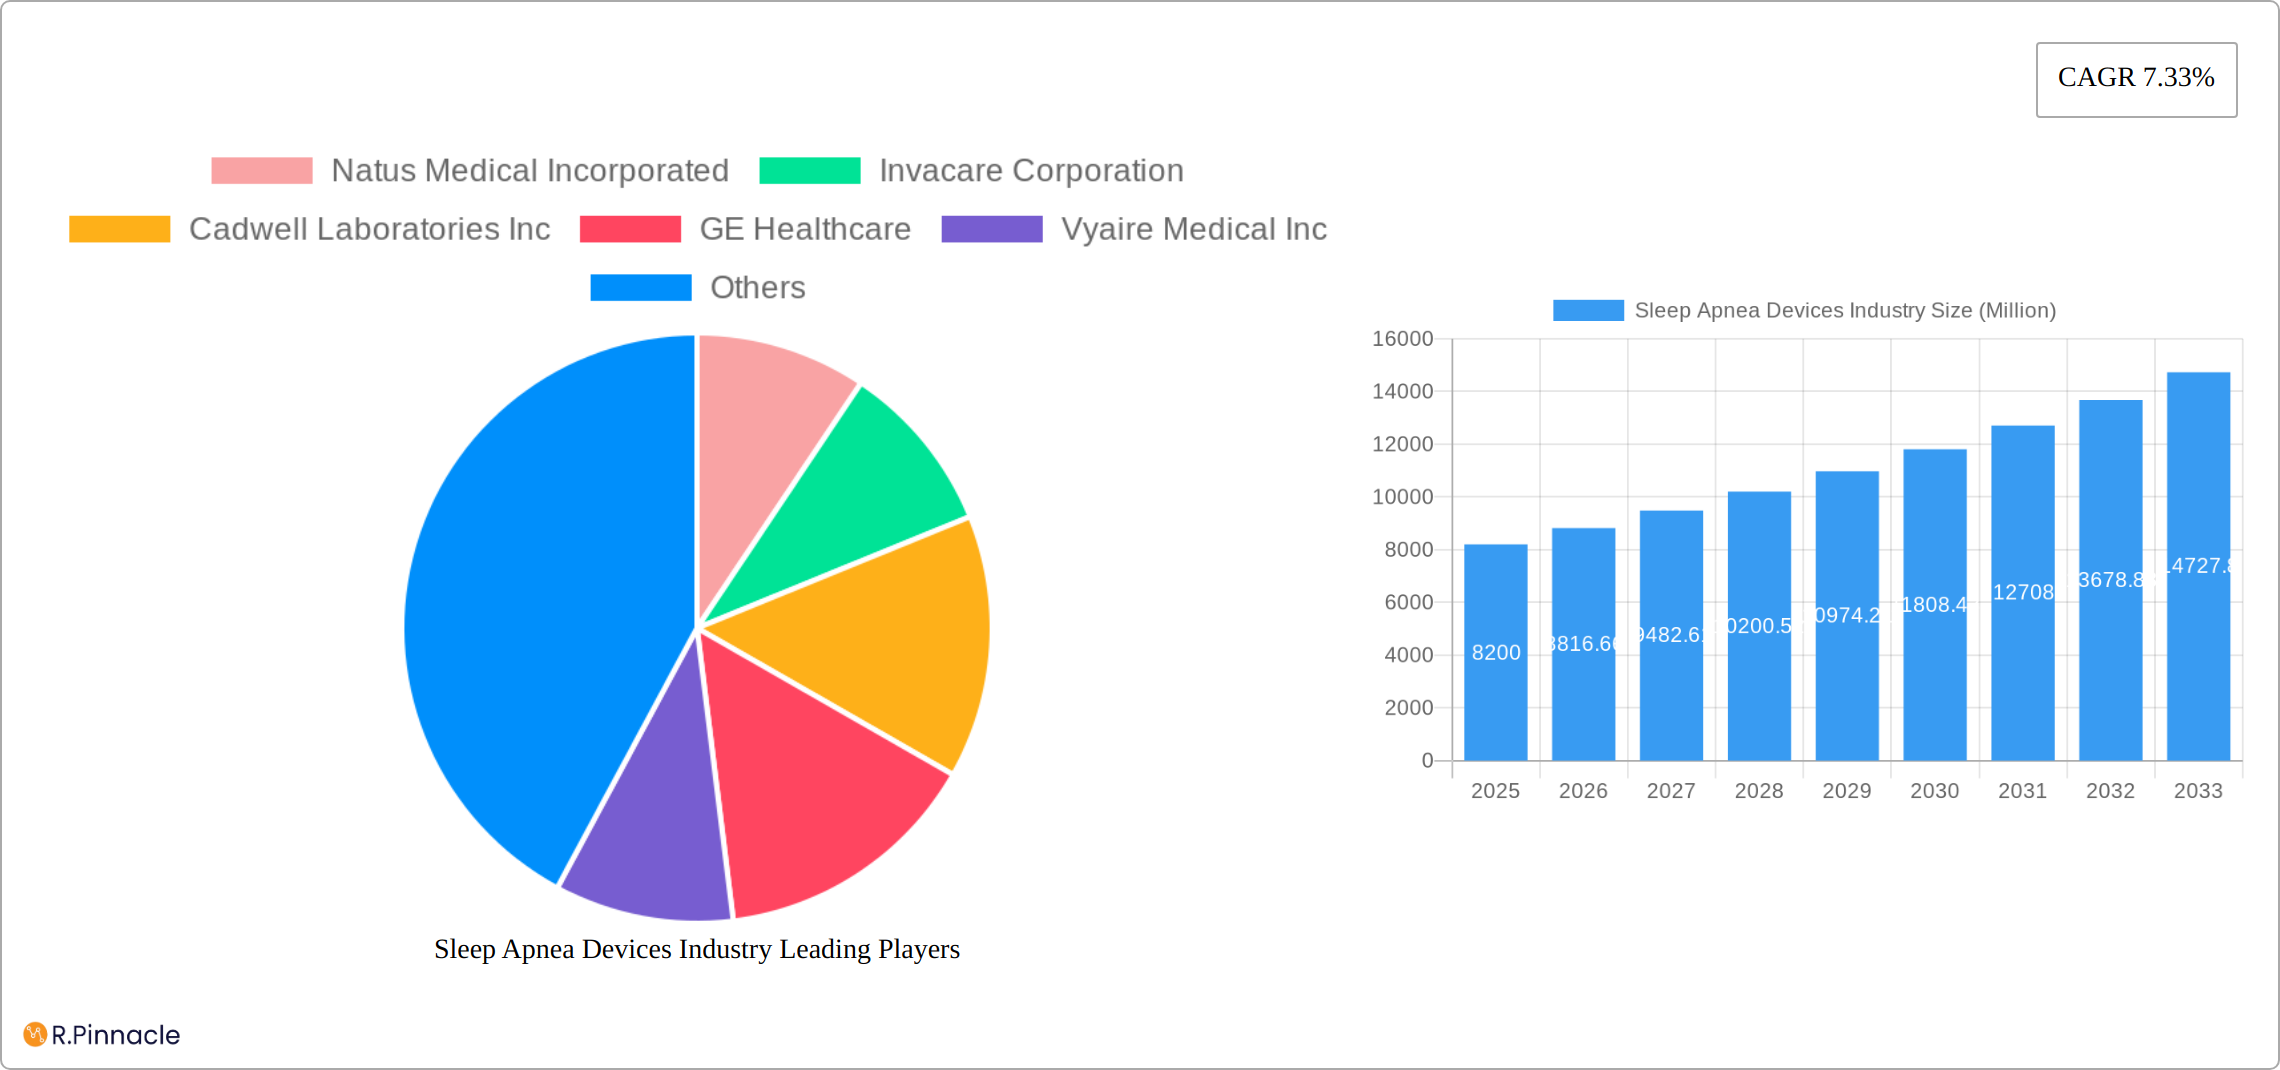
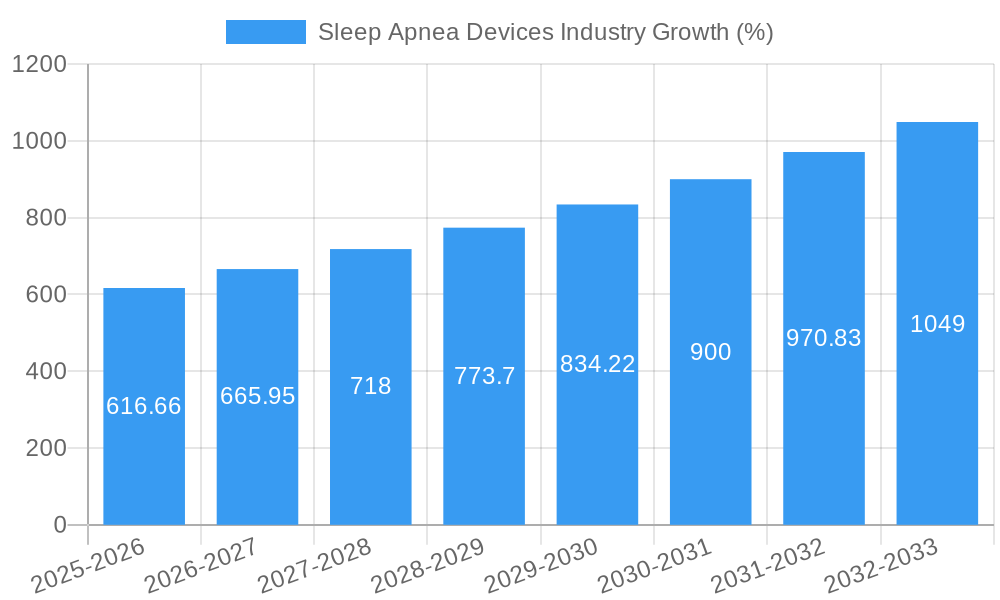
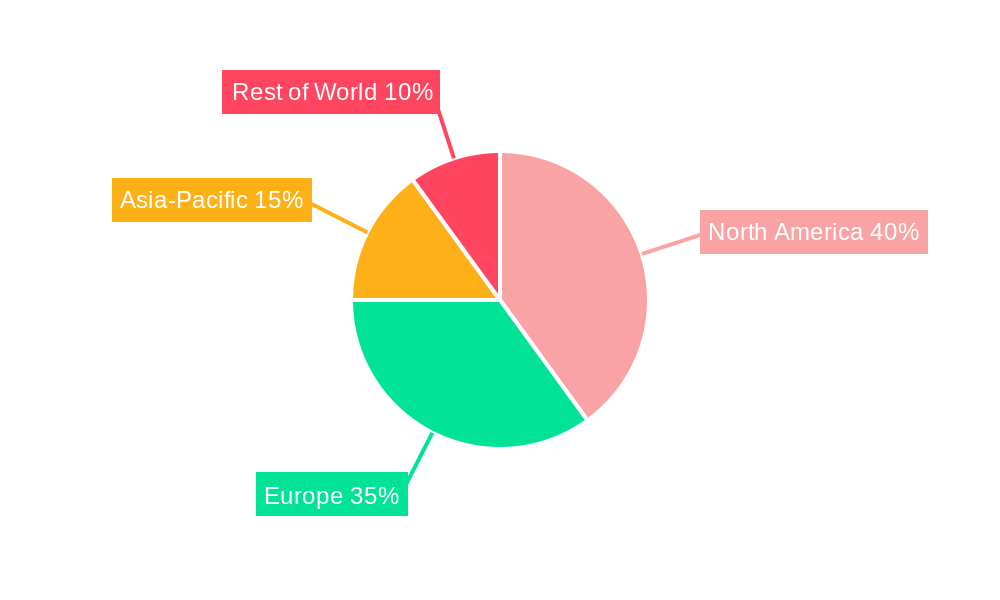
The global sleep apnea devices market, valued at $8.20 billion in 2025, is projected to experience robust growth, driven by rising prevalence of sleep apnea, an increasing geriatric population, and growing awareness about the condition's health implications. A compound annual growth rate (CAGR) of 7.33% is anticipated from 2025 to 2033, indicating substantial market expansion. Key market drivers include technological advancements leading to smaller, more comfortable devices, the introduction of innovative treatment options like minimally invasive surgeries, and increased healthcare spending globally. The market is segmented by product type (PAP devices, BiPAP devices, oxygen devices, oral appliances, ASV devices, masks, and accessories) and application (sleep apnea, snoring, and other sleep disorders), with PAP devices currently dominating the market share due to their established efficacy. North America and Europe currently hold significant market share due to high healthcare expenditure and advanced healthcare infrastructure, but the Asia-Pacific region is poised for rapid growth fueled by increasing disposable incomes and rising awareness. Market restraints include high device costs, potential side effects of certain therapies, and the need for consistent adherence to treatment regimens.
The competitive landscape is characterized by a mix of established players like ResMed, Philips, and Fisher & Paykel Healthcare, alongside emerging companies focusing on innovative technologies. Successful market strategies will focus on product innovation, expanding distribution networks, particularly in emerging markets, and strengthening patient education initiatives to enhance treatment adherence. Further market segmentation based on severity of sleep apnea and patient demographics will also prove crucial for targeted marketing and product development. The long-term outlook remains positive, with the market expected to witness significant expansion over the forecast period, propelled by continuous technological advancements and a growing understanding of the long-term health consequences of untreated sleep apnea. The continued focus on improving device usability and comfort, coupled with improved reimbursement policies, will be instrumental in driving market growth.
Sleep Apnea Devices Industry: A Comprehensive Market Report (2019-2033)
This in-depth report provides a comprehensive analysis of the Sleep Apnea Devices industry, offering actionable insights for industry professionals, investors, and stakeholders. With a study period spanning 2019-2033, a base year of 2025, and a forecast period of 2025-2033, this report delivers a data-driven perspective on market trends, growth drivers, and future opportunities. The market is segmented by product type, application, and region, providing a granular view of the competitive landscape. The total market size is projected to reach xx Million by 2033.
Sleep Apnea Devices Industry Market Structure & Innovation Trends
This section analyzes the market structure, highlighting key players, their market share, and recent mergers and acquisitions (M&A) activities. The report examines the impact of regulatory frameworks, technological advancements, and the presence of substitute products on the market dynamics. End-user demographics and their influence on market demand are also explored.
Market Concentration: The sleep apnea devices market is moderately concentrated, with key players like ResMed and Philips holding significant market shares. However, smaller companies are actively innovating and challenging the established players. Precise market share data for each company is available within the full report.
Innovation Drivers: Technological advancements, such as the development of more comfortable and effective masks and the integration of smart technology into devices, are driving innovation. Regulatory changes that encourage the adoption of new technologies also play a vital role.
M&A Activities: The report documents recent M&A activity, including deal values, and analyzes their impact on market consolidation and competition. For instance, the formation of Primasun (ResMed and Verily) signifies a strategic move toward early intervention and comprehensive sleep disorder management. The report includes details on xx Million worth of M&A deals during the historical period.
Regulatory Frameworks: The report details relevant regulatory frameworks and their influence on market access and product development.
Product Substitutes: The availability of alternative treatment options for sleep apnea, such as lifestyle modifications and surgical procedures, is considered.
Sleep Apnea Devices Industry Market Dynamics & Trends
This section delves into the market's dynamic nature, examining growth drivers, technological disruptions, consumer preferences, and competitive dynamics. Key metrics, such as the Compound Annual Growth Rate (CAGR) and market penetration rates, provide quantitative insights. The market is experiencing significant growth, driven by several factors detailed in the report.
The report analyzes the increasing prevalence of sleep apnea and other sleep disorders, the rising awareness about these conditions, and advancements in diagnostic and treatment technologies. Furthermore, changing consumer preferences toward home-based treatment options and the growing adoption of telehealth contribute to the market’s expansion. The CAGR for the forecast period (2025-2033) is projected to be xx%, indicating substantial growth potential. Market penetration rates in various regions are also analyzed. Competitive dynamics are assessed through an examination of strategies adopted by key players, including product innovation, market expansion, and strategic partnerships.
Dominant Regions & Segments in Sleep Apnea Devices Industry
This section identifies the leading regions and segments within the sleep apnea devices market. A detailed analysis of market dominance is conducted, identifying key factors driving growth in each region and segment.
Leading Region: North America currently dominates the market, driven by high awareness levels and robust healthcare infrastructure. However, the Asia-Pacific region is expected to witness significant growth in the coming years.
Dominant Segments:
- Product Type: PAP (Positive Airway Pressure) devices currently hold the largest market share due to their effectiveness in treating sleep apnea. However, the demand for oral appliances is expected to increase.
- Application: The primary application is the treatment of sleep apnea, followed by snoring and other sleep disorders.
- Region: North America is the largest region, followed by Europe and Asia-Pacific.
Key Drivers: The report provides a detailed breakdown of factors such as economic growth, healthcare expenditure, and the prevalence of sleep disorders, which drive market growth in each region and segment. Specifically, strong economic conditions in North America and the rising incidence of sleep disorders in Asia-Pacific are highlighted.
Sleep Apnea Devices Industry Product Innovations
Continuous advancements in sleep apnea device technology are driving market growth. Recent innovations include smaller, quieter, and more comfortable PAP devices, improved mask designs, and integrated monitoring capabilities. These advancements cater to evolving patient preferences and improve treatment efficacy. The integration of smart technology enables remote monitoring and data analysis, facilitating personalized treatment approaches. This leads to improved patient compliance and treatment outcomes, boosting market demand.
Report Scope & Segmentation Analysis
This report segments the sleep apnea devices market by product type (PAP devices, BiPAP devices, oxygen devices, oral appliances, ASV devices, masks, and accessories), application (sleep apnea, snoring, and other sleep disorders), and region (North America, Europe, Asia-Pacific). Each segment’s growth projections, market size estimates, and competitive dynamics are detailed in the full report. Specific data points on market sizes and growth forecasts for each segment are provided.
Key Drivers of Sleep Apnea Devices Industry Growth
Several factors are driving the growth of the sleep apnea devices industry. These include the increasing prevalence of sleep apnea, technological advancements leading to better and more comfortable devices, growing awareness among the population, and supportive regulatory frameworks. Increased healthcare expenditure and rising disposable incomes also contribute to market expansion. The report details the specific impact of each driver.
Challenges in the Sleep Apnea Devices Industry Sector
The sleep apnea devices industry faces challenges, including the high cost of devices, potential side effects associated with treatment, and reimbursement complexities. Supply chain disruptions and intense competition also impact market dynamics. The report quantifies the impact of these challenges on market growth and provides insights into strategies to mitigate these challenges.
Emerging Opportunities in Sleep Apnea Devices Industry
The industry presents opportunities in developing innovative devices that address unmet needs, expanding into emerging markets, and developing telehealth solutions for remote monitoring and treatment. The rising focus on personalized medicine and the adoption of AI/ML in diagnostics and treatment also create significant opportunities. The report provides in-depth analysis of specific opportunities.
Leading Players in the Sleep Apnea Devices Industry Market
- Natus Medical Incorporated
- Invacare Corporation
- Cadwell Laboratories Inc
- GE Healthcare
- Vyaire Medical Inc
- Resmed
- Oventus Medical
- Fisher & Paykel Healthcare Limited
- Koninklijke Philips NV
- Somnomed
- Teleflex Incorporated
- Nihon Kohden Corporation
Key Developments in Sleep Apnea Devices Industry
- November 2022: ResMed and Verily announced the formation of Primasun, a significant development aimed at improving early identification and comprehensive management of sleep disorders.
- October 2022: Airway Management launched flexTAP, a premium oral appliance for snoring and mild-to-moderate obstructive sleep apnea, expanding treatment options.
Future Outlook for Sleep Apnea Devices Industry Market
The sleep apnea devices market is poised for continued growth, driven by technological advancements, increasing prevalence of sleep disorders, and expanding access to healthcare. Strategic partnerships, product diversification, and focus on personalized medicine will be key to success for companies in this sector. The market is expected to witness robust growth in the forecast period, driven by factors outlined throughout this report.
Sleep Apnea Devices Industry Segmentation
-
1. Diagnostic Devices
- 1.1. Polysomnography Devices (PSG)
- 1.2. Pulse Oximeters
- 1.3. Actigraphy Devices
-
2. Therapeutic Devices
-
2.1. Positive Airway Pressure (PAP) Devices
- 2.1.1. Continuous Positive Airway Pressure (CPAP) Devices
- 2.1.2. Bi-level Positive Airway Pressure (BiPAP) Devices
-
2.2. Oxygen Devices
- 2.2.1. Oxygen Concentrators
- 2.2.2. Portable Oxygen Concentrators
- 2.2.3. Liquid Portable Oxygen
- 2.3. Oral Appliances
- 2.4. Adaptive Servo Ventilation (ASV) Devices
- 2.5. Masks and Accessories
-
2.1. Positive Airway Pressure (PAP) Devices
Sleep Apnea Devices Industry Segmentation By Geography
-
1. North America
- 1.1. United States
- 1.2. Canada
- 1.3. Mexico
-
2. Europe
- 2.1. Germany
- 2.2. United Kingdom
- 2.3. France
- 2.4. Italy
- 2.5. Spain
- 2.6. Rest of Europe
-
3. Asia Pacific
- 3.1. China
- 3.2. Japan
- 3.3. India
- 3.4. Australia
- 3.5. South Korea
- 3.6. Rest of Asia Pacific
-
4. Middle East and Africa
- 4.1. GCC
- 4.2. South Africa
- 4.3. Rest of Middle East and Africa
-
5. South America
- 5.1. Brazil
- 5.2. Argentina
- 5.3. Rest of South America
Sleep Apnea Devices Industry REPORT HIGHLIGHTS
| Aspects | Details |
|---|---|
| Study Period | 2019-2033 |
| Base Year | 2024 |
| Estimated Year | 2025 |
| Forecast Period | 2025-2033 |
| Historical Period | 2019-2024 |
| Growth Rate | CAGR of 7.33% from 2019-2033 |
| Segmentation |
|
Table of Contents
- 1. Introduction
- 1.1. Research Scope
- 1.2. Market Segmentation
- 1.3. Research Methodology
- 1.4. Definitions and Assumptions
- 2. Executive Summary
- 2.1. Introduction
- 3. Market Dynamics
- 3.1. Introduction
- 3.2. Market Drivers
- 3.2.1. Increasing Awareness Among the Patient Population in the Developing Countries; Increase in Prevalence of Obesity and Hypertension; Upcoming Technological Advancements
- 3.3. Market Restrains
- 3.3.1. High Cost of Cpap Machines
- 3.4. Market Trends
- 3.4.1. Pulse Oximeters are Expected to Register the Highest CAGR in the Diagnostic Devices Category
- 4. Market Factor Analysis
- 4.1. Porters Five Forces
- 4.2. Supply/Value Chain
- 4.3. PESTEL analysis
- 4.4. Market Entropy
- 4.5. Patent/Trademark Analysis
- 5. Global Sleep Apnea Devices Industry Analysis, Insights and Forecast, 2019-2031
- 5.1. Market Analysis, Insights and Forecast - by Diagnostic Devices
- 5.1.1. Polysomnography Devices (PSG)
- 5.1.2. Pulse Oximeters
- 5.1.3. Actigraphy Devices
- 5.2. Market Analysis, Insights and Forecast - by Therapeutic Devices
- 5.2.1. Positive Airway Pressure (PAP) Devices
- 5.2.1.1. Continuous Positive Airway Pressure (CPAP) Devices
- 5.2.1.2. Bi-level Positive Airway Pressure (BiPAP) Devices
- 5.2.2. Oxygen Devices
- 5.2.2.1. Oxygen Concentrators
- 5.2.2.2. Portable Oxygen Concentrators
- 5.2.2.3. Liquid Portable Oxygen
- 5.2.3. Oral Appliances
- 5.2.4. Adaptive Servo Ventilation (ASV) Devices
- 5.2.5. Masks and Accessories
- 5.2.1. Positive Airway Pressure (PAP) Devices
- 5.3. Market Analysis, Insights and Forecast - by Region
- 5.3.1. North America
- 5.3.2. Europe
- 5.3.3. Asia Pacific
- 5.3.4. Middle East and Africa
- 5.3.5. South America
- 5.1. Market Analysis, Insights and Forecast - by Diagnostic Devices
- 6. North America Sleep Apnea Devices Industry Analysis, Insights and Forecast, 2019-2031
- 6.1. Market Analysis, Insights and Forecast - by Diagnostic Devices
- 6.1.1. Polysomnography Devices (PSG)
- 6.1.2. Pulse Oximeters
- 6.1.3. Actigraphy Devices
- 6.2. Market Analysis, Insights and Forecast - by Therapeutic Devices
- 6.2.1. Positive Airway Pressure (PAP) Devices
- 6.2.1.1. Continuous Positive Airway Pressure (CPAP) Devices
- 6.2.1.2. Bi-level Positive Airway Pressure (BiPAP) Devices
- 6.2.2. Oxygen Devices
- 6.2.2.1. Oxygen Concentrators
- 6.2.2.2. Portable Oxygen Concentrators
- 6.2.2.3. Liquid Portable Oxygen
- 6.2.3. Oral Appliances
- 6.2.4. Adaptive Servo Ventilation (ASV) Devices
- 6.2.5. Masks and Accessories
- 6.2.1. Positive Airway Pressure (PAP) Devices
- 6.1. Market Analysis, Insights and Forecast - by Diagnostic Devices
- 7. Europe Sleep Apnea Devices Industry Analysis, Insights and Forecast, 2019-2031
- 7.1. Market Analysis, Insights and Forecast - by Diagnostic Devices
- 7.1.1. Polysomnography Devices (PSG)
- 7.1.2. Pulse Oximeters
- 7.1.3. Actigraphy Devices
- 7.2. Market Analysis, Insights and Forecast - by Therapeutic Devices
- 7.2.1. Positive Airway Pressure (PAP) Devices
- 7.2.1.1. Continuous Positive Airway Pressure (CPAP) Devices
- 7.2.1.2. Bi-level Positive Airway Pressure (BiPAP) Devices
- 7.2.2. Oxygen Devices
- 7.2.2.1. Oxygen Concentrators
- 7.2.2.2. Portable Oxygen Concentrators
- 7.2.2.3. Liquid Portable Oxygen
- 7.2.3. Oral Appliances
- 7.2.4. Adaptive Servo Ventilation (ASV) Devices
- 7.2.5. Masks and Accessories
- 7.2.1. Positive Airway Pressure (PAP) Devices
- 7.1. Market Analysis, Insights and Forecast - by Diagnostic Devices
- 8. Asia Pacific Sleep Apnea Devices Industry Analysis, Insights and Forecast, 2019-2031
- 8.1. Market Analysis, Insights and Forecast - by Diagnostic Devices
- 8.1.1. Polysomnography Devices (PSG)
- 8.1.2. Pulse Oximeters
- 8.1.3. Actigraphy Devices
- 8.2. Market Analysis, Insights and Forecast - by Therapeutic Devices
- 8.2.1. Positive Airway Pressure (PAP) Devices
- 8.2.1.1. Continuous Positive Airway Pressure (CPAP) Devices
- 8.2.1.2. Bi-level Positive Airway Pressure (BiPAP) Devices
- 8.2.2. Oxygen Devices
- 8.2.2.1. Oxygen Concentrators
- 8.2.2.2. Portable Oxygen Concentrators
- 8.2.2.3. Liquid Portable Oxygen
- 8.2.3. Oral Appliances
- 8.2.4. Adaptive Servo Ventilation (ASV) Devices
- 8.2.5. Masks and Accessories
- 8.2.1. Positive Airway Pressure (PAP) Devices
- 8.1. Market Analysis, Insights and Forecast - by Diagnostic Devices
- 9. Middle East and Africa Sleep Apnea Devices Industry Analysis, Insights and Forecast, 2019-2031
- 9.1. Market Analysis, Insights and Forecast - by Diagnostic Devices
- 9.1.1. Polysomnography Devices (PSG)
- 9.1.2. Pulse Oximeters
- 9.1.3. Actigraphy Devices
- 9.2. Market Analysis, Insights and Forecast - by Therapeutic Devices
- 9.2.1. Positive Airway Pressure (PAP) Devices
- 9.2.1.1. Continuous Positive Airway Pressure (CPAP) Devices
- 9.2.1.2. Bi-level Positive Airway Pressure (BiPAP) Devices
- 9.2.2. Oxygen Devices
- 9.2.2.1. Oxygen Concentrators
- 9.2.2.2. Portable Oxygen Concentrators
- 9.2.2.3. Liquid Portable Oxygen
- 9.2.3. Oral Appliances
- 9.2.4. Adaptive Servo Ventilation (ASV) Devices
- 9.2.5. Masks and Accessories
- 9.2.1. Positive Airway Pressure (PAP) Devices
- 9.1. Market Analysis, Insights and Forecast - by Diagnostic Devices
- 10. South America Sleep Apnea Devices Industry Analysis, Insights and Forecast, 2019-2031
- 10.1. Market Analysis, Insights and Forecast - by Diagnostic Devices
- 10.1.1. Polysomnography Devices (PSG)
- 10.1.2. Pulse Oximeters
- 10.1.3. Actigraphy Devices
- 10.2. Market Analysis, Insights and Forecast - by Therapeutic Devices
- 10.2.1. Positive Airway Pressure (PAP) Devices
- 10.2.1.1. Continuous Positive Airway Pressure (CPAP) Devices
- 10.2.1.2. Bi-level Positive Airway Pressure (BiPAP) Devices
- 10.2.2. Oxygen Devices
- 10.2.2.1. Oxygen Concentrators
- 10.2.2.2. Portable Oxygen Concentrators
- 10.2.2.3. Liquid Portable Oxygen
- 10.2.3. Oral Appliances
- 10.2.4. Adaptive Servo Ventilation (ASV) Devices
- 10.2.5. Masks and Accessories
- 10.2.1. Positive Airway Pressure (PAP) Devices
- 10.1. Market Analysis, Insights and Forecast - by Diagnostic Devices
- 11. North America Sleep Apnea Devices Industry Analysis, Insights and Forecast, 2019-2031
- 11.1. Market Analysis, Insights and Forecast - By Country/Sub-region
- 11.1.1 United States
- 11.1.2 Canada
- 11.1.3 Mexico
- 12. Europe Sleep Apnea Devices Industry Analysis, Insights and Forecast, 2019-2031
- 12.1. Market Analysis, Insights and Forecast - By Country/Sub-region
- 12.1.1 Germany
- 12.1.2 United Kingdom
- 12.1.3 France
- 12.1.4 Italy
- 12.1.5 Spain
- 12.1.6 Rest of Europe
- 13. Asia Pacific Sleep Apnea Devices Industry Analysis, Insights and Forecast, 2019-2031
- 13.1. Market Analysis, Insights and Forecast - By Country/Sub-region
- 13.1.1 China
- 13.1.2 Japan
- 13.1.3 India
- 13.1.4 Australia
- 13.1.5 South Korea
- 13.1.6 Rest of Asia Pacific
- 14. Middle East and Africa Sleep Apnea Devices Industry Analysis, Insights and Forecast, 2019-2031
- 14.1. Market Analysis, Insights and Forecast - By Country/Sub-region
- 14.1.1 GCC
- 14.1.2 South Africa
- 14.1.3 Rest of Middle East and Africa
- 15. South America Sleep Apnea Devices Industry Analysis, Insights and Forecast, 2019-2031
- 15.1. Market Analysis, Insights and Forecast - By Country/Sub-region
- 15.1.1 Brazil
- 15.1.2 Argentina
- 15.1.3 Rest of South America
- 16. Competitive Analysis
- 16.1. Global Market Share Analysis 2024
- 16.2. Company Profiles
- 16.2.1 Natus Medical Incorporated
- 16.2.1.1. Overview
- 16.2.1.2. Products
- 16.2.1.3. SWOT Analysis
- 16.2.1.4. Recent Developments
- 16.2.1.5. Financials (Based on Availability)
- 16.2.2 Invacare Corporation
- 16.2.2.1. Overview
- 16.2.2.2. Products
- 16.2.2.3. SWOT Analysis
- 16.2.2.4. Recent Developments
- 16.2.2.5. Financials (Based on Availability)
- 16.2.3 Cadwell Laboratories Inc
- 16.2.3.1. Overview
- 16.2.3.2. Products
- 16.2.3.3. SWOT Analysis
- 16.2.3.4. Recent Developments
- 16.2.3.5. Financials (Based on Availability)
- 16.2.4 GE Healthcare
- 16.2.4.1. Overview
- 16.2.4.2. Products
- 16.2.4.3. SWOT Analysis
- 16.2.4.4. Recent Developments
- 16.2.4.5. Financials (Based on Availability)
- 16.2.5 Vyaire Medical Inc
- 16.2.5.1. Overview
- 16.2.5.2. Products
- 16.2.5.3. SWOT Analysis
- 16.2.5.4. Recent Developments
- 16.2.5.5. Financials (Based on Availability)
- 16.2.6 Resmed
- 16.2.6.1. Overview
- 16.2.6.2. Products
- 16.2.6.3. SWOT Analysis
- 16.2.6.4. Recent Developments
- 16.2.6.5. Financials (Based on Availability)
- 16.2.7 Oventus Medical
- 16.2.7.1. Overview
- 16.2.7.2. Products
- 16.2.7.3. SWOT Analysis
- 16.2.7.4. Recent Developments
- 16.2.7.5. Financials (Based on Availability)
- 16.2.8 Fisher & Paykel Healthcare Limited
- 16.2.8.1. Overview
- 16.2.8.2. Products
- 16.2.8.3. SWOT Analysis
- 16.2.8.4. Recent Developments
- 16.2.8.5. Financials (Based on Availability)
- 16.2.9 Koninklijke Philips NV
- 16.2.9.1. Overview
- 16.2.9.2. Products
- 16.2.9.3. SWOT Analysis
- 16.2.9.4. Recent Developments
- 16.2.9.5. Financials (Based on Availability)
- 16.2.10 Somnomed
- 16.2.10.1. Overview
- 16.2.10.2. Products
- 16.2.10.3. SWOT Analysis
- 16.2.10.4. Recent Developments
- 16.2.10.5. Financials (Based on Availability)
- 16.2.11 Teleflex Incorporated
- 16.2.11.1. Overview
- 16.2.11.2. Products
- 16.2.11.3. SWOT Analysis
- 16.2.11.4. Recent Developments
- 16.2.11.5. Financials (Based on Availability)
- 16.2.12 Nihon Kohden Corporation
- 16.2.12.1. Overview
- 16.2.12.2. Products
- 16.2.12.3. SWOT Analysis
- 16.2.12.4. Recent Developments
- 16.2.12.5. Financials (Based on Availability)
- 16.2.1 Natus Medical Incorporated
List of Figures
- Figure 1: Global Sleep Apnea Devices Industry Revenue Breakdown (Million, %) by Region 2024 & 2032
- Figure 2: Global Sleep Apnea Devices Industry Volume Breakdown (K Unit, %) by Region 2024 & 2032
- Figure 3: North America Sleep Apnea Devices Industry Revenue (Million), by Country 2024 & 2032
- Figure 4: North America Sleep Apnea Devices Industry Volume (K Unit), by Country 2024 & 2032
- Figure 5: North America Sleep Apnea Devices Industry Revenue Share (%), by Country 2024 & 2032
- Figure 6: North America Sleep Apnea Devices Industry Volume Share (%), by Country 2024 & 2032
- Figure 7: Europe Sleep Apnea Devices Industry Revenue (Million), by Country 2024 & 2032
- Figure 8: Europe Sleep Apnea Devices Industry Volume (K Unit), by Country 2024 & 2032
- Figure 9: Europe Sleep Apnea Devices Industry Revenue Share (%), by Country 2024 & 2032
- Figure 10: Europe Sleep Apnea Devices Industry Volume Share (%), by Country 2024 & 2032
- Figure 11: Asia Pacific Sleep Apnea Devices Industry Revenue (Million), by Country 2024 & 2032
- Figure 12: Asia Pacific Sleep Apnea Devices Industry Volume (K Unit), by Country 2024 & 2032
- Figure 13: Asia Pacific Sleep Apnea Devices Industry Revenue Share (%), by Country 2024 & 2032
- Figure 14: Asia Pacific Sleep Apnea Devices Industry Volume Share (%), by Country 2024 & 2032
- Figure 15: Middle East and Africa Sleep Apnea Devices Industry Revenue (Million), by Country 2024 & 2032
- Figure 16: Middle East and Africa Sleep Apnea Devices Industry Volume (K Unit), by Country 2024 & 2032
- Figure 17: Middle East and Africa Sleep Apnea Devices Industry Revenue Share (%), by Country 2024 & 2032
- Figure 18: Middle East and Africa Sleep Apnea Devices Industry Volume Share (%), by Country 2024 & 2032
- Figure 19: South America Sleep Apnea Devices Industry Revenue (Million), by Country 2024 & 2032
- Figure 20: South America Sleep Apnea Devices Industry Volume (K Unit), by Country 2024 & 2032
- Figure 21: South America Sleep Apnea Devices Industry Revenue Share (%), by Country 2024 & 2032
- Figure 22: South America Sleep Apnea Devices Industry Volume Share (%), by Country 2024 & 2032
- Figure 23: North America Sleep Apnea Devices Industry Revenue (Million), by Diagnostic Devices 2024 & 2032
- Figure 24: North America Sleep Apnea Devices Industry Volume (K Unit), by Diagnostic Devices 2024 & 2032
- Figure 25: North America Sleep Apnea Devices Industry Revenue Share (%), by Diagnostic Devices 2024 & 2032
- Figure 26: North America Sleep Apnea Devices Industry Volume Share (%), by Diagnostic Devices 2024 & 2032
- Figure 27: North America Sleep Apnea Devices Industry Revenue (Million), by Therapeutic Devices 2024 & 2032
- Figure 28: North America Sleep Apnea Devices Industry Volume (K Unit), by Therapeutic Devices 2024 & 2032
- Figure 29: North America Sleep Apnea Devices Industry Revenue Share (%), by Therapeutic Devices 2024 & 2032
- Figure 30: North America Sleep Apnea Devices Industry Volume Share (%), by Therapeutic Devices 2024 & 2032
- Figure 31: North America Sleep Apnea Devices Industry Revenue (Million), by Country 2024 & 2032
- Figure 32: North America Sleep Apnea Devices Industry Volume (K Unit), by Country 2024 & 2032
- Figure 33: North America Sleep Apnea Devices Industry Revenue Share (%), by Country 2024 & 2032
- Figure 34: North America Sleep Apnea Devices Industry Volume Share (%), by Country 2024 & 2032
- Figure 35: Europe Sleep Apnea Devices Industry Revenue (Million), by Diagnostic Devices 2024 & 2032
- Figure 36: Europe Sleep Apnea Devices Industry Volume (K Unit), by Diagnostic Devices 2024 & 2032
- Figure 37: Europe Sleep Apnea Devices Industry Revenue Share (%), by Diagnostic Devices 2024 & 2032
- Figure 38: Europe Sleep Apnea Devices Industry Volume Share (%), by Diagnostic Devices 2024 & 2032
- Figure 39: Europe Sleep Apnea Devices Industry Revenue (Million), by Therapeutic Devices 2024 & 2032
- Figure 40: Europe Sleep Apnea Devices Industry Volume (K Unit), by Therapeutic Devices 2024 & 2032
- Figure 41: Europe Sleep Apnea Devices Industry Revenue Share (%), by Therapeutic Devices 2024 & 2032
- Figure 42: Europe Sleep Apnea Devices Industry Volume Share (%), by Therapeutic Devices 2024 & 2032
- Figure 43: Europe Sleep Apnea Devices Industry Revenue (Million), by Country 2024 & 2032
- Figure 44: Europe Sleep Apnea Devices Industry Volume (K Unit), by Country 2024 & 2032
- Figure 45: Europe Sleep Apnea Devices Industry Revenue Share (%), by Country 2024 & 2032
- Figure 46: Europe Sleep Apnea Devices Industry Volume Share (%), by Country 2024 & 2032
- Figure 47: Asia Pacific Sleep Apnea Devices Industry Revenue (Million), by Diagnostic Devices 2024 & 2032
- Figure 48: Asia Pacific Sleep Apnea Devices Industry Volume (K Unit), by Diagnostic Devices 2024 & 2032
- Figure 49: Asia Pacific Sleep Apnea Devices Industry Revenue Share (%), by Diagnostic Devices 2024 & 2032
- Figure 50: Asia Pacific Sleep Apnea Devices Industry Volume Share (%), by Diagnostic Devices 2024 & 2032
- Figure 51: Asia Pacific Sleep Apnea Devices Industry Revenue (Million), by Therapeutic Devices 2024 & 2032
- Figure 52: Asia Pacific Sleep Apnea Devices Industry Volume (K Unit), by Therapeutic Devices 2024 & 2032
- Figure 53: Asia Pacific Sleep Apnea Devices Industry Revenue Share (%), by Therapeutic Devices 2024 & 2032
- Figure 54: Asia Pacific Sleep Apnea Devices Industry Volume Share (%), by Therapeutic Devices 2024 & 2032
- Figure 55: Asia Pacific Sleep Apnea Devices Industry Revenue (Million), by Country 2024 & 2032
- Figure 56: Asia Pacific Sleep Apnea Devices Industry Volume (K Unit), by Country 2024 & 2032
- Figure 57: Asia Pacific Sleep Apnea Devices Industry Revenue Share (%), by Country 2024 & 2032
- Figure 58: Asia Pacific Sleep Apnea Devices Industry Volume Share (%), by Country 2024 & 2032
- Figure 59: Middle East and Africa Sleep Apnea Devices Industry Revenue (Million), by Diagnostic Devices 2024 & 2032
- Figure 60: Middle East and Africa Sleep Apnea Devices Industry Volume (K Unit), by Diagnostic Devices 2024 & 2032
- Figure 61: Middle East and Africa Sleep Apnea Devices Industry Revenue Share (%), by Diagnostic Devices 2024 & 2032
- Figure 62: Middle East and Africa Sleep Apnea Devices Industry Volume Share (%), by Diagnostic Devices 2024 & 2032
- Figure 63: Middle East and Africa Sleep Apnea Devices Industry Revenue (Million), by Therapeutic Devices 2024 & 2032
- Figure 64: Middle East and Africa Sleep Apnea Devices Industry Volume (K Unit), by Therapeutic Devices 2024 & 2032
- Figure 65: Middle East and Africa Sleep Apnea Devices Industry Revenue Share (%), by Therapeutic Devices 2024 & 2032
- Figure 66: Middle East and Africa Sleep Apnea Devices Industry Volume Share (%), by Therapeutic Devices 2024 & 2032
- Figure 67: Middle East and Africa Sleep Apnea Devices Industry Revenue (Million), by Country 2024 & 2032
- Figure 68: Middle East and Africa Sleep Apnea Devices Industry Volume (K Unit), by Country 2024 & 2032
- Figure 69: Middle East and Africa Sleep Apnea Devices Industry Revenue Share (%), by Country 2024 & 2032
- Figure 70: Middle East and Africa Sleep Apnea Devices Industry Volume Share (%), by Country 2024 & 2032
- Figure 71: South America Sleep Apnea Devices Industry Revenue (Million), by Diagnostic Devices 2024 & 2032
- Figure 72: South America Sleep Apnea Devices Industry Volume (K Unit), by Diagnostic Devices 2024 & 2032
- Figure 73: South America Sleep Apnea Devices Industry Revenue Share (%), by Diagnostic Devices 2024 & 2032
- Figure 74: South America Sleep Apnea Devices Industry Volume Share (%), by Diagnostic Devices 2024 & 2032
- Figure 75: South America Sleep Apnea Devices Industry Revenue (Million), by Therapeutic Devices 2024 & 2032
- Figure 76: South America Sleep Apnea Devices Industry Volume (K Unit), by Therapeutic Devices 2024 & 2032
- Figure 77: South America Sleep Apnea Devices Industry Revenue Share (%), by Therapeutic Devices 2024 & 2032
- Figure 78: South America Sleep Apnea Devices Industry Volume Share (%), by Therapeutic Devices 2024 & 2032
- Figure 79: South America Sleep Apnea Devices Industry Revenue (Million), by Country 2024 & 2032
- Figure 80: South America Sleep Apnea Devices Industry Volume (K Unit), by Country 2024 & 2032
- Figure 81: South America Sleep Apnea Devices Industry Revenue Share (%), by Country 2024 & 2032
- Figure 82: South America Sleep Apnea Devices Industry Volume Share (%), by Country 2024 & 2032
List of Tables
- Table 1: Global Sleep Apnea Devices Industry Revenue Million Forecast, by Region 2019 & 2032
- Table 2: Global Sleep Apnea Devices Industry Volume K Unit Forecast, by Region 2019 & 2032
- Table 3: Global Sleep Apnea Devices Industry Revenue Million Forecast, by Diagnostic Devices 2019 & 2032
- Table 4: Global Sleep Apnea Devices Industry Volume K Unit Forecast, by Diagnostic Devices 2019 & 2032
- Table 5: Global Sleep Apnea Devices Industry Revenue Million Forecast, by Therapeutic Devices 2019 & 2032
- Table 6: Global Sleep Apnea Devices Industry Volume K Unit Forecast, by Therapeutic Devices 2019 & 2032
- Table 7: Global Sleep Apnea Devices Industry Revenue Million Forecast, by Region 2019 & 2032
- Table 8: Global Sleep Apnea Devices Industry Volume K Unit Forecast, by Region 2019 & 2032
- Table 9: Global Sleep Apnea Devices Industry Revenue Million Forecast, by Country 2019 & 2032
- Table 10: Global Sleep Apnea Devices Industry Volume K Unit Forecast, by Country 2019 & 2032
- Table 11: United States Sleep Apnea Devices Industry Revenue (Million) Forecast, by Application 2019 & 2032
- Table 12: United States Sleep Apnea Devices Industry Volume (K Unit) Forecast, by Application 2019 & 2032
- Table 13: Canada Sleep Apnea Devices Industry Revenue (Million) Forecast, by Application 2019 & 2032
- Table 14: Canada Sleep Apnea Devices Industry Volume (K Unit) Forecast, by Application 2019 & 2032
- Table 15: Mexico Sleep Apnea Devices Industry Revenue (Million) Forecast, by Application 2019 & 2032
- Table 16: Mexico Sleep Apnea Devices Industry Volume (K Unit) Forecast, by Application 2019 & 2032
- Table 17: Global Sleep Apnea Devices Industry Revenue Million Forecast, by Country 2019 & 2032
- Table 18: Global Sleep Apnea Devices Industry Volume K Unit Forecast, by Country 2019 & 2032
- Table 19: Germany Sleep Apnea Devices Industry Revenue (Million) Forecast, by Application 2019 & 2032
- Table 20: Germany Sleep Apnea Devices Industry Volume (K Unit) Forecast, by Application 2019 & 2032
- Table 21: United Kingdom Sleep Apnea Devices Industry Revenue (Million) Forecast, by Application 2019 & 2032
- Table 22: United Kingdom Sleep Apnea Devices Industry Volume (K Unit) Forecast, by Application 2019 & 2032
- Table 23: France Sleep Apnea Devices Industry Revenue (Million) Forecast, by Application 2019 & 2032
- Table 24: France Sleep Apnea Devices Industry Volume (K Unit) Forecast, by Application 2019 & 2032
- Table 25: Italy Sleep Apnea Devices Industry Revenue (Million) Forecast, by Application 2019 & 2032
- Table 26: Italy Sleep Apnea Devices Industry Volume (K Unit) Forecast, by Application 2019 & 2032
- Table 27: Spain Sleep Apnea Devices Industry Revenue (Million) Forecast, by Application 2019 & 2032
- Table 28: Spain Sleep Apnea Devices Industry Volume (K Unit) Forecast, by Application 2019 & 2032
- Table 29: Rest of Europe Sleep Apnea Devices Industry Revenue (Million) Forecast, by Application 2019 & 2032
- Table 30: Rest of Europe Sleep Apnea Devices Industry Volume (K Unit) Forecast, by Application 2019 & 2032
- Table 31: Global Sleep Apnea Devices Industry Revenue Million Forecast, by Country 2019 & 2032
- Table 32: Global Sleep Apnea Devices Industry Volume K Unit Forecast, by Country 2019 & 2032
- Table 33: China Sleep Apnea Devices Industry Revenue (Million) Forecast, by Application 2019 & 2032
- Table 34: China Sleep Apnea Devices Industry Volume (K Unit) Forecast, by Application 2019 & 2032
- Table 35: Japan Sleep Apnea Devices Industry Revenue (Million) Forecast, by Application 2019 & 2032
- Table 36: Japan Sleep Apnea Devices Industry Volume (K Unit) Forecast, by Application 2019 & 2032
- Table 37: India Sleep Apnea Devices Industry Revenue (Million) Forecast, by Application 2019 & 2032
- Table 38: India Sleep Apnea Devices Industry Volume (K Unit) Forecast, by Application 2019 & 2032
- Table 39: Australia Sleep Apnea Devices Industry Revenue (Million) Forecast, by Application 2019 & 2032
- Table 40: Australia Sleep Apnea Devices Industry Volume (K Unit) Forecast, by Application 2019 & 2032
- Table 41: South Korea Sleep Apnea Devices Industry Revenue (Million) Forecast, by Application 2019 & 2032
- Table 42: South Korea Sleep Apnea Devices Industry Volume (K Unit) Forecast, by Application 2019 & 2032
- Table 43: Rest of Asia Pacific Sleep Apnea Devices Industry Revenue (Million) Forecast, by Application 2019 & 2032
- Table 44: Rest of Asia Pacific Sleep Apnea Devices Industry Volume (K Unit) Forecast, by Application 2019 & 2032
- Table 45: Global Sleep Apnea Devices Industry Revenue Million Forecast, by Country 2019 & 2032
- Table 46: Global Sleep Apnea Devices Industry Volume K Unit Forecast, by Country 2019 & 2032
- Table 47: GCC Sleep Apnea Devices Industry Revenue (Million) Forecast, by Application 2019 & 2032
- Table 48: GCC Sleep Apnea Devices Industry Volume (K Unit) Forecast, by Application 2019 & 2032
- Table 49: South Africa Sleep Apnea Devices Industry Revenue (Million) Forecast, by Application 2019 & 2032
- Table 50: South Africa Sleep Apnea Devices Industry Volume (K Unit) Forecast, by Application 2019 & 2032
- Table 51: Rest of Middle East and Africa Sleep Apnea Devices Industry Revenue (Million) Forecast, by Application 2019 & 2032
- Table 52: Rest of Middle East and Africa Sleep Apnea Devices Industry Volume (K Unit) Forecast, by Application 2019 & 2032
- Table 53: Global Sleep Apnea Devices Industry Revenue Million Forecast, by Country 2019 & 2032
- Table 54: Global Sleep Apnea Devices Industry Volume K Unit Forecast, by Country 2019 & 2032
- Table 55: Brazil Sleep Apnea Devices Industry Revenue (Million) Forecast, by Application 2019 & 2032
- Table 56: Brazil Sleep Apnea Devices Industry Volume (K Unit) Forecast, by Application 2019 & 2032
- Table 57: Argentina Sleep Apnea Devices Industry Revenue (Million) Forecast, by Application 2019 & 2032
- Table 58: Argentina Sleep Apnea Devices Industry Volume (K Unit) Forecast, by Application 2019 & 2032
- Table 59: Rest of South America Sleep Apnea Devices Industry Revenue (Million) Forecast, by Application 2019 & 2032
- Table 60: Rest of South America Sleep Apnea Devices Industry Volume (K Unit) Forecast, by Application 2019 & 2032
- Table 61: Global Sleep Apnea Devices Industry Revenue Million Forecast, by Diagnostic Devices 2019 & 2032
- Table 62: Global Sleep Apnea Devices Industry Volume K Unit Forecast, by Diagnostic Devices 2019 & 2032
- Table 63: Global Sleep Apnea Devices Industry Revenue Million Forecast, by Therapeutic Devices 2019 & 2032
- Table 64: Global Sleep Apnea Devices Industry Volume K Unit Forecast, by Therapeutic Devices 2019 & 2032
- Table 65: Global Sleep Apnea Devices Industry Revenue Million Forecast, by Country 2019 & 2032
- Table 66: Global Sleep Apnea Devices Industry Volume K Unit Forecast, by Country 2019 & 2032
- Table 67: United States Sleep Apnea Devices Industry Revenue (Million) Forecast, by Application 2019 & 2032
- Table 68: United States Sleep Apnea Devices Industry Volume (K Unit) Forecast, by Application 2019 & 2032
- Table 69: Canada Sleep Apnea Devices Industry Revenue (Million) Forecast, by Application 2019 & 2032
- Table 70: Canada Sleep Apnea Devices Industry Volume (K Unit) Forecast, by Application 2019 & 2032
- Table 71: Mexico Sleep Apnea Devices Industry Revenue (Million) Forecast, by Application 2019 & 2032
- Table 72: Mexico Sleep Apnea Devices Industry Volume (K Unit) Forecast, by Application 2019 & 2032
- Table 73: Global Sleep Apnea Devices Industry Revenue Million Forecast, by Diagnostic Devices 2019 & 2032
- Table 74: Global Sleep Apnea Devices Industry Volume K Unit Forecast, by Diagnostic Devices 2019 & 2032
- Table 75: Global Sleep Apnea Devices Industry Revenue Million Forecast, by Therapeutic Devices 2019 & 2032
- Table 76: Global Sleep Apnea Devices Industry Volume K Unit Forecast, by Therapeutic Devices 2019 & 2032
- Table 77: Global Sleep Apnea Devices Industry Revenue Million Forecast, by Country 2019 & 2032
- Table 78: Global Sleep Apnea Devices Industry Volume K Unit Forecast, by Country 2019 & 2032
- Table 79: Germany Sleep Apnea Devices Industry Revenue (Million) Forecast, by Application 2019 & 2032
- Table 80: Germany Sleep Apnea Devices Industry Volume (K Unit) Forecast, by Application 2019 & 2032
- Table 81: United Kingdom Sleep Apnea Devices Industry Revenue (Million) Forecast, by Application 2019 & 2032
- Table 82: United Kingdom Sleep Apnea Devices Industry Volume (K Unit) Forecast, by Application 2019 & 2032
- Table 83: France Sleep Apnea Devices Industry Revenue (Million) Forecast, by Application 2019 & 2032
- Table 84: France Sleep Apnea Devices Industry Volume (K Unit) Forecast, by Application 2019 & 2032
- Table 85: Italy Sleep Apnea Devices Industry Revenue (Million) Forecast, by Application 2019 & 2032
- Table 86: Italy Sleep Apnea Devices Industry Volume (K Unit) Forecast, by Application 2019 & 2032
- Table 87: Spain Sleep Apnea Devices Industry Revenue (Million) Forecast, by Application 2019 & 2032
- Table 88: Spain Sleep Apnea Devices Industry Volume (K Unit) Forecast, by Application 2019 & 2032
- Table 89: Rest of Europe Sleep Apnea Devices Industry Revenue (Million) Forecast, by Application 2019 & 2032
- Table 90: Rest of Europe Sleep Apnea Devices Industry Volume (K Unit) Forecast, by Application 2019 & 2032
- Table 91: Global Sleep Apnea Devices Industry Revenue Million Forecast, by Diagnostic Devices 2019 & 2032
- Table 92: Global Sleep Apnea Devices Industry Volume K Unit Forecast, by Diagnostic Devices 2019 & 2032
- Table 93: Global Sleep Apnea Devices Industry Revenue Million Forecast, by Therapeutic Devices 2019 & 2032
- Table 94: Global Sleep Apnea Devices Industry Volume K Unit Forecast, by Therapeutic Devices 2019 & 2032
- Table 95: Global Sleep Apnea Devices Industry Revenue Million Forecast, by Country 2019 & 2032
- Table 96: Global Sleep Apnea Devices Industry Volume K Unit Forecast, by Country 2019 & 2032
- Table 97: China Sleep Apnea Devices Industry Revenue (Million) Forecast, by Application 2019 & 2032
- Table 98: China Sleep Apnea Devices Industry Volume (K Unit) Forecast, by Application 2019 & 2032
- Table 99: Japan Sleep Apnea Devices Industry Revenue (Million) Forecast, by Application 2019 & 2032
- Table 100: Japan Sleep Apnea Devices Industry Volume (K Unit) Forecast, by Application 2019 & 2032
- Table 101: India Sleep Apnea Devices Industry Revenue (Million) Forecast, by Application 2019 & 2032
- Table 102: India Sleep Apnea Devices Industry Volume (K Unit) Forecast, by Application 2019 & 2032
- Table 103: Australia Sleep Apnea Devices Industry Revenue (Million) Forecast, by Application 2019 & 2032
- Table 104: Australia Sleep Apnea Devices Industry Volume (K Unit) Forecast, by Application 2019 & 2032
- Table 105: South Korea Sleep Apnea Devices Industry Revenue (Million) Forecast, by Application 2019 & 2032
- Table 106: South Korea Sleep Apnea Devices Industry Volume (K Unit) Forecast, by Application 2019 & 2032
- Table 107: Rest of Asia Pacific Sleep Apnea Devices Industry Revenue (Million) Forecast, by Application 2019 & 2032
- Table 108: Rest of Asia Pacific Sleep Apnea Devices Industry Volume (K Unit) Forecast, by Application 2019 & 2032
- Table 109: Global Sleep Apnea Devices Industry Revenue Million Forecast, by Diagnostic Devices 2019 & 2032
- Table 110: Global Sleep Apnea Devices Industry Volume K Unit Forecast, by Diagnostic Devices 2019 & 2032
- Table 111: Global Sleep Apnea Devices Industry Revenue Million Forecast, by Therapeutic Devices 2019 & 2032
- Table 112: Global Sleep Apnea Devices Industry Volume K Unit Forecast, by Therapeutic Devices 2019 & 2032
- Table 113: Global Sleep Apnea Devices Industry Revenue Million Forecast, by Country 2019 & 2032
- Table 114: Global Sleep Apnea Devices Industry Volume K Unit Forecast, by Country 2019 & 2032
- Table 115: GCC Sleep Apnea Devices Industry Revenue (Million) Forecast, by Application 2019 & 2032
- Table 116: GCC Sleep Apnea Devices Industry Volume (K Unit) Forecast, by Application 2019 & 2032
- Table 117: South Africa Sleep Apnea Devices Industry Revenue (Million) Forecast, by Application 2019 & 2032
- Table 118: South Africa Sleep Apnea Devices Industry Volume (K Unit) Forecast, by Application 2019 & 2032
- Table 119: Rest of Middle East and Africa Sleep Apnea Devices Industry Revenue (Million) Forecast, by Application 2019 & 2032
- Table 120: Rest of Middle East and Africa Sleep Apnea Devices Industry Volume (K Unit) Forecast, by Application 2019 & 2032
- Table 121: Global Sleep Apnea Devices Industry Revenue Million Forecast, by Diagnostic Devices 2019 & 2032
- Table 122: Global Sleep Apnea Devices Industry Volume K Unit Forecast, by Diagnostic Devices 2019 & 2032
- Table 123: Global Sleep Apnea Devices Industry Revenue Million Forecast, by Therapeutic Devices 2019 & 2032
- Table 124: Global Sleep Apnea Devices Industry Volume K Unit Forecast, by Therapeutic Devices 2019 & 2032
- Table 125: Global Sleep Apnea Devices Industry Revenue Million Forecast, by Country 2019 & 2032
- Table 126: Global Sleep Apnea Devices Industry Volume K Unit Forecast, by Country 2019 & 2032
- Table 127: Brazil Sleep Apnea Devices Industry Revenue (Million) Forecast, by Application 2019 & 2032
- Table 128: Brazil Sleep Apnea Devices Industry Volume (K Unit) Forecast, by Application 2019 & 2032
- Table 129: Argentina Sleep Apnea Devices Industry Revenue (Million) Forecast, by Application 2019 & 2032
- Table 130: Argentina Sleep Apnea Devices Industry Volume (K Unit) Forecast, by Application 2019 & 2032
- Table 131: Rest of South America Sleep Apnea Devices Industry Revenue (Million) Forecast, by Application 2019 & 2032
- Table 132: Rest of South America Sleep Apnea Devices Industry Volume (K Unit) Forecast, by Application 2019 & 2032
Frequently Asked Questions
1. What is the projected Compound Annual Growth Rate (CAGR) of the Sleep Apnea Devices Industry?
The projected CAGR is approximately 7.33%.
2. Which companies are prominent players in the Sleep Apnea Devices Industry?
Key companies in the market include Natus Medical Incorporated, Invacare Corporation, Cadwell Laboratories Inc, GE Healthcare, Vyaire Medical Inc, Resmed, Oventus Medical, Fisher & Paykel Healthcare Limited, Koninklijke Philips NV, Somnomed, Teleflex Incorporated, Nihon Kohden Corporation.
3. What are the main segments of the Sleep Apnea Devices Industry?
The market segments include Diagnostic Devices, Therapeutic Devices.
4. Can you provide details about the market size?
The market size is estimated to be USD 8.20 Million as of 2022.
5. What are some drivers contributing to market growth?
Increasing Awareness Among the Patient Population in the Developing Countries; Increase in Prevalence of Obesity and Hypertension; Upcoming Technological Advancements.
6. What are the notable trends driving market growth?
Pulse Oximeters are Expected to Register the Highest CAGR in the Diagnostic Devices Category.
7. Are there any restraints impacting market growth?
High Cost of Cpap Machines.
8. Can you provide examples of recent developments in the market?
In November 2022, ResMed and Alphabet's life science offshoot Verily announced the formation of Primasun, an end-to-end solution to help employers and healthcare providers identify populations at risk for complex sleep disorders.
9. What pricing options are available for accessing the report?
Pricing options include single-user, multi-user, and enterprise licenses priced at USD 4750, USD 5250, and USD 8750 respectively.
10. Is the market size provided in terms of value or volume?
The market size is provided in terms of value, measured in Million and volume, measured in K Unit.
11. Are there any specific market keywords associated with the report?
Yes, the market keyword associated with the report is "Sleep Apnea Devices Industry," which aids in identifying and referencing the specific market segment covered.
12. How do I determine which pricing option suits my needs best?
The pricing options vary based on user requirements and access needs. Individual users may opt for single-user licenses, while businesses requiring broader access may choose multi-user or enterprise licenses for cost-effective access to the report.
13. Are there any additional resources or data provided in the Sleep Apnea Devices Industry report?
While the report offers comprehensive insights, it's advisable to review the specific contents or supplementary materials provided to ascertain if additional resources or data are available.
14. How can I stay updated on further developments or reports in the Sleep Apnea Devices Industry?
To stay informed about further developments, trends, and reports in the Sleep Apnea Devices Industry, consider subscribing to industry newsletters, following relevant companies and organizations, or regularly checking reputable industry news sources and publications.
Methodology
Step 1 - Identification of Relevant Samples Size from Population Database


Step 2 - Approaches for Defining Global Market Size (Value, Volume* & Price*)

Note*: In applicable scenarios
Step 3 - Data Sources
Primary Research
- Web Analytics
- Survey Reports
- Research Institute
- Latest Research Reports
- Opinion Leaders
Secondary Research
- Annual Reports
- White Paper
- Latest Press Release
- Industry Association
- Paid Database
- Investor Presentations

Step 4 - Data Triangulation
Involves using different sources of information in order to increase the validity of a study
These sources are likely to be stakeholders in a program - participants, other researchers, program staff, other community members, and so on.
Then we put all data in single framework & apply various statistical tools to find out the dynamic on the market.
During the analysis stage, feedback from the stakeholder groups would be compared to determine areas of agreement as well as areas of divergence


