
Key Insights
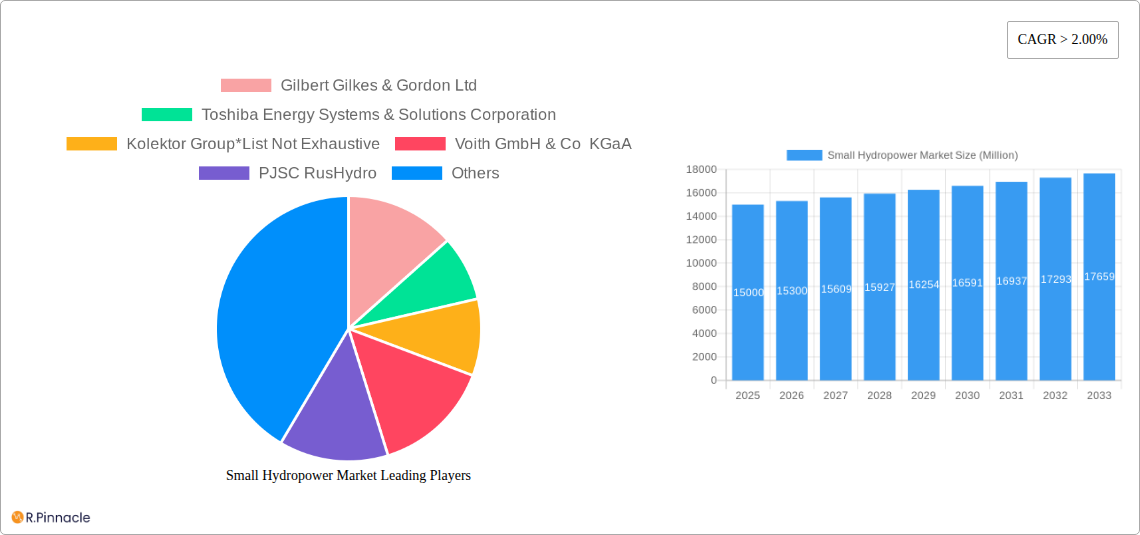
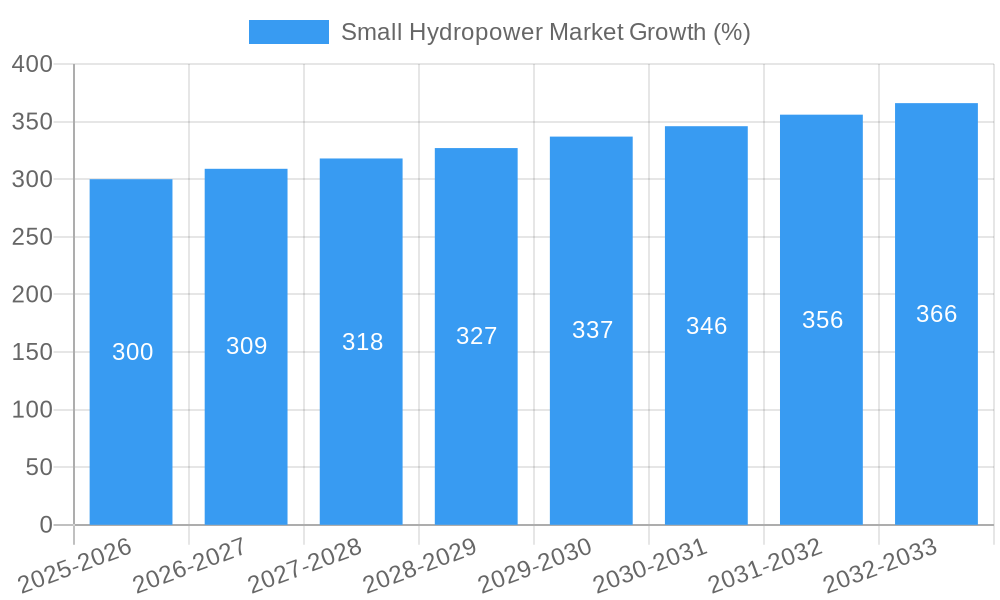
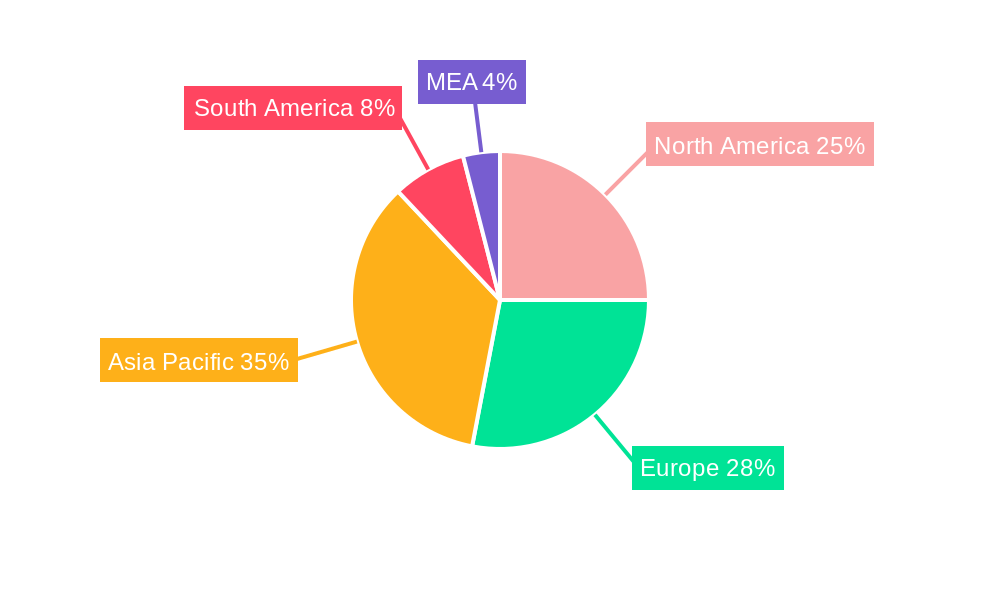
The global small hydropower market, encompassing projects with capacities up to 10 MW, is experiencing robust growth, driven by increasing demand for renewable energy sources and the need for decentralized power generation. The market's Compound Annual Growth Rate (CAGR) exceeding 2% indicates a steady expansion, projected to continue through 2033. Key drivers include government incentives promoting sustainable energy, rising electricity prices, and the relative ease of implementing small hydropower projects compared to larger-scale alternatives. Furthermore, technological advancements leading to improved efficiency and reduced environmental impact are contributing to market expansion. The market is segmented by capacity (up to 1 MW, 1-10 MW) and application (power infrastructure, civil works, other applications), with power infrastructure currently dominating. Geographically, North America, Europe, and Asia-Pacific are leading regions, fueled by strong government support and substantial renewable energy targets. However, challenges such as high initial investment costs, environmental concerns related to dam construction in sensitive ecosystems, and regulatory hurdles in some regions are acting as restraints. Leading companies like Gilbert Gilkes & Gordon Ltd, Toshiba Energy Systems & Solutions, and Siemens Energy AG are actively shaping market dynamics through technological innovation and project development. The forecast period (2025-2033) anticipates continued growth, driven by ongoing policy support and increasing private sector investment in sustainable energy solutions.
The market is expected to see a shift towards higher capacity projects (1-10 MW) due to economies of scale and improved grid integration capabilities. Technological innovations, such as the development of more efficient turbines and improved grid integration technologies, will further accelerate growth. The Asia-Pacific region is poised for significant expansion, driven by increasing energy demand and government initiatives promoting renewable energy sources in developing nations. However, market penetration in regions with underdeveloped power infrastructure might be slower due to logistical and financial limitations. A focus on sustainable development practices and mitigation of environmental impacts will become increasingly crucial for market players to ensure long-term success and public acceptance. The market will continue to evolve with a growing emphasis on hybrid systems integrating small hydropower with other renewable energy sources, further enhancing the sustainability and reliability of power generation.
Small Hydropower Market Report: 2019-2033
This comprehensive report provides an in-depth analysis of the Small Hydropower Market, offering invaluable insights for industry professionals, investors, and strategists. Covering the period from 2019 to 2033, with a focus on 2025, this report meticulously examines market dynamics, technological advancements, and key players shaping this crucial renewable energy sector. Expect detailed segmentation analysis, growth projections, and a thorough exploration of the challenges and opportunities within the Small Hydropower Market. The report's data-driven approach provides actionable intelligence for informed decision-making.
Small Hydropower Market Structure & Innovation Trends
The Small Hydropower Market exhibits a moderately fragmented structure, with several key players competing for market share. Market concentration is influenced by factors such as geographical location, project size, and technological expertise. Innovation is driven by the need for increased efficiency, reduced environmental impact, and improved grid integration. Stringent regulatory frameworks vary across regions, impacting market entry and expansion strategies. Technological advancements, such as improved turbine designs and digital monitoring systems, are driving market innovation. Product substitutes, primarily from other renewable energy sources, present competitive challenges. End-user demographics encompass power infrastructure developers, civil works contractors, and other industrial applications. Mergers and Acquisitions (M&A) activity has been moderate, with deal values varying depending on the size and scope of the assets involved.
- Market Share: The top five players hold approximately xx% of the global market share in 2025.
- M&A Activity: In the period 2019-2024, an estimated xx Million USD worth of M&A deals were recorded in the small hydropower sector. The average deal size was approximately xx Million USD.
Small Hydropower Market Dynamics & Trends
The Small Hydropower Market is experiencing robust growth, driven by increasing global demand for renewable energy, supportive government policies, and decreasing technology costs. Technological advancements are leading to the development of more efficient and cost-effective hydropower systems. Consumer preferences are shifting towards sustainable energy solutions, fueling the demand for small hydropower projects. The competitive landscape is characterized by a mix of established players and emerging technology providers.
- CAGR: The market is projected to register a CAGR of xx% during the forecast period (2025-2033).
- Market Penetration: The penetration rate of small hydropower in the overall renewable energy mix is expected to increase from xx% in 2025 to xx% by 2033.
Dominant Regions & Segments in Small Hydropower Market
The Asia-Pacific region is currently the dominant market for small hydropower, driven by robust economic growth, expanding power infrastructure needs, and supportive government initiatives promoting renewable energy adoption. Within the capacity segments, the 1-10 MW segment holds the largest share, reflecting the feasibility and scalability of projects in this range. The Power Infrastructure segment dominates the application landscape due to the critical role of hydropower in enhancing energy security and stability.
Key Drivers for Asia-Pacific Dominance:
- Strong government support and favorable regulatory frameworks for renewable energy development.
- Rapid economic growth and increasing energy demand driving investment in power infrastructure.
- Abundant water resources and suitable geographical conditions for small hydropower projects.
Capacity Segment Analysis:
- Up to 1 MW: This segment is characterized by a large number of smaller projects, typically deployed in remote areas or for localized power generation.
- 1-10 MW: This segment is the most dominant, representing a balance between project size, investment cost, and power generation capacity.
Application Segment Analysis:
- Power Infrastructure: This is the largest segment due to the vital role small hydropower plays in providing electricity to communities and industrial centers.
- Civil Works: Small hydropower projects are increasingly integrated into civil works projects such as irrigation and water management systems.
- Other Applications: This segment includes niche applications like pumping water for irrigation or industrial processes.
Small Hydropower Market Product Innovations
Recent innovations in small hydropower technologies focus on enhancing efficiency, durability, and environmental compatibility. Advances in turbine design, digital control systems, and improved grid integration technologies are contributing to the competitiveness of small hydropower solutions. The market is witnessing the rise of modular and pre-fabricated hydropower systems, facilitating faster deployment and reduced construction costs. These innovations cater to the growing demand for flexible, efficient, and sustainable small-scale power generation solutions.
Report Scope & Segmentation Analysis
This report segments the Small Hydropower Market based on capacity (Up to 1 MW, 1-10 MW) and application (Power Infrastructure, Civil Works, Other Applications). Each segment's market size, growth projections, and competitive landscape are analyzed separately. The "Up to 1 MW" segment is characterized by numerous small-scale projects, whereas the "1-10 MW" segment represents larger, more impactful projects. The Power Infrastructure application segment dominates, driven by increasing electricity demand and grid modernization efforts.
Key Drivers of Small Hydropower Market Growth
The growth of the Small Hydropower Market is fueled by several factors, including increasing demand for renewable energy sources to mitigate climate change, supportive government policies and subsidies promoting renewable energy adoption, and technological advancements resulting in more efficient and cost-effective hydropower systems. Decreasing capital costs and improving access to financing also stimulate market expansion. Furthermore, the need for decentralized power generation in remote areas is driving demand for small hydropower projects.
Challenges in the Small Hydropower Market Sector
The Small Hydropower Market faces challenges such as high initial investment costs, complex permitting processes and regulatory hurdles in some regions, potential environmental impacts if not properly managed, and competition from other renewable energy sources. Supply chain disruptions can impact project timelines and budgets. Fluctuating energy prices and market volatility add further complexity. These factors can significantly affect project feasibility and profitability.
Emerging Opportunities in Small Hydropower Market
Emerging opportunities include the integration of small hydropower with other renewable energy sources (hybrid systems), the application of advanced technologies such as AI and machine learning for enhanced efficiency and predictive maintenance, and expanding into new markets with high hydropower potential. The development of standardized and modular designs can reduce costs and expedite project deployment. Increased focus on community-based hydropower projects opens new avenues for market growth.
Leading Players in the Small Hydropower Market Market
- Gilbert Gilkes & Gordon Ltd
- Toshiba Energy Systems & Solutions Corporation
- Kolektor Group
- Voith GmbH & Co KGaA
- PJSC RusHydro
- Siemens Energy AG
- Natel Energy Inc
- GE Renewable Energy
- Andritz AG
- FLOVEL Energy Private Limited
Key Developments in Small Hydropower Market Industry
- July 2022: SMEC, in consortium with Tellhow International Engineering & Contracting Co Ltd, secured a contract to review and modify the design of three small hydropower plants (totaling 29.1 MW) in East Malaysia. This signifies continued investment and development in the region.
- July 2022: The Development Bank of the Philippines approved USD 12.0 Million in funding for the 4.6 MW Dupinga Mini Hydropower project. This highlights the role of financial institutions in supporting renewable energy initiatives and achieving national renewable energy goals.
Future Outlook for Small Hydropower Market Market
The future of the Small Hydropower Market appears bright, driven by several growth accelerators including increasing government support for renewable energy, technological advancements leading to higher efficiency and lower costs, and growing awareness of the environmental benefits of hydropower. Strategic partnerships and investments in research and development are likely to further propel the sector's growth, solidifying its position as a significant contributor to the global renewable energy landscape.
Small Hydropower Market Segmentation
-
1. Capacity
- 1.1. Up to 1 MW
- 1.2. 1-10 MW
-
2. Application
- 2.1. Power Infrastructure
- 2.2. Civil Works
- 2.3. Other Applications
Small Hydropower Market Segmentation By Geography
-
1. North America
- 1.1. United States
- 1.2. Canada
- 1.3. Rest of North America
-
2. Europe
- 2.1. Germany
- 2.2. United Kingdom
- 2.3. France
- 2.4. Italy
- 2.5. Spain
- 2.6. Nordic
- 2.7. Turkey
- 2.8. Russia
- 2.9. Rest of Europe
-
3. Asia Pacific
- 3.1. China
- 3.2. India
- 3.3. Japan
- 3.4. South Korea
- 3.5. Malaysia
- 3.6. Thailand
- 3.7. Vietnam
- 3.8. Rest of Asia Pacific
-
4. Middle East and Africa
- 4.1. Saudi Arabia
- 4.2. United Arab Emirates
- 4.3. Nigeria
- 4.4. Egypt
- 4.5. South Africa
- 4.6. Rest of Middle East and Africa
-
5. South America
- 5.1. Brazil
- 5.2. Argentina
- 5.3. Colombia
- 5.4. Rest of South America
Small Hydropower Market REPORT HIGHLIGHTS
| Aspects | Details |
|---|---|
| Study Period | 2019-2033 |
| Base Year | 2024 |
| Estimated Year | 2025 |
| Forecast Period | 2025-2033 |
| Historical Period | 2019-2024 |
| Growth Rate | CAGR of > 2.00% from 2019-2033 |
| Segmentation |
|
Table of Contents
- 1. Introduction
- 1.1. Research Scope
- 1.2. Market Segmentation
- 1.3. Research Methodology
- 1.4. Definitions and Assumptions
- 2. Executive Summary
- 2.1. Introduction
- 3. Market Dynamics
- 3.1. Introduction
- 3.2. Market Drivers
- 3.2.1. 4.; Growing Emphasis on Renewable Energy Integration4.; Significant Hydropower Potential
- 3.3. Market Restrains
- 3.3.1. 4.; Competition From Other Energy Storage Technologies
- 3.4. Market Trends
- 3.4.1. The 1-10 MW Segment Expected to Dominate the Market
- 4. Market Factor Analysis
- 4.1. Porters Five Forces
- 4.2. Supply/Value Chain
- 4.3. PESTEL analysis
- 4.4. Market Entropy
- 4.5. Patent/Trademark Analysis
- 5. Global Small Hydropower Market Analysis, Insights and Forecast, 2019-2031
- 5.1. Market Analysis, Insights and Forecast - by Capacity
- 5.1.1. Up to 1 MW
- 5.1.2. 1-10 MW
- 5.2. Market Analysis, Insights and Forecast - by Application
- 5.2.1. Power Infrastructure
- 5.2.2. Civil Works
- 5.2.3. Other Applications
- 5.3. Market Analysis, Insights and Forecast - by Region
- 5.3.1. North America
- 5.3.2. Europe
- 5.3.3. Asia Pacific
- 5.3.4. Middle East and Africa
- 5.3.5. South America
- 5.1. Market Analysis, Insights and Forecast - by Capacity
- 6. North America Small Hydropower Market Analysis, Insights and Forecast, 2019-2031
- 6.1. Market Analysis, Insights and Forecast - by Capacity
- 6.1.1. Up to 1 MW
- 6.1.2. 1-10 MW
- 6.2. Market Analysis, Insights and Forecast - by Application
- 6.2.1. Power Infrastructure
- 6.2.2. Civil Works
- 6.2.3. Other Applications
- 6.1. Market Analysis, Insights and Forecast - by Capacity
- 7. Europe Small Hydropower Market Analysis, Insights and Forecast, 2019-2031
- 7.1. Market Analysis, Insights and Forecast - by Capacity
- 7.1.1. Up to 1 MW
- 7.1.2. 1-10 MW
- 7.2. Market Analysis, Insights and Forecast - by Application
- 7.2.1. Power Infrastructure
- 7.2.2. Civil Works
- 7.2.3. Other Applications
- 7.1. Market Analysis, Insights and Forecast - by Capacity
- 8. Asia Pacific Small Hydropower Market Analysis, Insights and Forecast, 2019-2031
- 8.1. Market Analysis, Insights and Forecast - by Capacity
- 8.1.1. Up to 1 MW
- 8.1.2. 1-10 MW
- 8.2. Market Analysis, Insights and Forecast - by Application
- 8.2.1. Power Infrastructure
- 8.2.2. Civil Works
- 8.2.3. Other Applications
- 8.1. Market Analysis, Insights and Forecast - by Capacity
- 9. Middle East and Africa Small Hydropower Market Analysis, Insights and Forecast, 2019-2031
- 9.1. Market Analysis, Insights and Forecast - by Capacity
- 9.1.1. Up to 1 MW
- 9.1.2. 1-10 MW
- 9.2. Market Analysis, Insights and Forecast - by Application
- 9.2.1. Power Infrastructure
- 9.2.2. Civil Works
- 9.2.3. Other Applications
- 9.1. Market Analysis, Insights and Forecast - by Capacity
- 10. South America Small Hydropower Market Analysis, Insights and Forecast, 2019-2031
- 10.1. Market Analysis, Insights and Forecast - by Capacity
- 10.1.1. Up to 1 MW
- 10.1.2. 1-10 MW
- 10.2. Market Analysis, Insights and Forecast - by Application
- 10.2.1. Power Infrastructure
- 10.2.2. Civil Works
- 10.2.3. Other Applications
- 10.1. Market Analysis, Insights and Forecast - by Capacity
- 11. North America Small Hydropower Market Analysis, Insights and Forecast, 2019-2031
- 11.1. Market Analysis, Insights and Forecast - By Country/Sub-region
- 11.1.1 United States
- 11.1.2 Canada
- 11.1.3 Mexico
- 12. Europe Small Hydropower Market Analysis, Insights and Forecast, 2019-2031
- 12.1. Market Analysis, Insights and Forecast - By Country/Sub-region
- 12.1.1 Germany
- 12.1.2 United Kingdom
- 12.1.3 France
- 12.1.4 Spain
- 12.1.5 Italy
- 12.1.6 Spain
- 12.1.7 Belgium
- 12.1.8 Netherland
- 12.1.9 Nordics
- 12.1.10 Rest of Europe
- 13. Asia Pacific Small Hydropower Market Analysis, Insights and Forecast, 2019-2031
- 13.1. Market Analysis, Insights and Forecast - By Country/Sub-region
- 13.1.1 China
- 13.1.2 Japan
- 13.1.3 India
- 13.1.4 South Korea
- 13.1.5 Southeast Asia
- 13.1.6 Australia
- 13.1.7 Indonesia
- 13.1.8 Phillipes
- 13.1.9 Singapore
- 13.1.10 Thailandc
- 13.1.11 Rest of Asia Pacific
- 14. South America Small Hydropower Market Analysis, Insights and Forecast, 2019-2031
- 14.1. Market Analysis, Insights and Forecast - By Country/Sub-region
- 14.1.1 Brazil
- 14.1.2 Argentina
- 14.1.3 Peru
- 14.1.4 Chile
- 14.1.5 Colombia
- 14.1.6 Ecuador
- 14.1.7 Venezuela
- 14.1.8 Rest of South America
- 15. North America Small Hydropower Market Analysis, Insights and Forecast, 2019-2031
- 15.1. Market Analysis, Insights and Forecast - By Country/Sub-region
- 15.1.1 United States
- 15.1.2 Canada
- 15.1.3 Mexico
- 16. MEA Small Hydropower Market Analysis, Insights and Forecast, 2019-2031
- 16.1. Market Analysis, Insights and Forecast - By Country/Sub-region
- 16.1.1 United Arab Emirates
- 16.1.2 Saudi Arabia
- 16.1.3 South Africa
- 16.1.4 Rest of Middle East and Africa
- 17. Competitive Analysis
- 17.1. Global Market Share Analysis 2024
- 17.2. Company Profiles
- 17.2.1 Gilbert Gilkes & Gordon Ltd
- 17.2.1.1. Overview
- 17.2.1.2. Products
- 17.2.1.3. SWOT Analysis
- 17.2.1.4. Recent Developments
- 17.2.1.5. Financials (Based on Availability)
- 17.2.2 Toshiba Energy Systems & Solutions Corporation
- 17.2.2.1. Overview
- 17.2.2.2. Products
- 17.2.2.3. SWOT Analysis
- 17.2.2.4. Recent Developments
- 17.2.2.5. Financials (Based on Availability)
- 17.2.3 Kolektor Group*List Not Exhaustive
- 17.2.3.1. Overview
- 17.2.3.2. Products
- 17.2.3.3. SWOT Analysis
- 17.2.3.4. Recent Developments
- 17.2.3.5. Financials (Based on Availability)
- 17.2.4 Voith GmbH & Co KGaA
- 17.2.4.1. Overview
- 17.2.4.2. Products
- 17.2.4.3. SWOT Analysis
- 17.2.4.4. Recent Developments
- 17.2.4.5. Financials (Based on Availability)
- 17.2.5 PJSC RusHydro
- 17.2.5.1. Overview
- 17.2.5.2. Products
- 17.2.5.3. SWOT Analysis
- 17.2.5.4. Recent Developments
- 17.2.5.5. Financials (Based on Availability)
- 17.2.6 Siemens Energy AG
- 17.2.6.1. Overview
- 17.2.6.2. Products
- 17.2.6.3. SWOT Analysis
- 17.2.6.4. Recent Developments
- 17.2.6.5. Financials (Based on Availability)
- 17.2.7 Natel Energy Inc
- 17.2.7.1. Overview
- 17.2.7.2. Products
- 17.2.7.3. SWOT Analysis
- 17.2.7.4. Recent Developments
- 17.2.7.5. Financials (Based on Availability)
- 17.2.8 GE Renewable Energy
- 17.2.8.1. Overview
- 17.2.8.2. Products
- 17.2.8.3. SWOT Analysis
- 17.2.8.4. Recent Developments
- 17.2.8.5. Financials (Based on Availability)
- 17.2.9 Andritz AG
- 17.2.9.1. Overview
- 17.2.9.2. Products
- 17.2.9.3. SWOT Analysis
- 17.2.9.4. Recent Developments
- 17.2.9.5. Financials (Based on Availability)
- 17.2.10 FLOVEL Energy Private Limited
- 17.2.10.1. Overview
- 17.2.10.2. Products
- 17.2.10.3. SWOT Analysis
- 17.2.10.4. Recent Developments
- 17.2.10.5. Financials (Based on Availability)
- 17.2.1 Gilbert Gilkes & Gordon Ltd
List of Figures
- Figure 1: Global Small Hydropower Market Revenue Breakdown (Million, %) by Region 2024 & 2032
- Figure 2: Global Small Hydropower Market Volume Breakdown (gigawatt, %) by Region 2024 & 2032
- Figure 3: North America Small Hydropower Market Revenue (Million), by Country 2024 & 2032
- Figure 4: North America Small Hydropower Market Volume (gigawatt), by Country 2024 & 2032
- Figure 5: North America Small Hydropower Market Revenue Share (%), by Country 2024 & 2032
- Figure 6: North America Small Hydropower Market Volume Share (%), by Country 2024 & 2032
- Figure 7: Europe Small Hydropower Market Revenue (Million), by Country 2024 & 2032
- Figure 8: Europe Small Hydropower Market Volume (gigawatt), by Country 2024 & 2032
- Figure 9: Europe Small Hydropower Market Revenue Share (%), by Country 2024 & 2032
- Figure 10: Europe Small Hydropower Market Volume Share (%), by Country 2024 & 2032
- Figure 11: Asia Pacific Small Hydropower Market Revenue (Million), by Country 2024 & 2032
- Figure 12: Asia Pacific Small Hydropower Market Volume (gigawatt), by Country 2024 & 2032
- Figure 13: Asia Pacific Small Hydropower Market Revenue Share (%), by Country 2024 & 2032
- Figure 14: Asia Pacific Small Hydropower Market Volume Share (%), by Country 2024 & 2032
- Figure 15: South America Small Hydropower Market Revenue (Million), by Country 2024 & 2032
- Figure 16: South America Small Hydropower Market Volume (gigawatt), by Country 2024 & 2032
- Figure 17: South America Small Hydropower Market Revenue Share (%), by Country 2024 & 2032
- Figure 18: South America Small Hydropower Market Volume Share (%), by Country 2024 & 2032
- Figure 19: North America Small Hydropower Market Revenue (Million), by Country 2024 & 2032
- Figure 20: North America Small Hydropower Market Volume (gigawatt), by Country 2024 & 2032
- Figure 21: North America Small Hydropower Market Revenue Share (%), by Country 2024 & 2032
- Figure 22: North America Small Hydropower Market Volume Share (%), by Country 2024 & 2032
- Figure 23: MEA Small Hydropower Market Revenue (Million), by Country 2024 & 2032
- Figure 24: MEA Small Hydropower Market Volume (gigawatt), by Country 2024 & 2032
- Figure 25: MEA Small Hydropower Market Revenue Share (%), by Country 2024 & 2032
- Figure 26: MEA Small Hydropower Market Volume Share (%), by Country 2024 & 2032
- Figure 27: North America Small Hydropower Market Revenue (Million), by Capacity 2024 & 2032
- Figure 28: North America Small Hydropower Market Volume (gigawatt), by Capacity 2024 & 2032
- Figure 29: North America Small Hydropower Market Revenue Share (%), by Capacity 2024 & 2032
- Figure 30: North America Small Hydropower Market Volume Share (%), by Capacity 2024 & 2032
- Figure 31: North America Small Hydropower Market Revenue (Million), by Application 2024 & 2032
- Figure 32: North America Small Hydropower Market Volume (gigawatt), by Application 2024 & 2032
- Figure 33: North America Small Hydropower Market Revenue Share (%), by Application 2024 & 2032
- Figure 34: North America Small Hydropower Market Volume Share (%), by Application 2024 & 2032
- Figure 35: North America Small Hydropower Market Revenue (Million), by Country 2024 & 2032
- Figure 36: North America Small Hydropower Market Volume (gigawatt), by Country 2024 & 2032
- Figure 37: North America Small Hydropower Market Revenue Share (%), by Country 2024 & 2032
- Figure 38: North America Small Hydropower Market Volume Share (%), by Country 2024 & 2032
- Figure 39: Europe Small Hydropower Market Revenue (Million), by Capacity 2024 & 2032
- Figure 40: Europe Small Hydropower Market Volume (gigawatt), by Capacity 2024 & 2032
- Figure 41: Europe Small Hydropower Market Revenue Share (%), by Capacity 2024 & 2032
- Figure 42: Europe Small Hydropower Market Volume Share (%), by Capacity 2024 & 2032
- Figure 43: Europe Small Hydropower Market Revenue (Million), by Application 2024 & 2032
- Figure 44: Europe Small Hydropower Market Volume (gigawatt), by Application 2024 & 2032
- Figure 45: Europe Small Hydropower Market Revenue Share (%), by Application 2024 & 2032
- Figure 46: Europe Small Hydropower Market Volume Share (%), by Application 2024 & 2032
- Figure 47: Europe Small Hydropower Market Revenue (Million), by Country 2024 & 2032
- Figure 48: Europe Small Hydropower Market Volume (gigawatt), by Country 2024 & 2032
- Figure 49: Europe Small Hydropower Market Revenue Share (%), by Country 2024 & 2032
- Figure 50: Europe Small Hydropower Market Volume Share (%), by Country 2024 & 2032
- Figure 51: Asia Pacific Small Hydropower Market Revenue (Million), by Capacity 2024 & 2032
- Figure 52: Asia Pacific Small Hydropower Market Volume (gigawatt), by Capacity 2024 & 2032
- Figure 53: Asia Pacific Small Hydropower Market Revenue Share (%), by Capacity 2024 & 2032
- Figure 54: Asia Pacific Small Hydropower Market Volume Share (%), by Capacity 2024 & 2032
- Figure 55: Asia Pacific Small Hydropower Market Revenue (Million), by Application 2024 & 2032
- Figure 56: Asia Pacific Small Hydropower Market Volume (gigawatt), by Application 2024 & 2032
- Figure 57: Asia Pacific Small Hydropower Market Revenue Share (%), by Application 2024 & 2032
- Figure 58: Asia Pacific Small Hydropower Market Volume Share (%), by Application 2024 & 2032
- Figure 59: Asia Pacific Small Hydropower Market Revenue (Million), by Country 2024 & 2032
- Figure 60: Asia Pacific Small Hydropower Market Volume (gigawatt), by Country 2024 & 2032
- Figure 61: Asia Pacific Small Hydropower Market Revenue Share (%), by Country 2024 & 2032
- Figure 62: Asia Pacific Small Hydropower Market Volume Share (%), by Country 2024 & 2032
- Figure 63: Middle East and Africa Small Hydropower Market Revenue (Million), by Capacity 2024 & 2032
- Figure 64: Middle East and Africa Small Hydropower Market Volume (gigawatt), by Capacity 2024 & 2032
- Figure 65: Middle East and Africa Small Hydropower Market Revenue Share (%), by Capacity 2024 & 2032
- Figure 66: Middle East and Africa Small Hydropower Market Volume Share (%), by Capacity 2024 & 2032
- Figure 67: Middle East and Africa Small Hydropower Market Revenue (Million), by Application 2024 & 2032
- Figure 68: Middle East and Africa Small Hydropower Market Volume (gigawatt), by Application 2024 & 2032
- Figure 69: Middle East and Africa Small Hydropower Market Revenue Share (%), by Application 2024 & 2032
- Figure 70: Middle East and Africa Small Hydropower Market Volume Share (%), by Application 2024 & 2032
- Figure 71: Middle East and Africa Small Hydropower Market Revenue (Million), by Country 2024 & 2032
- Figure 72: Middle East and Africa Small Hydropower Market Volume (gigawatt), by Country 2024 & 2032
- Figure 73: Middle East and Africa Small Hydropower Market Revenue Share (%), by Country 2024 & 2032
- Figure 74: Middle East and Africa Small Hydropower Market Volume Share (%), by Country 2024 & 2032
- Figure 75: South America Small Hydropower Market Revenue (Million), by Capacity 2024 & 2032
- Figure 76: South America Small Hydropower Market Volume (gigawatt), by Capacity 2024 & 2032
- Figure 77: South America Small Hydropower Market Revenue Share (%), by Capacity 2024 & 2032
- Figure 78: South America Small Hydropower Market Volume Share (%), by Capacity 2024 & 2032
- Figure 79: South America Small Hydropower Market Revenue (Million), by Application 2024 & 2032
- Figure 80: South America Small Hydropower Market Volume (gigawatt), by Application 2024 & 2032
- Figure 81: South America Small Hydropower Market Revenue Share (%), by Application 2024 & 2032
- Figure 82: South America Small Hydropower Market Volume Share (%), by Application 2024 & 2032
- Figure 83: South America Small Hydropower Market Revenue (Million), by Country 2024 & 2032
- Figure 84: South America Small Hydropower Market Volume (gigawatt), by Country 2024 & 2032
- Figure 85: South America Small Hydropower Market Revenue Share (%), by Country 2024 & 2032
- Figure 86: South America Small Hydropower Market Volume Share (%), by Country 2024 & 2032
List of Tables
- Table 1: Global Small Hydropower Market Revenue Million Forecast, by Region 2019 & 2032
- Table 2: Global Small Hydropower Market Volume gigawatt Forecast, by Region 2019 & 2032
- Table 3: Global Small Hydropower Market Revenue Million Forecast, by Capacity 2019 & 2032
- Table 4: Global Small Hydropower Market Volume gigawatt Forecast, by Capacity 2019 & 2032
- Table 5: Global Small Hydropower Market Revenue Million Forecast, by Application 2019 & 2032
- Table 6: Global Small Hydropower Market Volume gigawatt Forecast, by Application 2019 & 2032
- Table 7: Global Small Hydropower Market Revenue Million Forecast, by Region 2019 & 2032
- Table 8: Global Small Hydropower Market Volume gigawatt Forecast, by Region 2019 & 2032
- Table 9: Global Small Hydropower Market Revenue Million Forecast, by Country 2019 & 2032
- Table 10: Global Small Hydropower Market Volume gigawatt Forecast, by Country 2019 & 2032
- Table 11: United States Small Hydropower Market Revenue (Million) Forecast, by Application 2019 & 2032
- Table 12: United States Small Hydropower Market Volume (gigawatt) Forecast, by Application 2019 & 2032
- Table 13: Canada Small Hydropower Market Revenue (Million) Forecast, by Application 2019 & 2032
- Table 14: Canada Small Hydropower Market Volume (gigawatt) Forecast, by Application 2019 & 2032
- Table 15: Mexico Small Hydropower Market Revenue (Million) Forecast, by Application 2019 & 2032
- Table 16: Mexico Small Hydropower Market Volume (gigawatt) Forecast, by Application 2019 & 2032
- Table 17: Global Small Hydropower Market Revenue Million Forecast, by Country 2019 & 2032
- Table 18: Global Small Hydropower Market Volume gigawatt Forecast, by Country 2019 & 2032
- Table 19: Germany Small Hydropower Market Revenue (Million) Forecast, by Application 2019 & 2032
- Table 20: Germany Small Hydropower Market Volume (gigawatt) Forecast, by Application 2019 & 2032
- Table 21: United Kingdom Small Hydropower Market Revenue (Million) Forecast, by Application 2019 & 2032
- Table 22: United Kingdom Small Hydropower Market Volume (gigawatt) Forecast, by Application 2019 & 2032
- Table 23: France Small Hydropower Market Revenue (Million) Forecast, by Application 2019 & 2032
- Table 24: France Small Hydropower Market Volume (gigawatt) Forecast, by Application 2019 & 2032
- Table 25: Spain Small Hydropower Market Revenue (Million) Forecast, by Application 2019 & 2032
- Table 26: Spain Small Hydropower Market Volume (gigawatt) Forecast, by Application 2019 & 2032
- Table 27: Italy Small Hydropower Market Revenue (Million) Forecast, by Application 2019 & 2032
- Table 28: Italy Small Hydropower Market Volume (gigawatt) Forecast, by Application 2019 & 2032
- Table 29: Spain Small Hydropower Market Revenue (Million) Forecast, by Application 2019 & 2032
- Table 30: Spain Small Hydropower Market Volume (gigawatt) Forecast, by Application 2019 & 2032
- Table 31: Belgium Small Hydropower Market Revenue (Million) Forecast, by Application 2019 & 2032
- Table 32: Belgium Small Hydropower Market Volume (gigawatt) Forecast, by Application 2019 & 2032
- Table 33: Netherland Small Hydropower Market Revenue (Million) Forecast, by Application 2019 & 2032
- Table 34: Netherland Small Hydropower Market Volume (gigawatt) Forecast, by Application 2019 & 2032
- Table 35: Nordics Small Hydropower Market Revenue (Million) Forecast, by Application 2019 & 2032
- Table 36: Nordics Small Hydropower Market Volume (gigawatt) Forecast, by Application 2019 & 2032
- Table 37: Rest of Europe Small Hydropower Market Revenue (Million) Forecast, by Application 2019 & 2032
- Table 38: Rest of Europe Small Hydropower Market Volume (gigawatt) Forecast, by Application 2019 & 2032
- Table 39: Global Small Hydropower Market Revenue Million Forecast, by Country 2019 & 2032
- Table 40: Global Small Hydropower Market Volume gigawatt Forecast, by Country 2019 & 2032
- Table 41: China Small Hydropower Market Revenue (Million) Forecast, by Application 2019 & 2032
- Table 42: China Small Hydropower Market Volume (gigawatt) Forecast, by Application 2019 & 2032
- Table 43: Japan Small Hydropower Market Revenue (Million) Forecast, by Application 2019 & 2032
- Table 44: Japan Small Hydropower Market Volume (gigawatt) Forecast, by Application 2019 & 2032
- Table 45: India Small Hydropower Market Revenue (Million) Forecast, by Application 2019 & 2032
- Table 46: India Small Hydropower Market Volume (gigawatt) Forecast, by Application 2019 & 2032
- Table 47: South Korea Small Hydropower Market Revenue (Million) Forecast, by Application 2019 & 2032
- Table 48: South Korea Small Hydropower Market Volume (gigawatt) Forecast, by Application 2019 & 2032
- Table 49: Southeast Asia Small Hydropower Market Revenue (Million) Forecast, by Application 2019 & 2032
- Table 50: Southeast Asia Small Hydropower Market Volume (gigawatt) Forecast, by Application 2019 & 2032
- Table 51: Australia Small Hydropower Market Revenue (Million) Forecast, by Application 2019 & 2032
- Table 52: Australia Small Hydropower Market Volume (gigawatt) Forecast, by Application 2019 & 2032
- Table 53: Indonesia Small Hydropower Market Revenue (Million) Forecast, by Application 2019 & 2032
- Table 54: Indonesia Small Hydropower Market Volume (gigawatt) Forecast, by Application 2019 & 2032
- Table 55: Phillipes Small Hydropower Market Revenue (Million) Forecast, by Application 2019 & 2032
- Table 56: Phillipes Small Hydropower Market Volume (gigawatt) Forecast, by Application 2019 & 2032
- Table 57: Singapore Small Hydropower Market Revenue (Million) Forecast, by Application 2019 & 2032
- Table 58: Singapore Small Hydropower Market Volume (gigawatt) Forecast, by Application 2019 & 2032
- Table 59: Thailandc Small Hydropower Market Revenue (Million) Forecast, by Application 2019 & 2032
- Table 60: Thailandc Small Hydropower Market Volume (gigawatt) Forecast, by Application 2019 & 2032
- Table 61: Rest of Asia Pacific Small Hydropower Market Revenue (Million) Forecast, by Application 2019 & 2032
- Table 62: Rest of Asia Pacific Small Hydropower Market Volume (gigawatt) Forecast, by Application 2019 & 2032
- Table 63: Global Small Hydropower Market Revenue Million Forecast, by Country 2019 & 2032
- Table 64: Global Small Hydropower Market Volume gigawatt Forecast, by Country 2019 & 2032
- Table 65: Brazil Small Hydropower Market Revenue (Million) Forecast, by Application 2019 & 2032
- Table 66: Brazil Small Hydropower Market Volume (gigawatt) Forecast, by Application 2019 & 2032
- Table 67: Argentina Small Hydropower Market Revenue (Million) Forecast, by Application 2019 & 2032
- Table 68: Argentina Small Hydropower Market Volume (gigawatt) Forecast, by Application 2019 & 2032
- Table 69: Peru Small Hydropower Market Revenue (Million) Forecast, by Application 2019 & 2032
- Table 70: Peru Small Hydropower Market Volume (gigawatt) Forecast, by Application 2019 & 2032
- Table 71: Chile Small Hydropower Market Revenue (Million) Forecast, by Application 2019 & 2032
- Table 72: Chile Small Hydropower Market Volume (gigawatt) Forecast, by Application 2019 & 2032
- Table 73: Colombia Small Hydropower Market Revenue (Million) Forecast, by Application 2019 & 2032
- Table 74: Colombia Small Hydropower Market Volume (gigawatt) Forecast, by Application 2019 & 2032
- Table 75: Ecuador Small Hydropower Market Revenue (Million) Forecast, by Application 2019 & 2032
- Table 76: Ecuador Small Hydropower Market Volume (gigawatt) Forecast, by Application 2019 & 2032
- Table 77: Venezuela Small Hydropower Market Revenue (Million) Forecast, by Application 2019 & 2032
- Table 78: Venezuela Small Hydropower Market Volume (gigawatt) Forecast, by Application 2019 & 2032
- Table 79: Rest of South America Small Hydropower Market Revenue (Million) Forecast, by Application 2019 & 2032
- Table 80: Rest of South America Small Hydropower Market Volume (gigawatt) Forecast, by Application 2019 & 2032
- Table 81: Global Small Hydropower Market Revenue Million Forecast, by Country 2019 & 2032
- Table 82: Global Small Hydropower Market Volume gigawatt Forecast, by Country 2019 & 2032
- Table 83: United States Small Hydropower Market Revenue (Million) Forecast, by Application 2019 & 2032
- Table 84: United States Small Hydropower Market Volume (gigawatt) Forecast, by Application 2019 & 2032
- Table 85: Canada Small Hydropower Market Revenue (Million) Forecast, by Application 2019 & 2032
- Table 86: Canada Small Hydropower Market Volume (gigawatt) Forecast, by Application 2019 & 2032
- Table 87: Mexico Small Hydropower Market Revenue (Million) Forecast, by Application 2019 & 2032
- Table 88: Mexico Small Hydropower Market Volume (gigawatt) Forecast, by Application 2019 & 2032
- Table 89: Global Small Hydropower Market Revenue Million Forecast, by Country 2019 & 2032
- Table 90: Global Small Hydropower Market Volume gigawatt Forecast, by Country 2019 & 2032
- Table 91: United Arab Emirates Small Hydropower Market Revenue (Million) Forecast, by Application 2019 & 2032
- Table 92: United Arab Emirates Small Hydropower Market Volume (gigawatt) Forecast, by Application 2019 & 2032
- Table 93: Saudi Arabia Small Hydropower Market Revenue (Million) Forecast, by Application 2019 & 2032
- Table 94: Saudi Arabia Small Hydropower Market Volume (gigawatt) Forecast, by Application 2019 & 2032
- Table 95: South Africa Small Hydropower Market Revenue (Million) Forecast, by Application 2019 & 2032
- Table 96: South Africa Small Hydropower Market Volume (gigawatt) Forecast, by Application 2019 & 2032
- Table 97: Rest of Middle East and Africa Small Hydropower Market Revenue (Million) Forecast, by Application 2019 & 2032
- Table 98: Rest of Middle East and Africa Small Hydropower Market Volume (gigawatt) Forecast, by Application 2019 & 2032
- Table 99: Global Small Hydropower Market Revenue Million Forecast, by Capacity 2019 & 2032
- Table 100: Global Small Hydropower Market Volume gigawatt Forecast, by Capacity 2019 & 2032
- Table 101: Global Small Hydropower Market Revenue Million Forecast, by Application 2019 & 2032
- Table 102: Global Small Hydropower Market Volume gigawatt Forecast, by Application 2019 & 2032
- Table 103: Global Small Hydropower Market Revenue Million Forecast, by Country 2019 & 2032
- Table 104: Global Small Hydropower Market Volume gigawatt Forecast, by Country 2019 & 2032
- Table 105: United States Small Hydropower Market Revenue (Million) Forecast, by Application 2019 & 2032
- Table 106: United States Small Hydropower Market Volume (gigawatt) Forecast, by Application 2019 & 2032
- Table 107: Canada Small Hydropower Market Revenue (Million) Forecast, by Application 2019 & 2032
- Table 108: Canada Small Hydropower Market Volume (gigawatt) Forecast, by Application 2019 & 2032
- Table 109: Rest of North America Small Hydropower Market Revenue (Million) Forecast, by Application 2019 & 2032
- Table 110: Rest of North America Small Hydropower Market Volume (gigawatt) Forecast, by Application 2019 & 2032
- Table 111: Global Small Hydropower Market Revenue Million Forecast, by Capacity 2019 & 2032
- Table 112: Global Small Hydropower Market Volume gigawatt Forecast, by Capacity 2019 & 2032
- Table 113: Global Small Hydropower Market Revenue Million Forecast, by Application 2019 & 2032
- Table 114: Global Small Hydropower Market Volume gigawatt Forecast, by Application 2019 & 2032
- Table 115: Global Small Hydropower Market Revenue Million Forecast, by Country 2019 & 2032
- Table 116: Global Small Hydropower Market Volume gigawatt Forecast, by Country 2019 & 2032
- Table 117: Germany Small Hydropower Market Revenue (Million) Forecast, by Application 2019 & 2032
- Table 118: Germany Small Hydropower Market Volume (gigawatt) Forecast, by Application 2019 & 2032
- Table 119: United Kingdom Small Hydropower Market Revenue (Million) Forecast, by Application 2019 & 2032
- Table 120: United Kingdom Small Hydropower Market Volume (gigawatt) Forecast, by Application 2019 & 2032
- Table 121: France Small Hydropower Market Revenue (Million) Forecast, by Application 2019 & 2032
- Table 122: France Small Hydropower Market Volume (gigawatt) Forecast, by Application 2019 & 2032
- Table 123: Italy Small Hydropower Market Revenue (Million) Forecast, by Application 2019 & 2032
- Table 124: Italy Small Hydropower Market Volume (gigawatt) Forecast, by Application 2019 & 2032
- Table 125: Spain Small Hydropower Market Revenue (Million) Forecast, by Application 2019 & 2032
- Table 126: Spain Small Hydropower Market Volume (gigawatt) Forecast, by Application 2019 & 2032
- Table 127: Nordic Small Hydropower Market Revenue (Million) Forecast, by Application 2019 & 2032
- Table 128: Nordic Small Hydropower Market Volume (gigawatt) Forecast, by Application 2019 & 2032
- Table 129: Turkey Small Hydropower Market Revenue (Million) Forecast, by Application 2019 & 2032
- Table 130: Turkey Small Hydropower Market Volume (gigawatt) Forecast, by Application 2019 & 2032
- Table 131: Russia Small Hydropower Market Revenue (Million) Forecast, by Application 2019 & 2032
- Table 132: Russia Small Hydropower Market Volume (gigawatt) Forecast, by Application 2019 & 2032
- Table 133: Rest of Europe Small Hydropower Market Revenue (Million) Forecast, by Application 2019 & 2032
- Table 134: Rest of Europe Small Hydropower Market Volume (gigawatt) Forecast, by Application 2019 & 2032
- Table 135: Global Small Hydropower Market Revenue Million Forecast, by Capacity 2019 & 2032
- Table 136: Global Small Hydropower Market Volume gigawatt Forecast, by Capacity 2019 & 2032
- Table 137: Global Small Hydropower Market Revenue Million Forecast, by Application 2019 & 2032
- Table 138: Global Small Hydropower Market Volume gigawatt Forecast, by Application 2019 & 2032
- Table 139: Global Small Hydropower Market Revenue Million Forecast, by Country 2019 & 2032
- Table 140: Global Small Hydropower Market Volume gigawatt Forecast, by Country 2019 & 2032
- Table 141: China Small Hydropower Market Revenue (Million) Forecast, by Application 2019 & 2032
- Table 142: China Small Hydropower Market Volume (gigawatt) Forecast, by Application 2019 & 2032
- Table 143: India Small Hydropower Market Revenue (Million) Forecast, by Application 2019 & 2032
- Table 144: India Small Hydropower Market Volume (gigawatt) Forecast, by Application 2019 & 2032
- Table 145: Japan Small Hydropower Market Revenue (Million) Forecast, by Application 2019 & 2032
- Table 146: Japan Small Hydropower Market Volume (gigawatt) Forecast, by Application 2019 & 2032
- Table 147: South Korea Small Hydropower Market Revenue (Million) Forecast, by Application 2019 & 2032
- Table 148: South Korea Small Hydropower Market Volume (gigawatt) Forecast, by Application 2019 & 2032
- Table 149: Malaysia Small Hydropower Market Revenue (Million) Forecast, by Application 2019 & 2032
- Table 150: Malaysia Small Hydropower Market Volume (gigawatt) Forecast, by Application 2019 & 2032
- Table 151: Thailand Small Hydropower Market Revenue (Million) Forecast, by Application 2019 & 2032
- Table 152: Thailand Small Hydropower Market Volume (gigawatt) Forecast, by Application 2019 & 2032
- Table 153: Vietnam Small Hydropower Market Revenue (Million) Forecast, by Application 2019 & 2032
- Table 154: Vietnam Small Hydropower Market Volume (gigawatt) Forecast, by Application 2019 & 2032
- Table 155: Rest of Asia Pacific Small Hydropower Market Revenue (Million) Forecast, by Application 2019 & 2032
- Table 156: Rest of Asia Pacific Small Hydropower Market Volume (gigawatt) Forecast, by Application 2019 & 2032
- Table 157: Global Small Hydropower Market Revenue Million Forecast, by Capacity 2019 & 2032
- Table 158: Global Small Hydropower Market Volume gigawatt Forecast, by Capacity 2019 & 2032
- Table 159: Global Small Hydropower Market Revenue Million Forecast, by Application 2019 & 2032
- Table 160: Global Small Hydropower Market Volume gigawatt Forecast, by Application 2019 & 2032
- Table 161: Global Small Hydropower Market Revenue Million Forecast, by Country 2019 & 2032
- Table 162: Global Small Hydropower Market Volume gigawatt Forecast, by Country 2019 & 2032
- Table 163: Saudi Arabia Small Hydropower Market Revenue (Million) Forecast, by Application 2019 & 2032
- Table 164: Saudi Arabia Small Hydropower Market Volume (gigawatt) Forecast, by Application 2019 & 2032
- Table 165: United Arab Emirates Small Hydropower Market Revenue (Million) Forecast, by Application 2019 & 2032
- Table 166: United Arab Emirates Small Hydropower Market Volume (gigawatt) Forecast, by Application 2019 & 2032
- Table 167: Nigeria Small Hydropower Market Revenue (Million) Forecast, by Application 2019 & 2032
- Table 168: Nigeria Small Hydropower Market Volume (gigawatt) Forecast, by Application 2019 & 2032
- Table 169: Egypt Small Hydropower Market Revenue (Million) Forecast, by Application 2019 & 2032
- Table 170: Egypt Small Hydropower Market Volume (gigawatt) Forecast, by Application 2019 & 2032
- Table 171: South Africa Small Hydropower Market Revenue (Million) Forecast, by Application 2019 & 2032
- Table 172: South Africa Small Hydropower Market Volume (gigawatt) Forecast, by Application 2019 & 2032
- Table 173: Rest of Middle East and Africa Small Hydropower Market Revenue (Million) Forecast, by Application 2019 & 2032
- Table 174: Rest of Middle East and Africa Small Hydropower Market Volume (gigawatt) Forecast, by Application 2019 & 2032
- Table 175: Global Small Hydropower Market Revenue Million Forecast, by Capacity 2019 & 2032
- Table 176: Global Small Hydropower Market Volume gigawatt Forecast, by Capacity 2019 & 2032
- Table 177: Global Small Hydropower Market Revenue Million Forecast, by Application 2019 & 2032
- Table 178: Global Small Hydropower Market Volume gigawatt Forecast, by Application 2019 & 2032
- Table 179: Global Small Hydropower Market Revenue Million Forecast, by Country 2019 & 2032
- Table 180: Global Small Hydropower Market Volume gigawatt Forecast, by Country 2019 & 2032
- Table 181: Brazil Small Hydropower Market Revenue (Million) Forecast, by Application 2019 & 2032
- Table 182: Brazil Small Hydropower Market Volume (gigawatt) Forecast, by Application 2019 & 2032
- Table 183: Argentina Small Hydropower Market Revenue (Million) Forecast, by Application 2019 & 2032
- Table 184: Argentina Small Hydropower Market Volume (gigawatt) Forecast, by Application 2019 & 2032
- Table 185: Colombia Small Hydropower Market Revenue (Million) Forecast, by Application 2019 & 2032
- Table 186: Colombia Small Hydropower Market Volume (gigawatt) Forecast, by Application 2019 & 2032
- Table 187: Rest of South America Small Hydropower Market Revenue (Million) Forecast, by Application 2019 & 2032
- Table 188: Rest of South America Small Hydropower Market Volume (gigawatt) Forecast, by Application 2019 & 2032
Frequently Asked Questions
1. What is the projected Compound Annual Growth Rate (CAGR) of the Small Hydropower Market?
The projected CAGR is approximately > 2.00%.
2. Which companies are prominent players in the Small Hydropower Market?
Key companies in the market include Gilbert Gilkes & Gordon Ltd, Toshiba Energy Systems & Solutions Corporation, Kolektor Group*List Not Exhaustive, Voith GmbH & Co KGaA, PJSC RusHydro, Siemens Energy AG, Natel Energy Inc, GE Renewable Energy, Andritz AG, FLOVEL Energy Private Limited.
3. What are the main segments of the Small Hydropower Market?
The market segments include Capacity, Application.
4. Can you provide details about the market size?
The market size is estimated to be USD XX Million as of 2022.
5. What are some drivers contributing to market growth?
4.; Growing Emphasis on Renewable Energy Integration4.; Significant Hydropower Potential.
6. What are the notable trends driving market growth?
The 1-10 MW Segment Expected to Dominate the Market.
7. Are there any restraints impacting market growth?
4.; Competition From Other Energy Storage Technologies.
8. Can you provide examples of recent developments in the market?
July 2022: SMEC was hired by KPower Engineering Sdn Bhd (KPEng), together with Tellhow International Engineering & Contracting Co Ltd, to review the design and propose modifications required for three small hydropower plants in East Malaysia. The three hydropower projects at Sungai Bengkoka Upper, Sungai Bengkoka Lower, and Sungai Togohu in Kota Marudu, Sabah, had a planned capacity totaling 29.1 MW. The consortium had taken over from the previous contractor to complete the engineering, design, procurement, construction, and commissioning works, and ORP, a subsidiary of OHP Ventures Sdn Bhd, owns the project.
9. What pricing options are available for accessing the report?
Pricing options include single-user, multi-user, and enterprise licenses priced at USD 4750, USD 5250, and USD 8750 respectively.
10. Is the market size provided in terms of value or volume?
The market size is provided in terms of value, measured in Million and volume, measured in gigawatt.
11. Are there any specific market keywords associated with the report?
Yes, the market keyword associated with the report is "Small Hydropower Market," which aids in identifying and referencing the specific market segment covered.
12. How do I determine which pricing option suits my needs best?
The pricing options vary based on user requirements and access needs. Individual users may opt for single-user licenses, while businesses requiring broader access may choose multi-user or enterprise licenses for cost-effective access to the report.
13. Are there any additional resources or data provided in the Small Hydropower Market report?
While the report offers comprehensive insights, it's advisable to review the specific contents or supplementary materials provided to ascertain if additional resources or data are available.
14. How can I stay updated on further developments or reports in the Small Hydropower Market?
To stay informed about further developments, trends, and reports in the Small Hydropower Market, consider subscribing to industry newsletters, following relevant companies and organizations, or regularly checking reputable industry news sources and publications.
Methodology
Step 1 - Identification of Relevant Samples Size from Population Database


Step 2 - Approaches for Defining Global Market Size (Value, Volume* & Price*)

Note*: In applicable scenarios
Step 3 - Data Sources
Primary Research
- Web Analytics
- Survey Reports
- Research Institute
- Latest Research Reports
- Opinion Leaders
Secondary Research
- Annual Reports
- White Paper
- Latest Press Release
- Industry Association
- Paid Database
- Investor Presentations

Step 4 - Data Triangulation
Involves using different sources of information in order to increase the validity of a study
These sources are likely to be stakeholders in a program - participants, other researchers, program staff, other community members, and so on.
Then we put all data in single framework & apply various statistical tools to find out the dynamic on the market.
During the analysis stage, feedback from the stakeholder groups would be compared to determine areas of agreement as well as areas of divergence


