
Key Insights
The global smartwatch market is experiencing robust growth, fueled by a confluence of factors. The 27.78% CAGR (2019-2033) indicates significant expansion, driven primarily by increasing consumer demand for wearable technology, advancements in health and fitness tracking capabilities, and the integration of smart features into everyday life. The market segmentation reveals AMOLED displays are gaining popularity over PMOLED and TFT LCD, reflecting a consumer preference for superior visual quality and power efficiency. In terms of applications, personal assistance features remain dominant, but the medical and sports segments are exhibiting strong growth, propelled by the integration of advanced sensors and health monitoring functionalities. Key players like Apple, Samsung, and Garmin are leading the market, constantly innovating with new designs, features, and operating systems (like WatchOS and Wear OS). Competition is fierce, pushing innovation and driving down prices, making smartwatches more accessible to a wider consumer base.
Looking ahead, the smartwatch market's continued growth will depend on several factors. The successful integration of innovative health monitoring features, such as ECG and blood oxygen level tracking, will significantly impact market expansion. Furthermore, the development of longer-lasting batteries, enhanced water resistance, and improved user interfaces will play a vital role in driving adoption. The growing adoption of 5G technology will also facilitate faster data transfer and improved connectivity, enhancing the functionality of smartwatches. However, concerns about data privacy and security, coupled with the relatively high price point of premium smartwatches, could pose challenges to sustained growth. Geographic expansion into developing markets will also be crucial for continued market expansion, particularly in regions with increasing smartphone penetration.
Smartwatch Industry Market Report: 2019-2033
This comprehensive report provides an in-depth analysis of the global smartwatch market, offering invaluable insights for industry professionals, investors, and strategists. With a focus on market dynamics, competitive landscapes, and future trends, this report covers the period from 2019 to 2033, with a base year of 2025 and a forecast period of 2025-2033. The report projects a market valued in the billions and reveals key growth opportunities within this rapidly evolving sector.
Smartwatch Industry Market Structure & Innovation Trends
The smartwatch market exhibits a moderately concentrated structure, with key players like Apple, Samsung, and Garmin holding significant market share, estimated at xx% in 2025. However, smaller players are also making inroads through innovation and niche market targeting. Market concentration is influenced by factors such as brand recognition, technological capabilities, and distribution networks. Innovation is driven by advancements in sensor technology, display technology, battery life, and software features, along with increasing integration with health and fitness applications. Regulatory frameworks concerning data privacy and health data security significantly impact market dynamics. Product substitutes, such as fitness trackers and basic smartbands, offer competitive pressure, requiring continuous product differentiation. End-user demographics are expanding, with significant growth observed in age groups beyond the initial early adopter base. M&A activity in recent years has seen deal values totaling xx Million, primarily focused on enhancing technological capabilities and expanding market reach. This includes acquisitions focusing on software development, sensor technology, and expanding global distribution.
Smartwatch Industry Market Dynamics & Trends
The smartwatch market is experiencing robust growth, with a projected Compound Annual Growth Rate (CAGR) of xx% during the forecast period (2025-2033). This growth is fueled by several key factors, including increasing smartphone penetration, rising consumer disposable income, and the growing demand for wearable technology for health and fitness tracking. Technological disruptions, such as the introduction of 5G connectivity and advanced sensor technology, further propel market expansion. Consumer preferences are shifting towards sleek designs, longer battery life, and more advanced health monitoring features. Competitive dynamics are intense, with major players investing heavily in R&D to differentiate their offerings. Market penetration is increasing across various demographics, with broader adoption in both developed and developing economies.
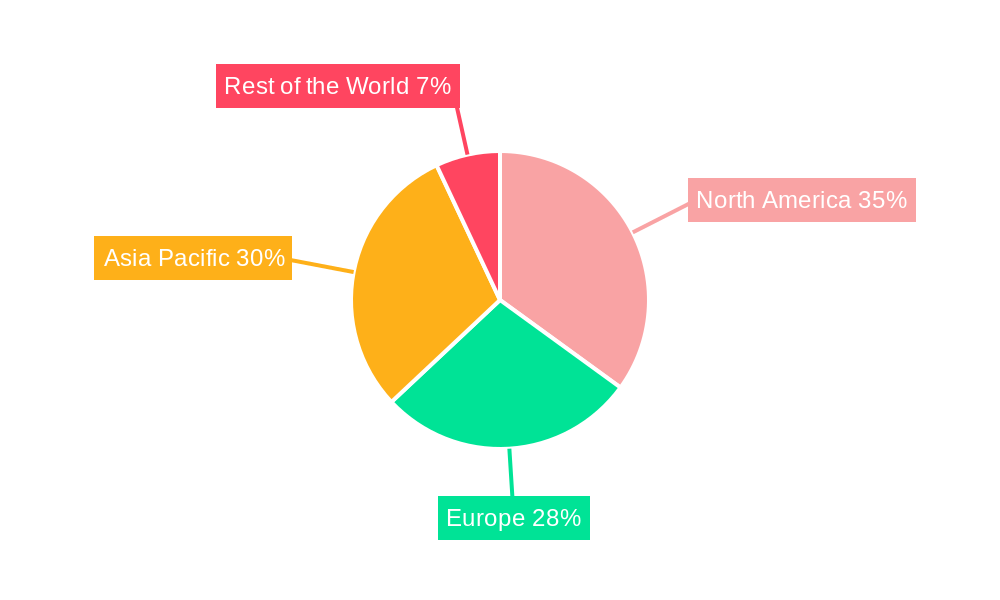
Dominant Regions & Segments in Smartwatch Industry
The North American region currently holds a dominant position in the global smartwatch market, driven by high consumer adoption rates and strong technological innovation. However, the Asia-Pacific region is witnessing rapid growth, with countries like China and India exhibiting significant potential.
- By Operating System: Watch OS holds the highest market share, followed by Wear OS and Other Operating Systems. Watch OS’s dominance is attributed to Apple's strong brand equity and a closed ecosystem.
- By Display Type: AMOLED displays are gaining popularity due to superior picture quality and power efficiency. However, PMOLED and TFT LCD displays continue to hold market share in lower-priced segments.
- By Application: The Personal Assistance segment leads, with continued growth projected in the Medical and Sports segments due to advanced health tracking and fitness monitoring features. Economic factors, such as disposable income and healthcare expenditure, play significant roles. Technological infrastructure, particularly reliable internet access, also contributes to widespread adoption.
The dominance analysis points to economies of scale and superior marketing efforts of leading brands contributing significantly to market share.
Smartwatch Industry Product Innovations
Recent product innovations in the smartwatch industry focus on improved health monitoring capabilities, enhanced battery life, and more seamless integration with smartphones. Features like ECG monitoring, blood oxygen saturation tracking, and sleep analysis are gaining traction. Miniaturization of components and the development of more efficient power management systems are extending battery life. Improved user interfaces and customizable watch faces provide a more personalized experience, reflecting strong market fit with consumer preferences.
Report Scope & Segmentation Analysis
This report segments the smartwatch market by operating system (Watch OS, Wear OS, Other Operating Systems), display type (AMOLED, PMOLED, TFT LCD), and application (Personal Assistance, Medical, Sports, Other Applications). Growth projections vary significantly across segments, with the highest growth expected in the medical and sports applications segments due to rising health consciousness. Market sizes are projected to reach xx Million by 2033, with competitive dynamics influenced by product differentiation, pricing strategies, and marketing campaigns.
Key Drivers of Smartwatch Industry Growth
Several factors are driving the growth of the smartwatch industry. Advancements in miniaturization and power efficiency of components enable more sophisticated features within smaller form factors. The growing consumer demand for health and fitness tracking coupled with the increasing affordability of smartwatches fuels widespread adoption. Favorable government regulations in various markets promote innovation and market growth. Examples include increased adoption of contactless payments and health integration through wearable tech.
Challenges in the Smartwatch Industry Sector
The smartwatch industry faces several challenges, including intense competition, the potential for supply chain disruptions affecting component availability, and concerns related to data security and privacy. Regulatory hurdles in specific markets can impede market penetration and innovation. These challenges have quantifiable impacts, creating constraints on growth and profitability for companies operating in the space.
Emerging Opportunities in Smartwatch Industry
The smartwatch industry presents several emerging opportunities. The increasing adoption of smartwatches in healthcare, coupled with advancements in sensor technology, offers substantial potential for growth in the medical applications segment. The integration of smartwatches with other IoT devices creates opportunities for expanded applications and services. New markets in developing countries are emerging, expanding the potential customer base.
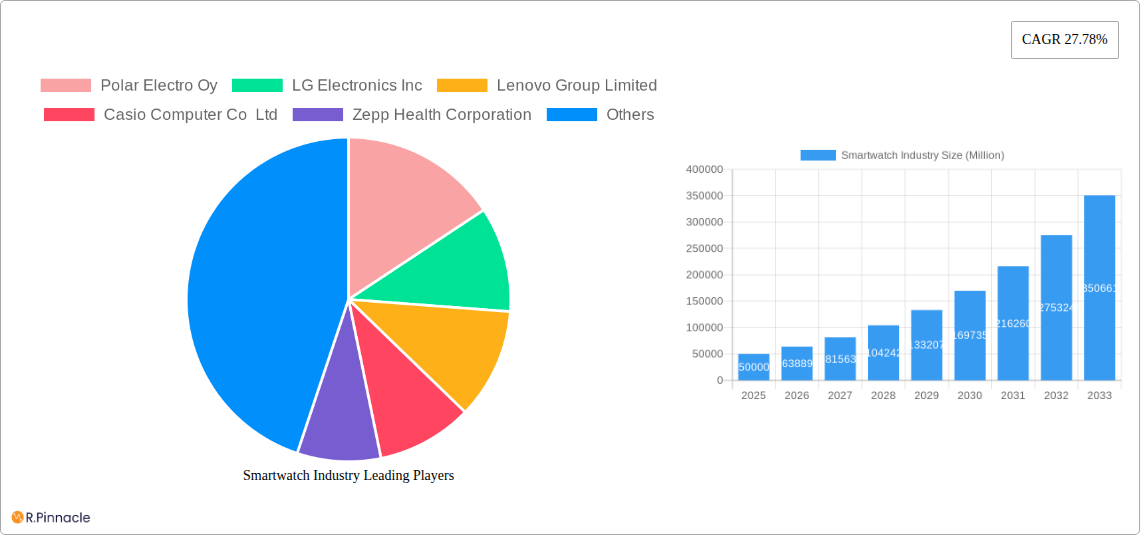
Leading Players in the Smartwatch Industry Market
- Polar Electro Oy
- LG Electronics Inc
- Lenovo Group Limited
- Casio Computer Co Ltd
- Zepp Health Corporation
- Samsung Electronics Co Ltd
- Garmin Ltd
- Fitbit Inc
- Huawei Technologies Co Ltd
- Fossil Group Inc
- Apple Inc
- Sony Corporation
Key Developments in Smartwatch Industry
- June 2022: Apple previewed watchOS 9, introducing enhanced features and improved user experiences. This update significantly impacted market dynamics by boosting Apple Watch sales.
- January 2022: Fossil and Razer partnered to launch a limited-edition smartwatch, demonstrating the potential for successful collaborations to enhance product appeal and market reach.
Future Outlook for Smartwatch Industry Market
The smartwatch market is poised for continued growth, driven by technological advancements, rising consumer demand for health and fitness tracking, and the expansion into new markets. Strategic partnerships, product diversification, and focus on developing innovative features will be key to success. The market is expected to reach xx Million by 2033, presenting lucrative opportunities for businesses.
Smartwatch Industry Segmentation
-
1. Operating System
- 1.1. Watch OS
- 1.2. Wear OS
- 1.3. Other Operating Systems
-
2. Display Type
- 2.1. AMOLED
- 2.2. PMOLED
- 2.3. TFT LCD
-
3. Application
- 3.1. Personal Assistance
- 3.2. Medical
- 3.3. Sports
- 3.4. Other Applications
Smartwatch Industry Segmentation By Geography
- 1. North America: United States Canada Mexico
- 2. Europe: Germany: France: Italy: United Kingdom Netherlands Rest of Europe
- 3. Asia Pacific: China, Japan, India, South Korea, Taiwan, Australia, Rest of Asia-Pacific
- 4. South America : Brazil, Argentina, Rest of South America
- 5. MEA: Middle East, Africa
Smartwatch Industry REPORT HIGHLIGHTS
| Aspects | Details |
|---|---|
| Study Period | 2019-2033 |
| Base Year | 2024 |
| Estimated Year | 2025 |
| Forecast Period | 2025-2033 |
| Historical Period | 2019-2024 |
| Growth Rate | CAGR of 27.78% from 2019-2033 |
| Segmentation |
|
Table of Contents
- 1. Introduction
- 1.1. Research Scope
- 1.2. Market Segmentation
- 1.3. Research Methodology
- 1.4. Definitions and Assumptions
- 2. Executive Summary
- 2.1. Introduction
- 3. Market Dynamics
- 3.1. Introduction
- 3.2. Market Drivers
- 3.2.1. Increasing Technological Advancements in the Wearables Market; Increasing Health Awareness among the Consumers
- 3.3. Market Restrains
- 3.3.1 Growing Complexity of Wearable Devices
- 3.3.2 Limited Use of Features
- 3.3.3 and Security Risks
- 3.4. Market Trends
- 3.4.1. Sports Segment to Account for Significant Market Share
- 4. Market Factor Analysis
- 4.1. Porters Five Forces
- 4.2. Supply/Value Chain
- 4.3. PESTEL analysis
- 4.4. Market Entropy
- 4.5. Patent/Trademark Analysis
- 5. Global Smartwatch Industry Analysis, Insights and Forecast, 2019-2031
- 5.1. Market Analysis, Insights and Forecast - by Operating System
- 5.1.1. Watch OS
- 5.1.2. Wear OS
- 5.1.3. Other Operating Systems
- 5.2. Market Analysis, Insights and Forecast - by Display Type
- 5.2.1. AMOLED
- 5.2.2. PMOLED
- 5.2.3. TFT LCD
- 5.3. Market Analysis, Insights and Forecast - by Application
- 5.3.1. Personal Assistance
- 5.3.2. Medical
- 5.3.3. Sports
- 5.3.4. Other Applications
- 5.4. Market Analysis, Insights and Forecast - by Region
- 5.4.1. North America: United States Canada Mexico
- 5.4.2. Europe: Germany: France: Italy: United Kingdom Netherlands Rest of Europe
- 5.4.3. Asia Pacific: China, Japan, India, South Korea, Taiwan, Australia, Rest of Asia-Pacific
- 5.4.4. South America : Brazil, Argentina, Rest of South America
- 5.4.5. MEA: Middle East, Africa
- 5.1. Market Analysis, Insights and Forecast - by Operating System
- 6. North America: United States Canada Mexico Smartwatch Industry Analysis, Insights and Forecast, 2019-2031
- 6.1. Market Analysis, Insights and Forecast - by Operating System
- 6.1.1. Watch OS
- 6.1.2. Wear OS
- 6.1.3. Other Operating Systems
- 6.2. Market Analysis, Insights and Forecast - by Display Type
- 6.2.1. AMOLED
- 6.2.2. PMOLED
- 6.2.3. TFT LCD
- 6.3. Market Analysis, Insights and Forecast - by Application
- 6.3.1. Personal Assistance
- 6.3.2. Medical
- 6.3.3. Sports
- 6.3.4. Other Applications
- 6.1. Market Analysis, Insights and Forecast - by Operating System
- 7. Europe: Germany: France: Italy: United Kingdom Netherlands Rest of Europe Smartwatch Industry Analysis, Insights and Forecast, 2019-2031
- 7.1. Market Analysis, Insights and Forecast - by Operating System
- 7.1.1. Watch OS
- 7.1.2. Wear OS
- 7.1.3. Other Operating Systems
- 7.2. Market Analysis, Insights and Forecast - by Display Type
- 7.2.1. AMOLED
- 7.2.2. PMOLED
- 7.2.3. TFT LCD
- 7.3. Market Analysis, Insights and Forecast - by Application
- 7.3.1. Personal Assistance
- 7.3.2. Medical
- 7.3.3. Sports
- 7.3.4. Other Applications
- 7.1. Market Analysis, Insights and Forecast - by Operating System
- 8. Asia Pacific: China, Japan, India, South Korea, Taiwan, Australia, Rest of Asia-Pacific Smartwatch Industry Analysis, Insights and Forecast, 2019-2031
- 8.1. Market Analysis, Insights and Forecast - by Operating System
- 8.1.1. Watch OS
- 8.1.2. Wear OS
- 8.1.3. Other Operating Systems
- 8.2. Market Analysis, Insights and Forecast - by Display Type
- 8.2.1. AMOLED
- 8.2.2. PMOLED
- 8.2.3. TFT LCD
- 8.3. Market Analysis, Insights and Forecast - by Application
- 8.3.1. Personal Assistance
- 8.3.2. Medical
- 8.3.3. Sports
- 8.3.4. Other Applications
- 8.1. Market Analysis, Insights and Forecast - by Operating System
- 9. South America : Brazil, Argentina, Rest of South America Smartwatch Industry Analysis, Insights and Forecast, 2019-2031
- 9.1. Market Analysis, Insights and Forecast - by Operating System
- 9.1.1. Watch OS
- 9.1.2. Wear OS
- 9.1.3. Other Operating Systems
- 9.2. Market Analysis, Insights and Forecast - by Display Type
- 9.2.1. AMOLED
- 9.2.2. PMOLED
- 9.2.3. TFT LCD
- 9.3. Market Analysis, Insights and Forecast - by Application
- 9.3.1. Personal Assistance
- 9.3.2. Medical
- 9.3.3. Sports
- 9.3.4. Other Applications
- 9.1. Market Analysis, Insights and Forecast - by Operating System
- 10. MEA: Middle East, Africa Smartwatch Industry Analysis, Insights and Forecast, 2019-2031
- 10.1. Market Analysis, Insights and Forecast - by Operating System
- 10.1.1. Watch OS
- 10.1.2. Wear OS
- 10.1.3. Other Operating Systems
- 10.2. Market Analysis, Insights and Forecast - by Display Type
- 10.2.1. AMOLED
- 10.2.2. PMOLED
- 10.2.3. TFT LCD
- 10.3. Market Analysis, Insights and Forecast - by Application
- 10.3.1. Personal Assistance
- 10.3.2. Medical
- 10.3.3. Sports
- 10.3.4. Other Applications
- 10.1. Market Analysis, Insights and Forecast - by Operating System
- 11. North America Smartwatch Industry Analysis, Insights and Forecast, 2019-2031
- 11.1. Market Analysis, Insights and Forecast - By Country/Sub-region
- 11.1.1.
- 12. Europe Smartwatch Industry Analysis, Insights and Forecast, 2019-2031
- 12.1. Market Analysis, Insights and Forecast - By Country/Sub-region
- 12.1.1.
- 13. Asia Pacific Smartwatch Industry Analysis, Insights and Forecast, 2019-2031
- 13.1. Market Analysis, Insights and Forecast - By Country/Sub-region
- 13.1.1.
- 14. Rest of the World Smartwatch Industry Analysis, Insights and Forecast, 2019-2031
- 14.1. Market Analysis, Insights and Forecast - By Country/Sub-region
- 14.1.1.
- 15. Competitive Analysis
- 15.1. Global Market Share Analysis 2024
- 15.2. Company Profiles
- 15.2.1 Polar Electro Oy
- 15.2.1.1. Overview
- 15.2.1.2. Products
- 15.2.1.3. SWOT Analysis
- 15.2.1.4. Recent Developments
- 15.2.1.5. Financials (Based on Availability)
- 15.2.2 LG Electronics Inc
- 15.2.2.1. Overview
- 15.2.2.2. Products
- 15.2.2.3. SWOT Analysis
- 15.2.2.4. Recent Developments
- 15.2.2.5. Financials (Based on Availability)
- 15.2.3 Lenovo Group Limited
- 15.2.3.1. Overview
- 15.2.3.2. Products
- 15.2.3.3. SWOT Analysis
- 15.2.3.4. Recent Developments
- 15.2.3.5. Financials (Based on Availability)
- 15.2.4 Casio Computer Co Ltd
- 15.2.4.1. Overview
- 15.2.4.2. Products
- 15.2.4.3. SWOT Analysis
- 15.2.4.4. Recent Developments
- 15.2.4.5. Financials (Based on Availability)
- 15.2.5 Zepp Health Corporation
- 15.2.5.1. Overview
- 15.2.5.2. Products
- 15.2.5.3. SWOT Analysis
- 15.2.5.4. Recent Developments
- 15.2.5.5. Financials (Based on Availability)
- 15.2.6 Samsung Electronics Co Ltd
- 15.2.6.1. Overview
- 15.2.6.2. Products
- 15.2.6.3. SWOT Analysis
- 15.2.6.4. Recent Developments
- 15.2.6.5. Financials (Based on Availability)
- 15.2.7 Garmin Ltd
- 15.2.7.1. Overview
- 15.2.7.2. Products
- 15.2.7.3. SWOT Analysis
- 15.2.7.4. Recent Developments
- 15.2.7.5. Financials (Based on Availability)
- 15.2.8 Fitbit Inc
- 15.2.8.1. Overview
- 15.2.8.2. Products
- 15.2.8.3. SWOT Analysis
- 15.2.8.4. Recent Developments
- 15.2.8.5. Financials (Based on Availability)
- 15.2.9 Huawei Technologies Co Ltd
- 15.2.9.1. Overview
- 15.2.9.2. Products
- 15.2.9.3. SWOT Analysis
- 15.2.9.4. Recent Developments
- 15.2.9.5. Financials (Based on Availability)
- 15.2.10 Fossil Group Inc
- 15.2.10.1. Overview
- 15.2.10.2. Products
- 15.2.10.3. SWOT Analysis
- 15.2.10.4. Recent Developments
- 15.2.10.5. Financials (Based on Availability)
- 15.2.11 Apple Inc
- 15.2.11.1. Overview
- 15.2.11.2. Products
- 15.2.11.3. SWOT Analysis
- 15.2.11.4. Recent Developments
- 15.2.11.5. Financials (Based on Availability)
- 15.2.12 Sony Corporation
- 15.2.12.1. Overview
- 15.2.12.2. Products
- 15.2.12.3. SWOT Analysis
- 15.2.12.4. Recent Developments
- 15.2.12.5. Financials (Based on Availability)
- 15.2.1 Polar Electro Oy
List of Figures
- Figure 1: Global Smartwatch Industry Revenue Breakdown (Million, %) by Region 2024 & 2032
- Figure 2: Global Smartwatch Industry Volume Breakdown (Million, %) by Region 2024 & 2032
- Figure 3: North America Smartwatch Industry Revenue (Million), by Country 2024 & 2032
- Figure 4: North America Smartwatch Industry Volume (Million), by Country 2024 & 2032
- Figure 5: North America Smartwatch Industry Revenue Share (%), by Country 2024 & 2032
- Figure 6: North America Smartwatch Industry Volume Share (%), by Country 2024 & 2032
- Figure 7: Europe Smartwatch Industry Revenue (Million), by Country 2024 & 2032
- Figure 8: Europe Smartwatch Industry Volume (Million), by Country 2024 & 2032
- Figure 9: Europe Smartwatch Industry Revenue Share (%), by Country 2024 & 2032
- Figure 10: Europe Smartwatch Industry Volume Share (%), by Country 2024 & 2032
- Figure 11: Asia Pacific Smartwatch Industry Revenue (Million), by Country 2024 & 2032
- Figure 12: Asia Pacific Smartwatch Industry Volume (Million), by Country 2024 & 2032
- Figure 13: Asia Pacific Smartwatch Industry Revenue Share (%), by Country 2024 & 2032
- Figure 14: Asia Pacific Smartwatch Industry Volume Share (%), by Country 2024 & 2032
- Figure 15: Rest of the World Smartwatch Industry Revenue (Million), by Country 2024 & 2032
- Figure 16: Rest of the World Smartwatch Industry Volume (Million), by Country 2024 & 2032
- Figure 17: Rest of the World Smartwatch Industry Revenue Share (%), by Country 2024 & 2032
- Figure 18: Rest of the World Smartwatch Industry Volume Share (%), by Country 2024 & 2032
- Figure 19: North America: United States Canada Mexico Smartwatch Industry Revenue (Million), by Operating System 2024 & 2032
- Figure 20: North America: United States Canada Mexico Smartwatch Industry Volume (Million), by Operating System 2024 & 2032
- Figure 21: North America: United States Canada Mexico Smartwatch Industry Revenue Share (%), by Operating System 2024 & 2032
- Figure 22: North America: United States Canada Mexico Smartwatch Industry Volume Share (%), by Operating System 2024 & 2032
- Figure 23: North America: United States Canada Mexico Smartwatch Industry Revenue (Million), by Display Type 2024 & 2032
- Figure 24: North America: United States Canada Mexico Smartwatch Industry Volume (Million), by Display Type 2024 & 2032
- Figure 25: North America: United States Canada Mexico Smartwatch Industry Revenue Share (%), by Display Type 2024 & 2032
- Figure 26: North America: United States Canada Mexico Smartwatch Industry Volume Share (%), by Display Type 2024 & 2032
- Figure 27: North America: United States Canada Mexico Smartwatch Industry Revenue (Million), by Application 2024 & 2032
- Figure 28: North America: United States Canada Mexico Smartwatch Industry Volume (Million), by Application 2024 & 2032
- Figure 29: North America: United States Canada Mexico Smartwatch Industry Revenue Share (%), by Application 2024 & 2032
- Figure 30: North America: United States Canada Mexico Smartwatch Industry Volume Share (%), by Application 2024 & 2032
- Figure 31: North America: United States Canada Mexico Smartwatch Industry Revenue (Million), by Country 2024 & 2032
- Figure 32: North America: United States Canada Mexico Smartwatch Industry Volume (Million), by Country 2024 & 2032
- Figure 33: North America: United States Canada Mexico Smartwatch Industry Revenue Share (%), by Country 2024 & 2032
- Figure 34: North America: United States Canada Mexico Smartwatch Industry Volume Share (%), by Country 2024 & 2032
- Figure 35: Europe: Germany: France: Italy: United Kingdom Netherlands Rest of Europe Smartwatch Industry Revenue (Million), by Operating System 2024 & 2032
- Figure 36: Europe: Germany: France: Italy: United Kingdom Netherlands Rest of Europe Smartwatch Industry Volume (Million), by Operating System 2024 & 2032
- Figure 37: Europe: Germany: France: Italy: United Kingdom Netherlands Rest of Europe Smartwatch Industry Revenue Share (%), by Operating System 2024 & 2032
- Figure 38: Europe: Germany: France: Italy: United Kingdom Netherlands Rest of Europe Smartwatch Industry Volume Share (%), by Operating System 2024 & 2032
- Figure 39: Europe: Germany: France: Italy: United Kingdom Netherlands Rest of Europe Smartwatch Industry Revenue (Million), by Display Type 2024 & 2032
- Figure 40: Europe: Germany: France: Italy: United Kingdom Netherlands Rest of Europe Smartwatch Industry Volume (Million), by Display Type 2024 & 2032
- Figure 41: Europe: Germany: France: Italy: United Kingdom Netherlands Rest of Europe Smartwatch Industry Revenue Share (%), by Display Type 2024 & 2032
- Figure 42: Europe: Germany: France: Italy: United Kingdom Netherlands Rest of Europe Smartwatch Industry Volume Share (%), by Display Type 2024 & 2032
- Figure 43: Europe: Germany: France: Italy: United Kingdom Netherlands Rest of Europe Smartwatch Industry Revenue (Million), by Application 2024 & 2032
- Figure 44: Europe: Germany: France: Italy: United Kingdom Netherlands Rest of Europe Smartwatch Industry Volume (Million), by Application 2024 & 2032
- Figure 45: Europe: Germany: France: Italy: United Kingdom Netherlands Rest of Europe Smartwatch Industry Revenue Share (%), by Application 2024 & 2032
- Figure 46: Europe: Germany: France: Italy: United Kingdom Netherlands Rest of Europe Smartwatch Industry Volume Share (%), by Application 2024 & 2032
- Figure 47: Europe: Germany: France: Italy: United Kingdom Netherlands Rest of Europe Smartwatch Industry Revenue (Million), by Country 2024 & 2032
- Figure 48: Europe: Germany: France: Italy: United Kingdom Netherlands Rest of Europe Smartwatch Industry Volume (Million), by Country 2024 & 2032
- Figure 49: Europe: Germany: France: Italy: United Kingdom Netherlands Rest of Europe Smartwatch Industry Revenue Share (%), by Country 2024 & 2032
- Figure 50: Europe: Germany: France: Italy: United Kingdom Netherlands Rest of Europe Smartwatch Industry Volume Share (%), by Country 2024 & 2032
- Figure 51: Asia Pacific: China, Japan, India, South Korea, Taiwan, Australia, Rest of Asia-Pacific Smartwatch Industry Revenue (Million), by Operating System 2024 & 2032
- Figure 52: Asia Pacific: China, Japan, India, South Korea, Taiwan, Australia, Rest of Asia-Pacific Smartwatch Industry Volume (Million), by Operating System 2024 & 2032
- Figure 53: Asia Pacific: China, Japan, India, South Korea, Taiwan, Australia, Rest of Asia-Pacific Smartwatch Industry Revenue Share (%), by Operating System 2024 & 2032
- Figure 54: Asia Pacific: China, Japan, India, South Korea, Taiwan, Australia, Rest of Asia-Pacific Smartwatch Industry Volume Share (%), by Operating System 2024 & 2032
- Figure 55: Asia Pacific: China, Japan, India, South Korea, Taiwan, Australia, Rest of Asia-Pacific Smartwatch Industry Revenue (Million), by Display Type 2024 & 2032
- Figure 56: Asia Pacific: China, Japan, India, South Korea, Taiwan, Australia, Rest of Asia-Pacific Smartwatch Industry Volume (Million), by Display Type 2024 & 2032
- Figure 57: Asia Pacific: China, Japan, India, South Korea, Taiwan, Australia, Rest of Asia-Pacific Smartwatch Industry Revenue Share (%), by Display Type 2024 & 2032
- Figure 58: Asia Pacific: China, Japan, India, South Korea, Taiwan, Australia, Rest of Asia-Pacific Smartwatch Industry Volume Share (%), by Display Type 2024 & 2032
- Figure 59: Asia Pacific: China, Japan, India, South Korea, Taiwan, Australia, Rest of Asia-Pacific Smartwatch Industry Revenue (Million), by Application 2024 & 2032
- Figure 60: Asia Pacific: China, Japan, India, South Korea, Taiwan, Australia, Rest of Asia-Pacific Smartwatch Industry Volume (Million), by Application 2024 & 2032
- Figure 61: Asia Pacific: China, Japan, India, South Korea, Taiwan, Australia, Rest of Asia-Pacific Smartwatch Industry Revenue Share (%), by Application 2024 & 2032
- Figure 62: Asia Pacific: China, Japan, India, South Korea, Taiwan, Australia, Rest of Asia-Pacific Smartwatch Industry Volume Share (%), by Application 2024 & 2032
- Figure 63: Asia Pacific: China, Japan, India, South Korea, Taiwan, Australia, Rest of Asia-Pacific Smartwatch Industry Revenue (Million), by Country 2024 & 2032
- Figure 64: Asia Pacific: China, Japan, India, South Korea, Taiwan, Australia, Rest of Asia-Pacific Smartwatch Industry Volume (Million), by Country 2024 & 2032
- Figure 65: Asia Pacific: China, Japan, India, South Korea, Taiwan, Australia, Rest of Asia-Pacific Smartwatch Industry Revenue Share (%), by Country 2024 & 2032
- Figure 66: Asia Pacific: China, Japan, India, South Korea, Taiwan, Australia, Rest of Asia-Pacific Smartwatch Industry Volume Share (%), by Country 2024 & 2032
- Figure 67: South America : Brazil, Argentina, Rest of South America Smartwatch Industry Revenue (Million), by Operating System 2024 & 2032
- Figure 68: South America : Brazil, Argentina, Rest of South America Smartwatch Industry Volume (Million), by Operating System 2024 & 2032
- Figure 69: South America : Brazil, Argentina, Rest of South America Smartwatch Industry Revenue Share (%), by Operating System 2024 & 2032
- Figure 70: South America : Brazil, Argentina, Rest of South America Smartwatch Industry Volume Share (%), by Operating System 2024 & 2032
- Figure 71: South America : Brazil, Argentina, Rest of South America Smartwatch Industry Revenue (Million), by Display Type 2024 & 2032
- Figure 72: South America : Brazil, Argentina, Rest of South America Smartwatch Industry Volume (Million), by Display Type 2024 & 2032
- Figure 73: South America : Brazil, Argentina, Rest of South America Smartwatch Industry Revenue Share (%), by Display Type 2024 & 2032
- Figure 74: South America : Brazil, Argentina, Rest of South America Smartwatch Industry Volume Share (%), by Display Type 2024 & 2032
- Figure 75: South America : Brazil, Argentina, Rest of South America Smartwatch Industry Revenue (Million), by Application 2024 & 2032
- Figure 76: South America : Brazil, Argentina, Rest of South America Smartwatch Industry Volume (Million), by Application 2024 & 2032
- Figure 77: South America : Brazil, Argentina, Rest of South America Smartwatch Industry Revenue Share (%), by Application 2024 & 2032
- Figure 78: South America : Brazil, Argentina, Rest of South America Smartwatch Industry Volume Share (%), by Application 2024 & 2032
- Figure 79: South America : Brazil, Argentina, Rest of South America Smartwatch Industry Revenue (Million), by Country 2024 & 2032
- Figure 80: South America : Brazil, Argentina, Rest of South America Smartwatch Industry Volume (Million), by Country 2024 & 2032
- Figure 81: South America : Brazil, Argentina, Rest of South America Smartwatch Industry Revenue Share (%), by Country 2024 & 2032
- Figure 82: South America : Brazil, Argentina, Rest of South America Smartwatch Industry Volume Share (%), by Country 2024 & 2032
- Figure 83: MEA: Middle East, Africa Smartwatch Industry Revenue (Million), by Operating System 2024 & 2032
- Figure 84: MEA: Middle East, Africa Smartwatch Industry Volume (Million), by Operating System 2024 & 2032
- Figure 85: MEA: Middle East, Africa Smartwatch Industry Revenue Share (%), by Operating System 2024 & 2032
- Figure 86: MEA: Middle East, Africa Smartwatch Industry Volume Share (%), by Operating System 2024 & 2032
- Figure 87: MEA: Middle East, Africa Smartwatch Industry Revenue (Million), by Display Type 2024 & 2032
- Figure 88: MEA: Middle East, Africa Smartwatch Industry Volume (Million), by Display Type 2024 & 2032
- Figure 89: MEA: Middle East, Africa Smartwatch Industry Revenue Share (%), by Display Type 2024 & 2032
- Figure 90: MEA: Middle East, Africa Smartwatch Industry Volume Share (%), by Display Type 2024 & 2032
- Figure 91: MEA: Middle East, Africa Smartwatch Industry Revenue (Million), by Application 2024 & 2032
- Figure 92: MEA: Middle East, Africa Smartwatch Industry Volume (Million), by Application 2024 & 2032
- Figure 93: MEA: Middle East, Africa Smartwatch Industry Revenue Share (%), by Application 2024 & 2032
- Figure 94: MEA: Middle East, Africa Smartwatch Industry Volume Share (%), by Application 2024 & 2032
- Figure 95: MEA: Middle East, Africa Smartwatch Industry Revenue (Million), by Country 2024 & 2032
- Figure 96: MEA: Middle East, Africa Smartwatch Industry Volume (Million), by Country 2024 & 2032
- Figure 97: MEA: Middle East, Africa Smartwatch Industry Revenue Share (%), by Country 2024 & 2032
- Figure 98: MEA: Middle East, Africa Smartwatch Industry Volume Share (%), by Country 2024 & 2032
List of Tables
- Table 1: Global Smartwatch Industry Revenue Million Forecast, by Region 2019 & 2032
- Table 2: Global Smartwatch Industry Volume Million Forecast, by Region 2019 & 2032
- Table 3: Global Smartwatch Industry Revenue Million Forecast, by Operating System 2019 & 2032
- Table 4: Global Smartwatch Industry Volume Million Forecast, by Operating System 2019 & 2032
- Table 5: Global Smartwatch Industry Revenue Million Forecast, by Display Type 2019 & 2032
- Table 6: Global Smartwatch Industry Volume Million Forecast, by Display Type 2019 & 2032
- Table 7: Global Smartwatch Industry Revenue Million Forecast, by Application 2019 & 2032
- Table 8: Global Smartwatch Industry Volume Million Forecast, by Application 2019 & 2032
- Table 9: Global Smartwatch Industry Revenue Million Forecast, by Region 2019 & 2032
- Table 10: Global Smartwatch Industry Volume Million Forecast, by Region 2019 & 2032
- Table 11: Global Smartwatch Industry Revenue Million Forecast, by Country 2019 & 2032
- Table 12: Global Smartwatch Industry Volume Million Forecast, by Country 2019 & 2032
- Table 13: Smartwatch Industry Revenue (Million) Forecast, by Application 2019 & 2032
- Table 14: Smartwatch Industry Volume (Million) Forecast, by Application 2019 & 2032
- Table 15: Global Smartwatch Industry Revenue Million Forecast, by Country 2019 & 2032
- Table 16: Global Smartwatch Industry Volume Million Forecast, by Country 2019 & 2032
- Table 17: Smartwatch Industry Revenue (Million) Forecast, by Application 2019 & 2032
- Table 18: Smartwatch Industry Volume (Million) Forecast, by Application 2019 & 2032
- Table 19: Global Smartwatch Industry Revenue Million Forecast, by Country 2019 & 2032
- Table 20: Global Smartwatch Industry Volume Million Forecast, by Country 2019 & 2032
- Table 21: Smartwatch Industry Revenue (Million) Forecast, by Application 2019 & 2032
- Table 22: Smartwatch Industry Volume (Million) Forecast, by Application 2019 & 2032
- Table 23: Global Smartwatch Industry Revenue Million Forecast, by Country 2019 & 2032
- Table 24: Global Smartwatch Industry Volume Million Forecast, by Country 2019 & 2032
- Table 25: Smartwatch Industry Revenue (Million) Forecast, by Application 2019 & 2032
- Table 26: Smartwatch Industry Volume (Million) Forecast, by Application 2019 & 2032
- Table 27: Global Smartwatch Industry Revenue Million Forecast, by Operating System 2019 & 2032
- Table 28: Global Smartwatch Industry Volume Million Forecast, by Operating System 2019 & 2032
- Table 29: Global Smartwatch Industry Revenue Million Forecast, by Display Type 2019 & 2032
- Table 30: Global Smartwatch Industry Volume Million Forecast, by Display Type 2019 & 2032
- Table 31: Global Smartwatch Industry Revenue Million Forecast, by Application 2019 & 2032
- Table 32: Global Smartwatch Industry Volume Million Forecast, by Application 2019 & 2032
- Table 33: Global Smartwatch Industry Revenue Million Forecast, by Country 2019 & 2032
- Table 34: Global Smartwatch Industry Volume Million Forecast, by Country 2019 & 2032
- Table 35: Global Smartwatch Industry Revenue Million Forecast, by Operating System 2019 & 2032
- Table 36: Global Smartwatch Industry Volume Million Forecast, by Operating System 2019 & 2032
- Table 37: Global Smartwatch Industry Revenue Million Forecast, by Display Type 2019 & 2032
- Table 38: Global Smartwatch Industry Volume Million Forecast, by Display Type 2019 & 2032
- Table 39: Global Smartwatch Industry Revenue Million Forecast, by Application 2019 & 2032
- Table 40: Global Smartwatch Industry Volume Million Forecast, by Application 2019 & 2032
- Table 41: Global Smartwatch Industry Revenue Million Forecast, by Country 2019 & 2032
- Table 42: Global Smartwatch Industry Volume Million Forecast, by Country 2019 & 2032
- Table 43: Global Smartwatch Industry Revenue Million Forecast, by Operating System 2019 & 2032
- Table 44: Global Smartwatch Industry Volume Million Forecast, by Operating System 2019 & 2032
- Table 45: Global Smartwatch Industry Revenue Million Forecast, by Display Type 2019 & 2032
- Table 46: Global Smartwatch Industry Volume Million Forecast, by Display Type 2019 & 2032
- Table 47: Global Smartwatch Industry Revenue Million Forecast, by Application 2019 & 2032
- Table 48: Global Smartwatch Industry Volume Million Forecast, by Application 2019 & 2032
- Table 49: Global Smartwatch Industry Revenue Million Forecast, by Country 2019 & 2032
- Table 50: Global Smartwatch Industry Volume Million Forecast, by Country 2019 & 2032
- Table 51: Global Smartwatch Industry Revenue Million Forecast, by Operating System 2019 & 2032
- Table 52: Global Smartwatch Industry Volume Million Forecast, by Operating System 2019 & 2032
- Table 53: Global Smartwatch Industry Revenue Million Forecast, by Display Type 2019 & 2032
- Table 54: Global Smartwatch Industry Volume Million Forecast, by Display Type 2019 & 2032
- Table 55: Global Smartwatch Industry Revenue Million Forecast, by Application 2019 & 2032
- Table 56: Global Smartwatch Industry Volume Million Forecast, by Application 2019 & 2032
- Table 57: Global Smartwatch Industry Revenue Million Forecast, by Country 2019 & 2032
- Table 58: Global Smartwatch Industry Volume Million Forecast, by Country 2019 & 2032
- Table 59: Global Smartwatch Industry Revenue Million Forecast, by Operating System 2019 & 2032
- Table 60: Global Smartwatch Industry Volume Million Forecast, by Operating System 2019 & 2032
- Table 61: Global Smartwatch Industry Revenue Million Forecast, by Display Type 2019 & 2032
- Table 62: Global Smartwatch Industry Volume Million Forecast, by Display Type 2019 & 2032
- Table 63: Global Smartwatch Industry Revenue Million Forecast, by Application 2019 & 2032
- Table 64: Global Smartwatch Industry Volume Million Forecast, by Application 2019 & 2032
- Table 65: Global Smartwatch Industry Revenue Million Forecast, by Country 2019 & 2032
- Table 66: Global Smartwatch Industry Volume Million Forecast, by Country 2019 & 2032
Frequently Asked Questions
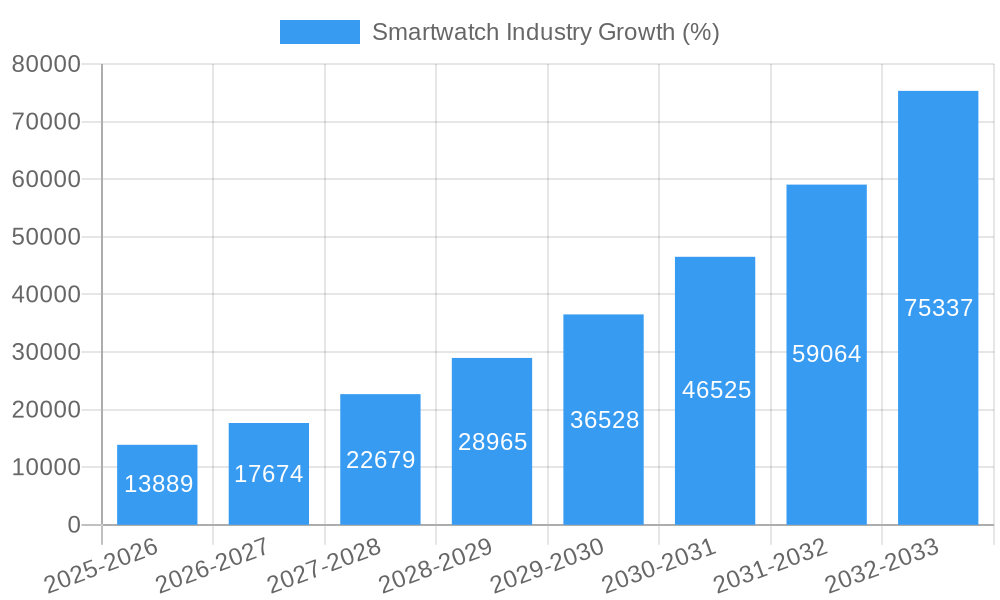
1. What is the projected Compound Annual Growth Rate (CAGR) of the Smartwatch Industry?
The projected CAGR is approximately 27.78%.
2. Which companies are prominent players in the Smartwatch Industry?
Key companies in the market include Polar Electro Oy, LG Electronics Inc, Lenovo Group Limited, Casio Computer Co Ltd, Zepp Health Corporation, Samsung Electronics Co Ltd, Garmin Ltd, Fitbit Inc, Huawei Technologies Co Ltd, Fossil Group Inc, Apple Inc, Sony Corporation.
3. What are the main segments of the Smartwatch Industry?
The market segments include Operating System, Display Type, Application.
4. Can you provide details about the market size?
The market size is estimated to be USD XX Million as of 2022.
5. What are some drivers contributing to market growth?
Increasing Technological Advancements in the Wearables Market; Increasing Health Awareness among the Consumers.
6. What are the notable trends driving market growth?
Sports Segment to Account for Significant Market Share.
7. Are there any restraints impacting market growth?
Growing Complexity of Wearable Devices. Limited Use of Features. and Security Risks.
8. Can you provide examples of recent developments in the market?
June 2022 - Apple previewed watch OS 9, which brings the latest features and improved experiences to the wearable operating system. Apple Watch users can now have more watch faces to choose from, with richer complications that offer more information and opportunity for personalization. In the updated Workout app, advanced metrics, views, and training experiences inspired by high-performing athletes help users take their workouts to the next level.
9. What pricing options are available for accessing the report?
Pricing options include single-user, multi-user, and enterprise licenses priced at USD 3800, USD 4500, and USD 5800 respectively.
10. Is the market size provided in terms of value or volume?
The market size is provided in terms of value, measured in Million and volume, measured in Million.
11. Are there any specific market keywords associated with the report?
Yes, the market keyword associated with the report is "Smartwatch Industry," which aids in identifying and referencing the specific market segment covered.
12. How do I determine which pricing option suits my needs best?
The pricing options vary based on user requirements and access needs. Individual users may opt for single-user licenses, while businesses requiring broader access may choose multi-user or enterprise licenses for cost-effective access to the report.
13. Are there any additional resources or data provided in the Smartwatch Industry report?
While the report offers comprehensive insights, it's advisable to review the specific contents or supplementary materials provided to ascertain if additional resources or data are available.
14. How can I stay updated on further developments or reports in the Smartwatch Industry?
To stay informed about further developments, trends, and reports in the Smartwatch Industry, consider subscribing to industry newsletters, following relevant companies and organizations, or regularly checking reputable industry news sources and publications.
Methodology
Step 1 - Identification of Relevant Samples Size from Population Database


Step 2 - Approaches for Defining Global Market Size (Value, Volume* & Price*)

Note*: In applicable scenarios
Step 3 - Data Sources
Primary Research
- Web Analytics
- Survey Reports
- Research Institute
- Latest Research Reports
- Opinion Leaders
Secondary Research
- Annual Reports
- White Paper
- Latest Press Release
- Industry Association
- Paid Database
- Investor Presentations

Step 4 - Data Triangulation
Involves using different sources of information in order to increase the validity of a study
These sources are likely to be stakeholders in a program - participants, other researchers, program staff, other community members, and so on.
Then we put all data in single framework & apply various statistical tools to find out the dynamic on the market.
During the analysis stage, feedback from the stakeholder groups would be compared to determine areas of agreement as well as areas of divergence


