
Key Insights
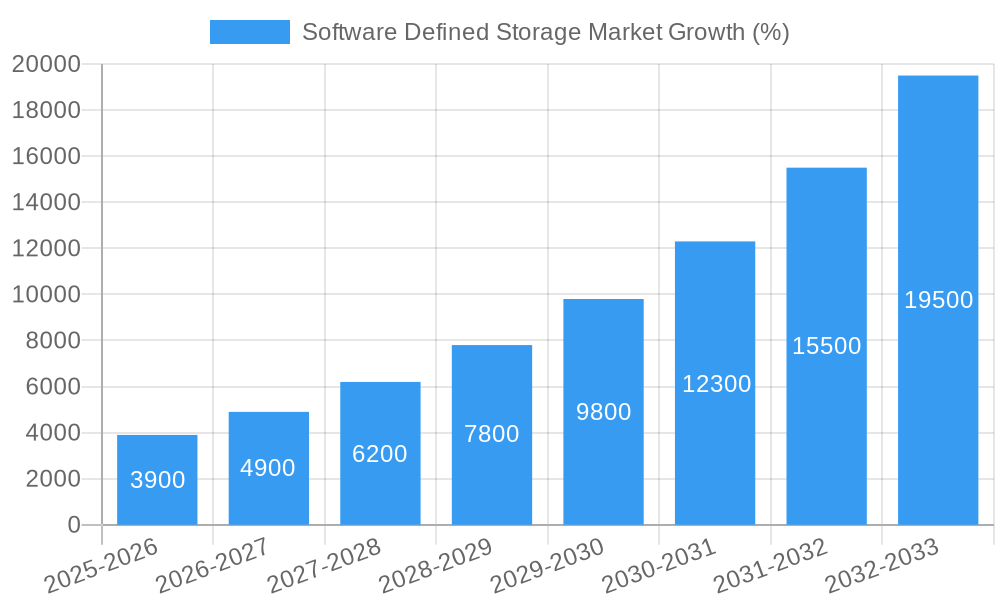
The Software Defined Storage (SDS) market is experiencing robust growth, driven by the increasing adoption of cloud computing, big data analytics, and the need for flexible, scalable storage solutions. The market's Compound Annual Growth Rate (CAGR) of 25.80% from 2019 to 2024 indicates a significant upward trajectory. This growth is fueled by several key factors. Firstly, the shift towards virtualization and the desire for centralized management of storage resources are major drivers. Secondly, the cost-effectiveness and scalability offered by SDS solutions compared to traditional storage systems are attracting businesses of all sizes. The diverse range of deployment models—including block, file, object, and hyper-converged infrastructure— caters to various enterprise needs and workloads. Furthermore, industries like BFSI (Banking, Financial Services, and Insurance), Telecom & IT, and Government are increasingly adopting SDS to manage their expanding data volumes and enhance security. However, the market faces challenges including complexities in implementation, security concerns related to data management in virtualized environments, and the need for skilled professionals to manage these systems effectively.
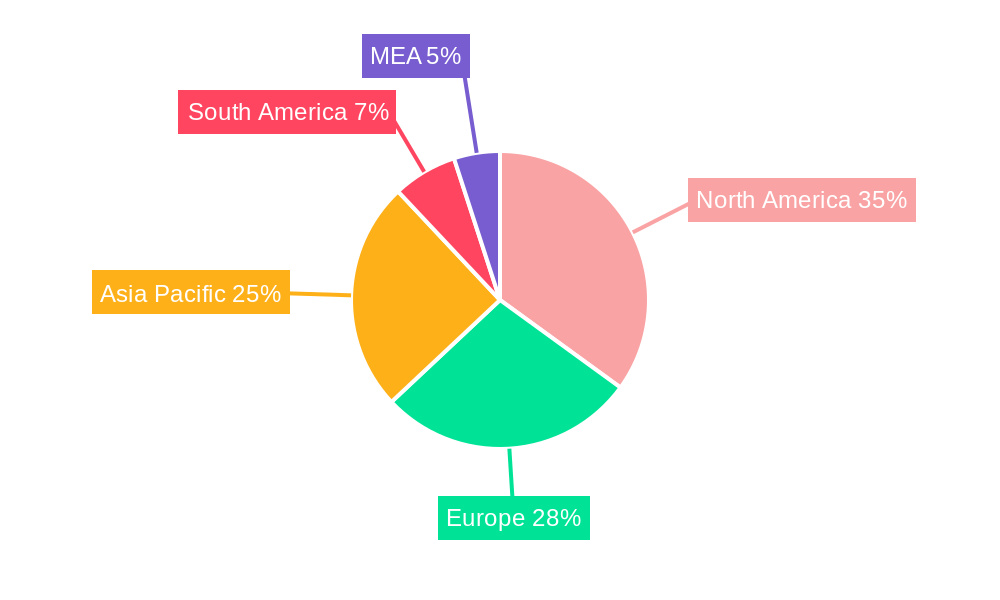
Despite these restraints, the market’s future outlook remains positive. The continued growth of cloud computing and the increasing demand for data-driven insights will further fuel the adoption of SDS solutions. The market segmentation by enterprise size (small and medium enterprises, large enterprises) and end-user industry reveals diverse growth opportunities. While large enterprises currently dominate the market, the growing digital transformation initiatives within SMEs are expected to contribute significantly to future growth. Leading vendors like IBM, NetApp, Dell (VMware), and Pure Storage are actively innovating and expanding their SDS offerings to capitalize on these trends. Geographically, North America and Europe are currently leading the market, but the Asia-Pacific region is anticipated to witness significant growth driven by rapid technological advancements and increasing digitalization in countries like China and India. The projected market size for 2025 provides a strong baseline for future growth projections, extending the forecast period through 2033.
Software Defined Storage Market Report: 2019-2033 Forecast
This comprehensive report provides a detailed analysis of the Software Defined Storage (SDS) market, offering invaluable insights for industry professionals, investors, and strategic decision-makers. The report covers the period 2019-2033, with a focus on the 2025-2033 forecast period. It leverages extensive market research, including analysis of key players, market segmentation, and emerging trends, to provide a complete understanding of this dynamic market. The market is expected to reach xx Million by 2033, exhibiting a robust CAGR of xx% during the forecast period.
Software Defined Storage Market Structure & Innovation Trends
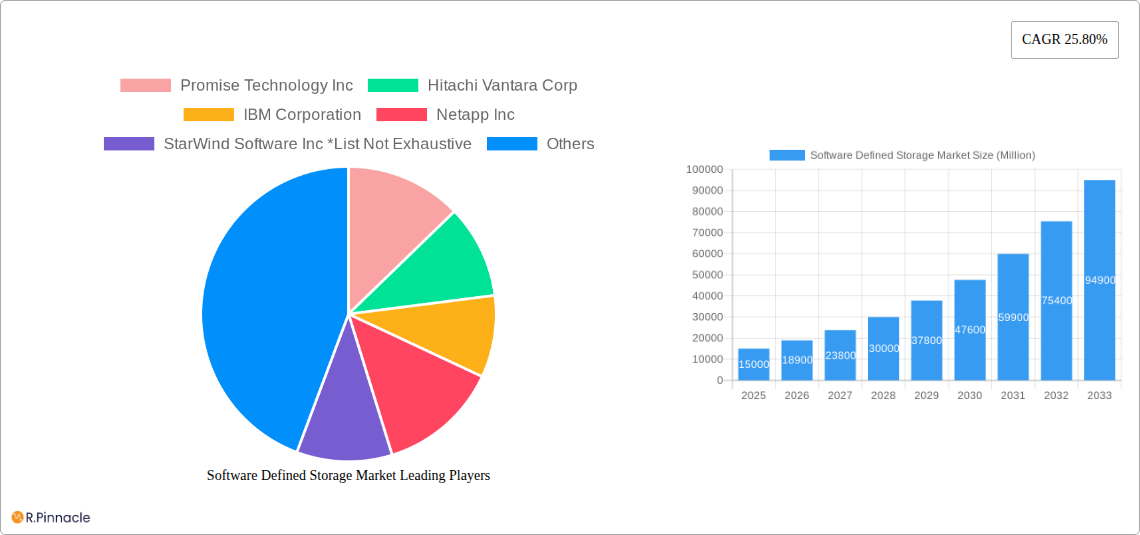
The Software Defined Storage market exhibits a moderately concentrated structure, with several major players holding significant market share. Key players such as Promise Technology Inc, Hitachi Vantara Corp, IBM Corporation, Netapp Inc, and StarWind Software Inc contribute substantially to the overall market volume. However, numerous smaller players and emerging companies actively participate, fostering competition and innovation. Market share data for 2024 indicates that the top 5 players collectively hold approximately xx% of the market share.
- Innovation Drivers: The rising demand for scalable, flexible, and cost-effective storage solutions fuels innovation in SDS. Cloud adoption, big data analytics, and the proliferation of IoT devices are key drivers.
- Regulatory Frameworks: Data privacy regulations and compliance standards influence the adoption of SDS solutions, particularly in sectors like BFSI and government.
- Product Substitutes: Traditional storage arrays remain a significant substitute, but SDS's agility and cost-effectiveness pose a growing challenge.
- End-User Demographics: Large enterprises, particularly in the Telecom and IT sector, are currently the dominant adopters of SDS, owing to their extensive data management needs. However, SME adoption is growing steadily.
- M&A Activities: Recent mergers and acquisitions, such as Nvidia's acquisition of Excelero in March 2022 (valued at xx Million), signal the growing importance of SDS in the broader technology landscape. These deals reflect a strategic push to incorporate SDS capabilities into broader technology platforms and services. The total value of M&A deals in the SDS market from 2019-2024 was approximately xx Million.
Software Defined Storage Market Dynamics & Trends
The SDS market is experiencing significant growth driven by several key factors. The increasing volume of unstructured data generated by various sources, coupled with the rising demand for cloud-based storage solutions, is a primary driver. The global shift towards digital transformation and the adoption of virtualization technologies is fueling the demand for flexible and scalable storage solutions. Furthermore, the declining cost of storage hardware and the increasing availability of high-bandwidth networks facilitate the wider adoption of SDS.
The market is characterized by a strong emphasis on software-defined features such as scalability, automation, and ease of management. This focus on software-defined capabilities is driving market penetration, with a significant increase in adoption across various industry verticals. The market penetration rate for SDS solutions increased from xx% in 2019 to an estimated xx% in 2024. The Compound Annual Growth Rate (CAGR) is projected to remain strong at xx% throughout the forecast period. Technological advancements, such as NVMe-over-Fabrics (NVMe-oF) and advancements in AI-driven storage management, further enhance the capabilities and appeal of SDS solutions. Competitive dynamics are intense, with major players focusing on innovation, partnerships, and strategic acquisitions to maintain their market position.
Dominant Regions & Segments in Software Defined Storage Market
The North American region currently holds the largest market share in the SDS market, driven by high adoption rates in the US. This dominance is attributed to factors such as:
- Strong technological advancements and innovation: North America is a global leader in technology innovation, leading to earlier adoption of SDS solutions.
- High IT spending: The region consistently has high IT spending, enabling investments in cutting-edge technologies like SDS.
- Well-established IT infrastructure: Robust infrastructure supports the widespread deployment and implementation of SDS solutions.
Other regions, such as Europe and Asia-Pacific, are exhibiting significant growth potential, driven by increasing digitalization and the expanding adoption of cloud services.
- By Type: The Block storage segment holds the largest market share, followed by File and Object storage. The Hyper-converged Infrastructure segment is experiencing the fastest growth.
- By Size of Enterprise: Large Enterprises dominate the market share currently, but the SME segment is demonstrating rapid growth.
- By End-user Industries: The BFSI and Telecom & IT sectors are the key adopters of SDS solutions, driven by stringent data management requirements and regulations. However, the Government sector is experiencing significant growth.
Software Defined Storage Market Product Innovations
Recent product innovations focus on enhanced scalability, improved performance, and seamless integration with cloud environments. Advances in NVMe-oF technology and AI-powered storage management are key features. The market is also witnessing the emergence of software-defined storage solutions optimized for specific workloads, such as high-performance computing (HPC) and artificial intelligence (AI). These specialized solutions offer competitive advantages by providing optimized performance and efficiency for specific applications. The integration of SDS with cloud-native platforms and services is also a major area of focus.
Report Scope & Segmentation Analysis
This report provides a detailed analysis of the SDS market, segmented by:
- By Type: Block, File, Object, Hyper-converged Infrastructure. Each segment's market size, growth projections, and competitive dynamics are analyzed.
- By Size of Enterprise: Small and Medium Enterprise (SME) and Large Enterprise. Growth projections and competitive landscapes vary significantly between these segments.
- By End-user Industries: BFSI, Telecom and IT, Government, and Other End-user Industries. Each industry's unique requirements and adoption rates are discussed in detail.
Key Drivers of Software Defined Storage Market Growth
Several factors drive the growth of the SDS market. These include:
- Growing data volumes: The exponential growth of data necessitates scalable and cost-effective storage solutions.
- Cloud adoption: The increasing migration to cloud environments drives the demand for flexible and scalable SDS solutions.
- Rise of big data analytics: SDS provides the necessary infrastructure for handling large volumes of data for analytics.
Challenges in the Software Defined Storage Market Sector
The SDS market faces challenges such as:
- Data security and privacy concerns: Ensuring data security and compliance with regulatory requirements is crucial.
- Integration complexity: Integrating SDS with existing IT infrastructure can be complex and require specialized skills.
- Vendor lock-in: Choosing a vendor with a proprietary solution can lead to vendor lock-in.
Emerging Opportunities in Software Defined Storage Market
Emerging opportunities include:
- Edge computing: SDS solutions are crucial for edge computing deployments due to their scalability and flexibility.
- AI-powered storage management: Artificial intelligence can significantly improve the efficiency and performance of SDS systems.
- New industry verticals: SDS adoption is expanding into new industry sectors beyond the traditional IT and BFSI.
Leading Players in the Software Defined Storage Market Market
- Promise Technology Inc
- Hitachi Vantara Corp
- IBM Corporation
- Netapp Inc
- StarWind Software Inc
- Genetec Inc
- Fujitsu Limited
- Huawei Technologies Co Ltd
- Oracle Corporation
- VMware Inc (Dell Inc)
- Pure Storage Inc
- FalconStor Software Inc
Key Developments in Software Defined Storage Market Industry
- March 2022: Nvidia acquired Excelero, expanding its SDS portfolio.
- October 2021: Exxact Corporation and SoftIron partnered to simplify SDS solutions.
Future Outlook for Software Defined Storage Market Market
The SDS market is poised for continued growth, driven by technological advancements, increasing data volumes, and wider cloud adoption. The focus on software-defined capabilities, along with the integration of AI and machine learning, will further enhance the appeal and utility of SDS solutions. Strategic partnerships and acquisitions will continue to shape the market landscape, driving innovation and expanding the reach of SDS technologies across various industry sectors.
Software Defined Storage Market Segmentation
-
1. Type
- 1.1. Block
- 1.2. File
- 1.3. Object
- 1.4. Hyper-converged Infrastructure
-
2. Size of Enterprise
- 2.1. Small and Medium Enterprise
- 2.2. Large Enterprise
-
3. End-user Industries
- 3.1. BFSI
- 3.2. Telecom and IT
- 3.3. Government
- 3.4. Other End-user Industries
Software Defined Storage Market Segmentation By Geography
- 1. North America
- 2. Europe
- 3. Asia
- 4. Latin America
- 5. Middle East and Africa
Software Defined Storage Market REPORT HIGHLIGHTS
| Aspects | Details |
|---|---|
| Study Period | 2019-2033 |
| Base Year | 2024 |
| Estimated Year | 2025 |
| Forecast Period | 2025-2033 |
| Historical Period | 2019-2024 |
| Growth Rate | CAGR of 25.80% from 2019-2033 |
| Segmentation |
|
Table of Contents
- 1. Introduction
- 1.1. Research Scope
- 1.2. Market Segmentation
- 1.3. Research Methodology
- 1.4. Definitions and Assumptions
- 2. Executive Summary
- 2.1. Introduction
- 3. Market Dynamics
- 3.1. Introduction
- 3.2. Market Drivers
- 3.2.1. Rapidly Growing Volume of Data Across Enterprises; Increased Demand for Industrial Mobility for Remotely Managing the Process Industry
- 3.3. Market Restrains
- 3.3.1. Lack of Security Awareness in Virtualization Environment; Industry Standard Deficiency
- 3.4. Market Trends
- 3.4.1. BFSI Sector to Witness Significant Growth
- 4. Market Factor Analysis
- 4.1. Porters Five Forces
- 4.2. Supply/Value Chain
- 4.3. PESTEL analysis
- 4.4. Market Entropy
- 4.5. Patent/Trademark Analysis
- 5. Global Software Defined Storage Market Analysis, Insights and Forecast, 2019-2031
- 5.1. Market Analysis, Insights and Forecast - by Type
- 5.1.1. Block
- 5.1.2. File
- 5.1.3. Object
- 5.1.4. Hyper-converged Infrastructure
- 5.2. Market Analysis, Insights and Forecast - by Size of Enterprise
- 5.2.1. Small and Medium Enterprise
- 5.2.2. Large Enterprise
- 5.3. Market Analysis, Insights and Forecast - by End-user Industries
- 5.3.1. BFSI
- 5.3.2. Telecom and IT
- 5.3.3. Government
- 5.3.4. Other End-user Industries
- 5.4. Market Analysis, Insights and Forecast - by Region
- 5.4.1. North America
- 5.4.2. Europe
- 5.4.3. Asia
- 5.4.4. Latin America
- 5.4.5. Middle East and Africa
- 5.1. Market Analysis, Insights and Forecast - by Type
- 6. North America Software Defined Storage Market Analysis, Insights and Forecast, 2019-2031
- 6.1. Market Analysis, Insights and Forecast - by Type
- 6.1.1. Block
- 6.1.2. File
- 6.1.3. Object
- 6.1.4. Hyper-converged Infrastructure
- 6.2. Market Analysis, Insights and Forecast - by Size of Enterprise
- 6.2.1. Small and Medium Enterprise
- 6.2.2. Large Enterprise
- 6.3. Market Analysis, Insights and Forecast - by End-user Industries
- 6.3.1. BFSI
- 6.3.2. Telecom and IT
- 6.3.3. Government
- 6.3.4. Other End-user Industries
- 6.1. Market Analysis, Insights and Forecast - by Type
- 7. Europe Software Defined Storage Market Analysis, Insights and Forecast, 2019-2031
- 7.1. Market Analysis, Insights and Forecast - by Type
- 7.1.1. Block
- 7.1.2. File
- 7.1.3. Object
- 7.1.4. Hyper-converged Infrastructure
- 7.2. Market Analysis, Insights and Forecast - by Size of Enterprise
- 7.2.1. Small and Medium Enterprise
- 7.2.2. Large Enterprise
- 7.3. Market Analysis, Insights and Forecast - by End-user Industries
- 7.3.1. BFSI
- 7.3.2. Telecom and IT
- 7.3.3. Government
- 7.3.4. Other End-user Industries
- 7.1. Market Analysis, Insights and Forecast - by Type
- 8. Asia Software Defined Storage Market Analysis, Insights and Forecast, 2019-2031
- 8.1. Market Analysis, Insights and Forecast - by Type
- 8.1.1. Block
- 8.1.2. File
- 8.1.3. Object
- 8.1.4. Hyper-converged Infrastructure
- 8.2. Market Analysis, Insights and Forecast - by Size of Enterprise
- 8.2.1. Small and Medium Enterprise
- 8.2.2. Large Enterprise
- 8.3. Market Analysis, Insights and Forecast - by End-user Industries
- 8.3.1. BFSI
- 8.3.2. Telecom and IT
- 8.3.3. Government
- 8.3.4. Other End-user Industries
- 8.1. Market Analysis, Insights and Forecast - by Type
- 9. Latin America Software Defined Storage Market Analysis, Insights and Forecast, 2019-2031
- 9.1. Market Analysis, Insights and Forecast - by Type
- 9.1.1. Block
- 9.1.2. File
- 9.1.3. Object
- 9.1.4. Hyper-converged Infrastructure
- 9.2. Market Analysis, Insights and Forecast - by Size of Enterprise
- 9.2.1. Small and Medium Enterprise
- 9.2.2. Large Enterprise
- 9.3. Market Analysis, Insights and Forecast - by End-user Industries
- 9.3.1. BFSI
- 9.3.2. Telecom and IT
- 9.3.3. Government
- 9.3.4. Other End-user Industries
- 9.1. Market Analysis, Insights and Forecast - by Type
- 10. Middle East and Africa Software Defined Storage Market Analysis, Insights and Forecast, 2019-2031
- 10.1. Market Analysis, Insights and Forecast - by Type
- 10.1.1. Block
- 10.1.2. File
- 10.1.3. Object
- 10.1.4. Hyper-converged Infrastructure
- 10.2. Market Analysis, Insights and Forecast - by Size of Enterprise
- 10.2.1. Small and Medium Enterprise
- 10.2.2. Large Enterprise
- 10.3. Market Analysis, Insights and Forecast - by End-user Industries
- 10.3.1. BFSI
- 10.3.2. Telecom and IT
- 10.3.3. Government
- 10.3.4. Other End-user Industries
- 10.1. Market Analysis, Insights and Forecast - by Type
- 11. North America Software Defined Storage Market Analysis, Insights and Forecast, 2019-2031
- 11.1. Market Analysis, Insights and Forecast - By Country/Sub-region
- 11.1.1 United States
- 11.1.2 Canada
- 11.1.3 Mexico
- 12. Europe Software Defined Storage Market Analysis, Insights and Forecast, 2019-2031
- 12.1. Market Analysis, Insights and Forecast - By Country/Sub-region
- 12.1.1 Germany
- 12.1.2 United Kingdom
- 12.1.3 France
- 12.1.4 Spain
- 12.1.5 Italy
- 12.1.6 Spain
- 12.1.7 Belgium
- 12.1.8 Netherland
- 12.1.9 Nordics
- 12.1.10 Rest of Europe
- 13. Asia Pacific Software Defined Storage Market Analysis, Insights and Forecast, 2019-2031
- 13.1. Market Analysis, Insights and Forecast - By Country/Sub-region
- 13.1.1 China
- 13.1.2 Japan
- 13.1.3 India
- 13.1.4 South Korea
- 13.1.5 Southeast Asia
- 13.1.6 Australia
- 13.1.7 Indonesia
- 13.1.8 Phillipes
- 13.1.9 Singapore
- 13.1.10 Thailandc
- 13.1.11 Rest of Asia Pacific
- 14. South America Software Defined Storage Market Analysis, Insights and Forecast, 2019-2031
- 14.1. Market Analysis, Insights and Forecast - By Country/Sub-region
- 14.1.1 Brazil
- 14.1.2 Argentina
- 14.1.3 Peru
- 14.1.4 Chile
- 14.1.5 Colombia
- 14.1.6 Ecuador
- 14.1.7 Venezuela
- 14.1.8 Rest of South America
- 15. North America Software Defined Storage Market Analysis, Insights and Forecast, 2019-2031
- 15.1. Market Analysis, Insights and Forecast - By Country/Sub-region
- 15.1.1 United States
- 15.1.2 Canada
- 15.1.3 Mexico
- 16. MEA Software Defined Storage Market Analysis, Insights and Forecast, 2019-2031
- 16.1. Market Analysis, Insights and Forecast - By Country/Sub-region
- 16.1.1 United Arab Emirates
- 16.1.2 Saudi Arabia
- 16.1.3 South Africa
- 16.1.4 Rest of Middle East and Africa
- 17. Competitive Analysis
- 17.1. Global Market Share Analysis 2024
- 17.2. Company Profiles
- 17.2.1 Promise Technology Inc
- 17.2.1.1. Overview
- 17.2.1.2. Products
- 17.2.1.3. SWOT Analysis
- 17.2.1.4. Recent Developments
- 17.2.1.5. Financials (Based on Availability)
- 17.2.2 Hitachi Vantara Corp
- 17.2.2.1. Overview
- 17.2.2.2. Products
- 17.2.2.3. SWOT Analysis
- 17.2.2.4. Recent Developments
- 17.2.2.5. Financials (Based on Availability)
- 17.2.3 IBM Corporation
- 17.2.3.1. Overview
- 17.2.3.2. Products
- 17.2.3.3. SWOT Analysis
- 17.2.3.4. Recent Developments
- 17.2.3.5. Financials (Based on Availability)
- 17.2.4 Netapp Inc
- 17.2.4.1. Overview
- 17.2.4.2. Products
- 17.2.4.3. SWOT Analysis
- 17.2.4.4. Recent Developments
- 17.2.4.5. Financials (Based on Availability)
- 17.2.5 StarWind Software Inc *List Not Exhaustive
- 17.2.5.1. Overview
- 17.2.5.2. Products
- 17.2.5.3. SWOT Analysis
- 17.2.5.4. Recent Developments
- 17.2.5.5. Financials (Based on Availability)
- 17.2.6 Genetec Inc
- 17.2.6.1. Overview
- 17.2.6.2. Products
- 17.2.6.3. SWOT Analysis
- 17.2.6.4. Recent Developments
- 17.2.6.5. Financials (Based on Availability)
- 17.2.7 Fujitsu Limited
- 17.2.7.1. Overview
- 17.2.7.2. Products
- 17.2.7.3. SWOT Analysis
- 17.2.7.4. Recent Developments
- 17.2.7.5. Financials (Based on Availability)
- 17.2.8 Huawei Technologies Co Ltd
- 17.2.8.1. Overview
- 17.2.8.2. Products
- 17.2.8.3. SWOT Analysis
- 17.2.8.4. Recent Developments
- 17.2.8.5. Financials (Based on Availability)
- 17.2.9 Oracle Corporation
- 17.2.9.1. Overview
- 17.2.9.2. Products
- 17.2.9.3. SWOT Analysis
- 17.2.9.4. Recent Developments
- 17.2.9.5. Financials (Based on Availability)
- 17.2.10 VMWare Inc (Dell Inc )
- 17.2.10.1. Overview
- 17.2.10.2. Products
- 17.2.10.3. SWOT Analysis
- 17.2.10.4. Recent Developments
- 17.2.10.5. Financials (Based on Availability)
- 17.2.11 Pure Storage Inc
- 17.2.11.1. Overview
- 17.2.11.2. Products
- 17.2.11.3. SWOT Analysis
- 17.2.11.4. Recent Developments
- 17.2.11.5. Financials (Based on Availability)
- 17.2.12 FalconStor Software Inc
- 17.2.12.1. Overview
- 17.2.12.2. Products
- 17.2.12.3. SWOT Analysis
- 17.2.12.4. Recent Developments
- 17.2.12.5. Financials (Based on Availability)
- 17.2.1 Promise Technology Inc
List of Figures
- Figure 1: Global Software Defined Storage Market Revenue Breakdown (Million, %) by Region 2024 & 2032
- Figure 2: North America Software Defined Storage Market Revenue (Million), by Country 2024 & 2032
- Figure 3: North America Software Defined Storage Market Revenue Share (%), by Country 2024 & 2032
- Figure 4: Europe Software Defined Storage Market Revenue (Million), by Country 2024 & 2032
- Figure 5: Europe Software Defined Storage Market Revenue Share (%), by Country 2024 & 2032
- Figure 6: Asia Pacific Software Defined Storage Market Revenue (Million), by Country 2024 & 2032
- Figure 7: Asia Pacific Software Defined Storage Market Revenue Share (%), by Country 2024 & 2032
- Figure 8: South America Software Defined Storage Market Revenue (Million), by Country 2024 & 2032
- Figure 9: South America Software Defined Storage Market Revenue Share (%), by Country 2024 & 2032
- Figure 10: North America Software Defined Storage Market Revenue (Million), by Country 2024 & 2032
- Figure 11: North America Software Defined Storage Market Revenue Share (%), by Country 2024 & 2032
- Figure 12: MEA Software Defined Storage Market Revenue (Million), by Country 2024 & 2032
- Figure 13: MEA Software Defined Storage Market Revenue Share (%), by Country 2024 & 2032
- Figure 14: North America Software Defined Storage Market Revenue (Million), by Type 2024 & 2032
- Figure 15: North America Software Defined Storage Market Revenue Share (%), by Type 2024 & 2032
- Figure 16: North America Software Defined Storage Market Revenue (Million), by Size of Enterprise 2024 & 2032
- Figure 17: North America Software Defined Storage Market Revenue Share (%), by Size of Enterprise 2024 & 2032
- Figure 18: North America Software Defined Storage Market Revenue (Million), by End-user Industries 2024 & 2032
- Figure 19: North America Software Defined Storage Market Revenue Share (%), by End-user Industries 2024 & 2032
- Figure 20: North America Software Defined Storage Market Revenue (Million), by Country 2024 & 2032
- Figure 21: North America Software Defined Storage Market Revenue Share (%), by Country 2024 & 2032
- Figure 22: Europe Software Defined Storage Market Revenue (Million), by Type 2024 & 2032
- Figure 23: Europe Software Defined Storage Market Revenue Share (%), by Type 2024 & 2032
- Figure 24: Europe Software Defined Storage Market Revenue (Million), by Size of Enterprise 2024 & 2032
- Figure 25: Europe Software Defined Storage Market Revenue Share (%), by Size of Enterprise 2024 & 2032
- Figure 26: Europe Software Defined Storage Market Revenue (Million), by End-user Industries 2024 & 2032
- Figure 27: Europe Software Defined Storage Market Revenue Share (%), by End-user Industries 2024 & 2032
- Figure 28: Europe Software Defined Storage Market Revenue (Million), by Country 2024 & 2032
- Figure 29: Europe Software Defined Storage Market Revenue Share (%), by Country 2024 & 2032
- Figure 30: Asia Software Defined Storage Market Revenue (Million), by Type 2024 & 2032
- Figure 31: Asia Software Defined Storage Market Revenue Share (%), by Type 2024 & 2032
- Figure 32: Asia Software Defined Storage Market Revenue (Million), by Size of Enterprise 2024 & 2032
- Figure 33: Asia Software Defined Storage Market Revenue Share (%), by Size of Enterprise 2024 & 2032
- Figure 34: Asia Software Defined Storage Market Revenue (Million), by End-user Industries 2024 & 2032
- Figure 35: Asia Software Defined Storage Market Revenue Share (%), by End-user Industries 2024 & 2032
- Figure 36: Asia Software Defined Storage Market Revenue (Million), by Country 2024 & 2032
- Figure 37: Asia Software Defined Storage Market Revenue Share (%), by Country 2024 & 2032
- Figure 38: Latin America Software Defined Storage Market Revenue (Million), by Type 2024 & 2032
- Figure 39: Latin America Software Defined Storage Market Revenue Share (%), by Type 2024 & 2032
- Figure 40: Latin America Software Defined Storage Market Revenue (Million), by Size of Enterprise 2024 & 2032
- Figure 41: Latin America Software Defined Storage Market Revenue Share (%), by Size of Enterprise 2024 & 2032
- Figure 42: Latin America Software Defined Storage Market Revenue (Million), by End-user Industries 2024 & 2032
- Figure 43: Latin America Software Defined Storage Market Revenue Share (%), by End-user Industries 2024 & 2032
- Figure 44: Latin America Software Defined Storage Market Revenue (Million), by Country 2024 & 2032
- Figure 45: Latin America Software Defined Storage Market Revenue Share (%), by Country 2024 & 2032
- Figure 46: Middle East and Africa Software Defined Storage Market Revenue (Million), by Type 2024 & 2032
- Figure 47: Middle East and Africa Software Defined Storage Market Revenue Share (%), by Type 2024 & 2032
- Figure 48: Middle East and Africa Software Defined Storage Market Revenue (Million), by Size of Enterprise 2024 & 2032
- Figure 49: Middle East and Africa Software Defined Storage Market Revenue Share (%), by Size of Enterprise 2024 & 2032
- Figure 50: Middle East and Africa Software Defined Storage Market Revenue (Million), by End-user Industries 2024 & 2032
- Figure 51: Middle East and Africa Software Defined Storage Market Revenue Share (%), by End-user Industries 2024 & 2032
- Figure 52: Middle East and Africa Software Defined Storage Market Revenue (Million), by Country 2024 & 2032
- Figure 53: Middle East and Africa Software Defined Storage Market Revenue Share (%), by Country 2024 & 2032
List of Tables
- Table 1: Global Software Defined Storage Market Revenue Million Forecast, by Region 2019 & 2032
- Table 2: Global Software Defined Storage Market Revenue Million Forecast, by Type 2019 & 2032
- Table 3: Global Software Defined Storage Market Revenue Million Forecast, by Size of Enterprise 2019 & 2032
- Table 4: Global Software Defined Storage Market Revenue Million Forecast, by End-user Industries 2019 & 2032
- Table 5: Global Software Defined Storage Market Revenue Million Forecast, by Region 2019 & 2032
- Table 6: Global Software Defined Storage Market Revenue Million Forecast, by Country 2019 & 2032
- Table 7: United States Software Defined Storage Market Revenue (Million) Forecast, by Application 2019 & 2032
- Table 8: Canada Software Defined Storage Market Revenue (Million) Forecast, by Application 2019 & 2032
- Table 9: Mexico Software Defined Storage Market Revenue (Million) Forecast, by Application 2019 & 2032
- Table 10: Global Software Defined Storage Market Revenue Million Forecast, by Country 2019 & 2032
- Table 11: Germany Software Defined Storage Market Revenue (Million) Forecast, by Application 2019 & 2032
- Table 12: United Kingdom Software Defined Storage Market Revenue (Million) Forecast, by Application 2019 & 2032
- Table 13: France Software Defined Storage Market Revenue (Million) Forecast, by Application 2019 & 2032
- Table 14: Spain Software Defined Storage Market Revenue (Million) Forecast, by Application 2019 & 2032
- Table 15: Italy Software Defined Storage Market Revenue (Million) Forecast, by Application 2019 & 2032
- Table 16: Spain Software Defined Storage Market Revenue (Million) Forecast, by Application 2019 & 2032
- Table 17: Belgium Software Defined Storage Market Revenue (Million) Forecast, by Application 2019 & 2032
- Table 18: Netherland Software Defined Storage Market Revenue (Million) Forecast, by Application 2019 & 2032
- Table 19: Nordics Software Defined Storage Market Revenue (Million) Forecast, by Application 2019 & 2032
- Table 20: Rest of Europe Software Defined Storage Market Revenue (Million) Forecast, by Application 2019 & 2032
- Table 21: Global Software Defined Storage Market Revenue Million Forecast, by Country 2019 & 2032
- Table 22: China Software Defined Storage Market Revenue (Million) Forecast, by Application 2019 & 2032
- Table 23: Japan Software Defined Storage Market Revenue (Million) Forecast, by Application 2019 & 2032
- Table 24: India Software Defined Storage Market Revenue (Million) Forecast, by Application 2019 & 2032
- Table 25: South Korea Software Defined Storage Market Revenue (Million) Forecast, by Application 2019 & 2032
- Table 26: Southeast Asia Software Defined Storage Market Revenue (Million) Forecast, by Application 2019 & 2032
- Table 27: Australia Software Defined Storage Market Revenue (Million) Forecast, by Application 2019 & 2032
- Table 28: Indonesia Software Defined Storage Market Revenue (Million) Forecast, by Application 2019 & 2032
- Table 29: Phillipes Software Defined Storage Market Revenue (Million) Forecast, by Application 2019 & 2032
- Table 30: Singapore Software Defined Storage Market Revenue (Million) Forecast, by Application 2019 & 2032
- Table 31: Thailandc Software Defined Storage Market Revenue (Million) Forecast, by Application 2019 & 2032
- Table 32: Rest of Asia Pacific Software Defined Storage Market Revenue (Million) Forecast, by Application 2019 & 2032
- Table 33: Global Software Defined Storage Market Revenue Million Forecast, by Country 2019 & 2032
- Table 34: Brazil Software Defined Storage Market Revenue (Million) Forecast, by Application 2019 & 2032
- Table 35: Argentina Software Defined Storage Market Revenue (Million) Forecast, by Application 2019 & 2032
- Table 36: Peru Software Defined Storage Market Revenue (Million) Forecast, by Application 2019 & 2032
- Table 37: Chile Software Defined Storage Market Revenue (Million) Forecast, by Application 2019 & 2032
- Table 38: Colombia Software Defined Storage Market Revenue (Million) Forecast, by Application 2019 & 2032
- Table 39: Ecuador Software Defined Storage Market Revenue (Million) Forecast, by Application 2019 & 2032
- Table 40: Venezuela Software Defined Storage Market Revenue (Million) Forecast, by Application 2019 & 2032
- Table 41: Rest of South America Software Defined Storage Market Revenue (Million) Forecast, by Application 2019 & 2032
- Table 42: Global Software Defined Storage Market Revenue Million Forecast, by Country 2019 & 2032
- Table 43: United States Software Defined Storage Market Revenue (Million) Forecast, by Application 2019 & 2032
- Table 44: Canada Software Defined Storage Market Revenue (Million) Forecast, by Application 2019 & 2032
- Table 45: Mexico Software Defined Storage Market Revenue (Million) Forecast, by Application 2019 & 2032
- Table 46: Global Software Defined Storage Market Revenue Million Forecast, by Country 2019 & 2032
- Table 47: United Arab Emirates Software Defined Storage Market Revenue (Million) Forecast, by Application 2019 & 2032
- Table 48: Saudi Arabia Software Defined Storage Market Revenue (Million) Forecast, by Application 2019 & 2032
- Table 49: South Africa Software Defined Storage Market Revenue (Million) Forecast, by Application 2019 & 2032
- Table 50: Rest of Middle East and Africa Software Defined Storage Market Revenue (Million) Forecast, by Application 2019 & 2032
- Table 51: Global Software Defined Storage Market Revenue Million Forecast, by Type 2019 & 2032
- Table 52: Global Software Defined Storage Market Revenue Million Forecast, by Size of Enterprise 2019 & 2032
- Table 53: Global Software Defined Storage Market Revenue Million Forecast, by End-user Industries 2019 & 2032
- Table 54: Global Software Defined Storage Market Revenue Million Forecast, by Country 2019 & 2032
- Table 55: Global Software Defined Storage Market Revenue Million Forecast, by Type 2019 & 2032
- Table 56: Global Software Defined Storage Market Revenue Million Forecast, by Size of Enterprise 2019 & 2032
- Table 57: Global Software Defined Storage Market Revenue Million Forecast, by End-user Industries 2019 & 2032
- Table 58: Global Software Defined Storage Market Revenue Million Forecast, by Country 2019 & 2032
- Table 59: Global Software Defined Storage Market Revenue Million Forecast, by Type 2019 & 2032
- Table 60: Global Software Defined Storage Market Revenue Million Forecast, by Size of Enterprise 2019 & 2032
- Table 61: Global Software Defined Storage Market Revenue Million Forecast, by End-user Industries 2019 & 2032
- Table 62: Global Software Defined Storage Market Revenue Million Forecast, by Country 2019 & 2032
- Table 63: Global Software Defined Storage Market Revenue Million Forecast, by Type 2019 & 2032
- Table 64: Global Software Defined Storage Market Revenue Million Forecast, by Size of Enterprise 2019 & 2032
- Table 65: Global Software Defined Storage Market Revenue Million Forecast, by End-user Industries 2019 & 2032
- Table 66: Global Software Defined Storage Market Revenue Million Forecast, by Country 2019 & 2032
- Table 67: Global Software Defined Storage Market Revenue Million Forecast, by Type 2019 & 2032
- Table 68: Global Software Defined Storage Market Revenue Million Forecast, by Size of Enterprise 2019 & 2032
- Table 69: Global Software Defined Storage Market Revenue Million Forecast, by End-user Industries 2019 & 2032
- Table 70: Global Software Defined Storage Market Revenue Million Forecast, by Country 2019 & 2032
Frequently Asked Questions
1. What is the projected Compound Annual Growth Rate (CAGR) of the Software Defined Storage Market?
The projected CAGR is approximately 25.80%.
2. Which companies are prominent players in the Software Defined Storage Market?
Key companies in the market include Promise Technology Inc, Hitachi Vantara Corp, IBM Corporation, Netapp Inc, StarWind Software Inc *List Not Exhaustive, Genetec Inc, Fujitsu Limited, Huawei Technologies Co Ltd, Oracle Corporation, VMWare Inc (Dell Inc ), Pure Storage Inc, FalconStor Software Inc.
3. What are the main segments of the Software Defined Storage Market?
The market segments include Type, Size of Enterprise, End-user Industries.
4. Can you provide details about the market size?
The market size is estimated to be USD XX Million as of 2022.
5. What are some drivers contributing to market growth?
Rapidly Growing Volume of Data Across Enterprises; Increased Demand for Industrial Mobility for Remotely Managing the Process Industry.
6. What are the notable trends driving market growth?
BFSI Sector to Witness Significant Growth.
7. Are there any restraints impacting market growth?
Lack of Security Awareness in Virtualization Environment; Industry Standard Deficiency.
8. Can you provide examples of recent developments in the market?
March 2022 - Nvidia acquired Excelero, a high-performance block storage provider whose core product, Excelero NVMesh, offers software-defined block storage via networked NVMe SSDs and operates through networked drives on-prem or in private clouds and started supporting Microsoft Azure form last year. This acquisition of Excelero could mark another win for its increasingly diversified portfolio of assets as the GPU giant works to broaden its reach beyond components and into integrated systems and software.
9. What pricing options are available for accessing the report?
Pricing options include single-user, multi-user, and enterprise licenses priced at USD 4750, USD 5250, and USD 8750 respectively.
10. Is the market size provided in terms of value or volume?
The market size is provided in terms of value, measured in Million.
11. Are there any specific market keywords associated with the report?
Yes, the market keyword associated with the report is "Software Defined Storage Market," which aids in identifying and referencing the specific market segment covered.
12. How do I determine which pricing option suits my needs best?
The pricing options vary based on user requirements and access needs. Individual users may opt for single-user licenses, while businesses requiring broader access may choose multi-user or enterprise licenses for cost-effective access to the report.
13. Are there any additional resources or data provided in the Software Defined Storage Market report?
While the report offers comprehensive insights, it's advisable to review the specific contents or supplementary materials provided to ascertain if additional resources or data are available.
14. How can I stay updated on further developments or reports in the Software Defined Storage Market?
To stay informed about further developments, trends, and reports in the Software Defined Storage Market, consider subscribing to industry newsletters, following relevant companies and organizations, or regularly checking reputable industry news sources and publications.
Methodology
Step 1 - Identification of Relevant Samples Size from Population Database


Step 2 - Approaches for Defining Global Market Size (Value, Volume* & Price*)

Note*: In applicable scenarios
Step 3 - Data Sources
Primary Research
- Web Analytics
- Survey Reports
- Research Institute
- Latest Research Reports
- Opinion Leaders
Secondary Research
- Annual Reports
- White Paper
- Latest Press Release
- Industry Association
- Paid Database
- Investor Presentations

Step 4 - Data Triangulation
Involves using different sources of information in order to increase the validity of a study
These sources are likely to be stakeholders in a program - participants, other researchers, program staff, other community members, and so on.
Then we put all data in single framework & apply various statistical tools to find out the dynamic on the market.
During the analysis stage, feedback from the stakeholder groups would be compared to determine areas of agreement as well as areas of divergence


