
Key Insights
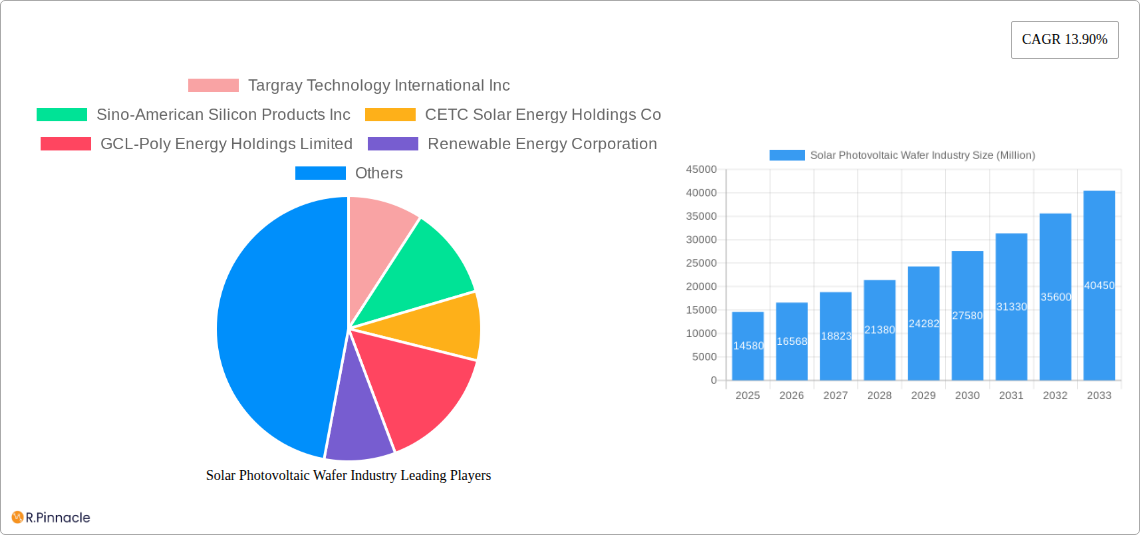
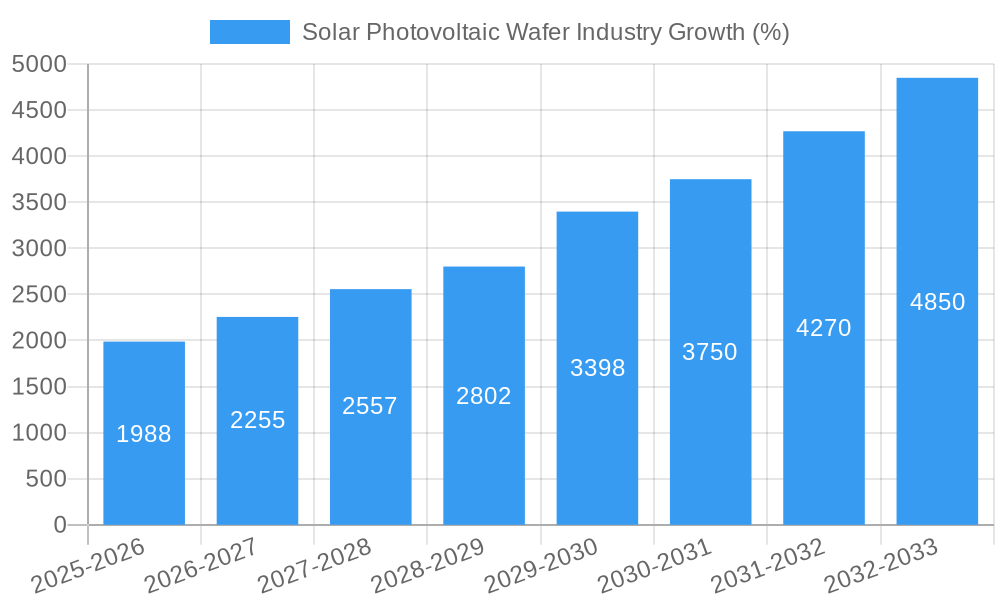
The global solar photovoltaic (PV) wafer market, valued at $14.58 billion in 2025, is projected to experience robust growth, driven by the increasing demand for renewable energy sources and supportive government policies promoting solar energy adoption worldwide. A compound annual growth rate (CAGR) of 13.90% from 2025 to 2033 indicates a significant expansion of the market, with the total market size expected to surpass $50 billion by 2033. This growth is fueled by several key factors. Firstly, the declining cost of solar PV technology makes it increasingly competitive with traditional energy sources, particularly in regions with abundant sunlight. Secondly, rising concerns about climate change and the urgent need for decarbonization are accelerating the global shift towards renewable energy solutions. Furthermore, advancements in wafer technology, particularly in monocrystalline wafers offering higher efficiency, are boosting market growth. Geographically, Asia-Pacific, particularly China, is expected to remain the dominant market due to its large-scale solar energy projects and robust manufacturing capabilities. However, North America and Europe are also projected to witness significant growth driven by strong government incentives and increasing investments in renewable energy infrastructure. The market segmentation by wafer type (monocrystalline and polycrystalline) shows a clear trend towards monocrystalline wafers due to their superior efficiency, though polycrystalline wafers continue to maintain a significant market share, catering to price-sensitive segments. Competition within the industry is fierce, with major players like LONGi Green Energy Technology Co Ltd, JinkoSolar, JA Solar, and others constantly striving for innovation and cost reduction to gain market share.
The competitive landscape is characterized by both established players and emerging companies focusing on technological advancements and cost-effective manufacturing. Continuous innovation in wafer production processes, including advancements in silicon ingot and slicing techniques, is driving efficiency gains and cost reductions, further fueling market growth. Despite the positive outlook, the market faces challenges including the intermittent nature of solar energy, requiring robust energy storage solutions, and potential supply chain disruptions related to raw material availability and geopolitical factors. However, ongoing technological advancements and government support are expected to mitigate these challenges, leading to sustained growth in the solar PV wafer market throughout the forecast period. The market is ripe for further diversification with potential growth in emerging markets like South America and the Middle East and Africa, as these regions witness increasing investments in renewable energy infrastructure.
Solar Photovoltaic Wafer Industry Market Report: 2019-2033
This comprehensive report provides a detailed analysis of the Solar Photovoltaic Wafer industry, offering invaluable insights for industry professionals, investors, and strategic decision-makers. The report covers the period 2019-2033, with a focus on the forecast period 2025-2033 and a base year of 2025. The report leverages extensive data and analysis to provide a clear picture of market trends, competitive dynamics, and future growth potential. Key players such as Targray Technology International Inc, Sino-American Silicon Products Inc, CETC Solar Energy Holdings Co, GCL-Poly Energy Holdings Limited, Renewable Energy Corporation, Jinko Solar Holding Co Ltd, JA Solar Holdings Co Ltd, and LONGi Green Energy Technology Co Ltd are analyzed in detail.
Solar Photovoltaic Wafer Industry Market Structure & Innovation Trends
This section analyzes the competitive landscape of the solar photovoltaic wafer market, examining market concentration, innovation drivers, regulatory frameworks, product substitutes, end-user demographics, and mergers and acquisitions (M&A) activities. The market is characterized by a moderate level of concentration, with the top five players holding an estimated xx% market share in 2025. Key innovation drivers include advancements in wafer technology (e.g., monocrystalline and multicrystalline wafers), efficiency improvements, and cost reductions. Government policies promoting renewable energy, including subsidies and tax incentives, significantly influence market growth. Product substitutes, such as thin-film solar cells, pose a competitive threat, while the increasing demand for solar energy from diverse end-user segments (residential, commercial, and utility-scale) fuels market expansion. M&A activities, although not frequent, are predicted to be worth around USD xx Million in the next few years, with significant deals focused on expanding production capacity and securing raw material supplies.
Solar Photovoltaic Wafer Industry Market Dynamics & Trends
The global solar photovoltaic wafer market is experiencing robust growth, driven by the increasing adoption of renewable energy sources worldwide. The Compound Annual Growth Rate (CAGR) is projected to be xx% during the forecast period (2025-2033). This growth is fueled by several factors: increasing government support for solar energy, declining costs of solar photovoltaic (PV) systems, growing awareness of environmental concerns, and technological advancements leading to higher efficiency and lower production costs. The market penetration of monocrystalline wafers is expected to increase significantly, exceeding xx% by 2033, driven by their superior efficiency compared to polycrystalline wafers. The competitive landscape is highly dynamic, with companies focusing on innovation, cost optimization, and expansion into new markets.
Dominant Regions & Segments in Solar Photovoltaic Wafer Industry
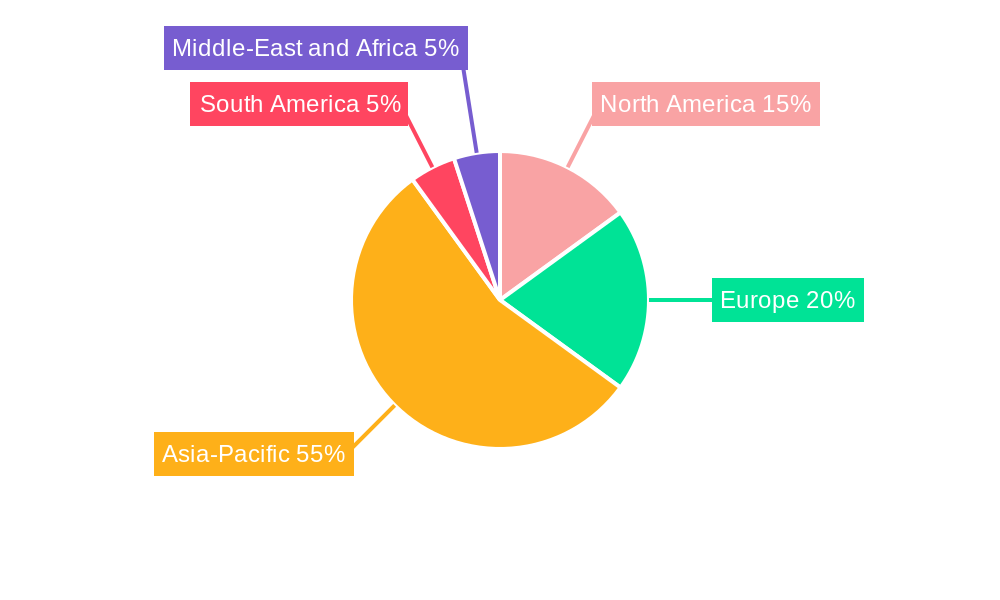
The Asia-Pacific region dominates the global solar photovoltaic wafer market, accounting for an estimated xx% market share in 2025. This dominance is primarily due to the large-scale manufacturing facilities located in China, coupled with strong government support for renewable energy projects and high domestic demand. The following factors contribute to regional dominance:
- Asia-Pacific: Strong government policies, massive manufacturing capacity, and high demand drive market leadership.
- North America: Significant investments in renewable energy infrastructure and increasing government incentives contribute to growth.
- Europe: Growing renewable energy targets and supportive policies are driving market expansion.
Within the product type segment, monocrystalline wafers represent the largest share, owing to their higher efficiency and increasing demand in high-performance solar PV applications. South America and the Middle East and Africa regions are experiencing relatively slower growth, largely due to limited infrastructure development and lower adoption rates of renewable energy technologies.
Solar Photovoltaic Wafer Industry Product Innovations
Recent product innovations include improvements in wafer manufacturing processes leading to higher efficiency and lower production costs. This includes advancements in techniques such as diamond wire sawing and the development of larger-size wafers. There is a significant push towards higher-efficiency monocrystalline wafers, which are gaining market share due to their performance benefits. These innovations contribute directly to the enhanced efficiency and cost-competitiveness of solar PV systems, driving greater market acceptance and adoption.
Report Scope & Segmentation Analysis
This report segments the solar photovoltaic wafer market based on geography (North America, Europe, Asia-Pacific, South America, Middle East and Africa), product type (monocrystalline wafer, polycrystalline wafer), and further regional breakdowns (Rest of North America, Rest of Europe, Rest of Asia-Pacific, Rest of South America). Each segment is analyzed in detail, including market size, growth projections, and competitive dynamics. The Asia-Pacific region, specifically China, is expected to experience the fastest growth due to its massive manufacturing capabilities and strong government support. Monocrystalline wafers are forecast to capture a larger market share than polycrystalline wafers over the next decade.
Key Drivers of Solar Photovoltaic Wafer Industry Growth
The solar photovoltaic wafer industry's growth is driven by several factors: the increasing global demand for renewable energy, coupled with supportive government policies and declining costs of solar PV systems. Technological advancements, leading to higher efficiency and reduced manufacturing costs, also play a significant role. Furthermore, growing awareness of environmental sustainability and the need to reduce carbon emissions are boosting demand for clean energy sources like solar power.
Challenges in the Solar Photovoltaic Wafer Industry Sector
The industry faces challenges, including fluctuations in raw material prices (polysilicon), intense competition, and potential supply chain disruptions. Regulatory hurdles and varying government policies across different regions can also impact market growth. The industry's dependence on polysilicon, a key raw material, makes it vulnerable to price volatility. Overcoming these challenges requires strategic planning, diversification, and technological innovation.
Emerging Opportunities in Solar Photovoltaic Wafer Industry
Emerging opportunities include the development of next-generation solar cells with even higher efficiency, expanding into new markets with growing demand for renewable energy (e.g., Africa, South America), and focusing on customized solutions for specific applications. Innovation in wafer manufacturing processes, aiming at significant cost reduction, presents considerable opportunity for market expansion. The development and adoption of more sustainable manufacturing processes, reducing the industry’s environmental footprint, also offer great potential.
Leading Players in the Solar Photovoltaic Wafer Industry Market
- Targray Technology International Inc
- Sino-American Silicon Products Inc
- CETC Solar Energy Holdings Co
- GCL-Poly Energy Holdings Limited
- Renewable Energy Corporation
- Jinko Solar Holding Co Ltd
- JA Solar Holdings Co Ltd
- LONGi Green Energy Technology Co Ltd
Key Developments in Solar Photovoltaic Wafer Industry
- June 2023: NexdWafe GmbH secured a USD 32 million contract to build a green solar wafer production facility in Germany.
- June 2023: CubicPV received USD 103 million in equity financing to develop a US silicon wafer production base.
Future Outlook for Solar Photovoltaic Wafer Industry Market
The future of the solar photovoltaic wafer market looks promising, with continued growth driven by increasing renewable energy adoption, technological advancements, and supportive government policies. Strategic partnerships, technological innovations, and expansion into new markets will be crucial for companies to succeed in this dynamic and competitive landscape. The focus on sustainability and cost reduction will drive further innovation and market expansion throughout the forecast period.
Solar Photovoltaic Wafer Industry Segmentation
-
1. Type
- 1.1. Monocrystalline Wafer
- 1.2. Polycrystalline Wafer
-
2. Geogrpahy
-
2.1. North America
- 2.1.1. United States
- 2.1.2. Canada
- 2.1.3. Rest of North America
-
2.2. Europe
- 2.2.1. Germany
- 2.2.2. France
- 2.2.3. United Kingdom
- 2.2.4. Italy
- 2.2.5. Spain
- 2.2.6. NORDIC
- 2.2.7. Turkey
- 2.2.8. Russia
- 2.2.9. Rest of Europe
-
2.3. Asia-Pacific
- 2.3.1. China
- 2.3.2. India
- 2.3.3. Australia
- 2.3.4. Japan
- 2.3.5. Malaysia
- 2.3.6. Vietnam
- 2.3.7. Thailand
- 2.3.8. Indonesia
- 2.3.9. Rest of Asia-Pacific
-
2.4. South America
- 2.4.1. Brazil
- 2.4.2. Argentina
- 2.4.3. Chile
- 2.4.4. Colombia
- 2.4.5. Rest of South America
-
2.5. Middle-East and Africa
- 2.5.1. United Arab Emirates
- 2.5.2. Saudi Arabia
- 2.5.3. South Africa
- 2.5.4. Qatar
- 2.5.5. Nigeria
- 2.5.6. Egypt
-
2.1. North America
- 3. Market Player Ranking
Solar Photovoltaic Wafer Industry Segmentation By Geography
-
1. North America
- 1.1. United States
- 1.2. Canada
- 1.3. Mexico
-
2. South America
- 2.1. Brazil
- 2.2. Argentina
- 2.3. Rest of South America
-
3. Europe
- 3.1. United Kingdom
- 3.2. Germany
- 3.3. France
- 3.4. Italy
- 3.5. Spain
- 3.6. Russia
- 3.7. Benelux
- 3.8. Nordics
- 3.9. Rest of Europe
-
4. Middle East & Africa
- 4.1. Turkey
- 4.2. Israel
- 4.3. GCC
- 4.4. North Africa
- 4.5. South Africa
- 4.6. Rest of Middle East & Africa
-
5. Asia Pacific
- 5.1. China
- 5.2. India
- 5.3. Japan
- 5.4. South Korea
- 5.5. ASEAN
- 5.6. Oceania
- 5.7. Rest of Asia Pacific
Solar Photovoltaic Wafer Industry REPORT HIGHLIGHTS
| Aspects | Details |
|---|---|
| Study Period | 2019-2033 |
| Base Year | 2024 |
| Estimated Year | 2025 |
| Forecast Period | 2025-2033 |
| Historical Period | 2019-2024 |
| Growth Rate | CAGR of 13.90% from 2019-2033 |
| Segmentation |
|
Table of Contents
- 1. Introduction
- 1.1. Research Scope
- 1.2. Market Segmentation
- 1.3. Research Methodology
- 1.4. Definitions and Assumptions
- 2. Executive Summary
- 2.1. Introduction
- 3. Market Dynamics
- 3.1. Introduction
- 3.2. Market Drivers
- 3.2.1. 4.; Increasing Demand for Renewable Energy4.; Supportive Government Policies
- 3.3. Market Restrains
- 3.3.1. 4.; High Cost Compared to Alternatives like Thin Films
- 3.4. Market Trends
- 3.4.1. Monocrystalline Solar Photovoltaic Wafer is Expected to Dominate the Market
- 4. Market Factor Analysis
- 4.1. Porters Five Forces
- 4.2. Supply/Value Chain
- 4.3. PESTEL analysis
- 4.4. Market Entropy
- 4.5. Patent/Trademark Analysis
- 5. Global Solar Photovoltaic Wafer Industry Analysis, Insights and Forecast, 2019-2031
- 5.1. Market Analysis, Insights and Forecast - by Type
- 5.1.1. Monocrystalline Wafer
- 5.1.2. Polycrystalline Wafer
- 5.2. Market Analysis, Insights and Forecast - by Geogrpahy
- 5.2.1. North America
- 5.2.1.1. United States
- 5.2.1.2. Canada
- 5.2.1.3. Rest of North America
- 5.2.2. Europe
- 5.2.2.1. Germany
- 5.2.2.2. France
- 5.2.2.3. United Kingdom
- 5.2.2.4. Italy
- 5.2.2.5. Spain
- 5.2.2.6. NORDIC
- 5.2.2.7. Turkey
- 5.2.2.8. Russia
- 5.2.2.9. Rest of Europe
- 5.2.3. Asia-Pacific
- 5.2.3.1. China
- 5.2.3.2. India
- 5.2.3.3. Australia
- 5.2.3.4. Japan
- 5.2.3.5. Malaysia
- 5.2.3.6. Vietnam
- 5.2.3.7. Thailand
- 5.2.3.8. Indonesia
- 5.2.3.9. Rest of Asia-Pacific
- 5.2.4. South America
- 5.2.4.1. Brazil
- 5.2.4.2. Argentina
- 5.2.4.3. Chile
- 5.2.4.4. Colombia
- 5.2.4.5. Rest of South America
- 5.2.5. Middle-East and Africa
- 5.2.5.1. United Arab Emirates
- 5.2.5.2. Saudi Arabia
- 5.2.5.3. South Africa
- 5.2.5.4. Qatar
- 5.2.5.5. Nigeria
- 5.2.5.6. Egypt
- 5.2.1. North America
- 5.3. Market Analysis, Insights and Forecast - by Market Player Ranking
- 5.4. Market Analysis, Insights and Forecast - by Region
- 5.4.1. North America
- 5.4.2. South America
- 5.4.3. Europe
- 5.4.4. Middle East & Africa
- 5.4.5. Asia Pacific
- 5.1. Market Analysis, Insights and Forecast - by Type
- 6. North America Solar Photovoltaic Wafer Industry Analysis, Insights and Forecast, 2019-2031
- 6.1. Market Analysis, Insights and Forecast - by Type
- 6.1.1. Monocrystalline Wafer
- 6.1.2. Polycrystalline Wafer
- 6.2. Market Analysis, Insights and Forecast - by Geogrpahy
- 6.2.1. North America
- 6.2.1.1. United States
- 6.2.1.2. Canada
- 6.2.1.3. Rest of North America
- 6.2.2. Europe
- 6.2.2.1. Germany
- 6.2.2.2. France
- 6.2.2.3. United Kingdom
- 6.2.2.4. Italy
- 6.2.2.5. Spain
- 6.2.2.6. NORDIC
- 6.2.2.7. Turkey
- 6.2.2.8. Russia
- 6.2.2.9. Rest of Europe
- 6.2.3. Asia-Pacific
- 6.2.3.1. China
- 6.2.3.2. India
- 6.2.3.3. Australia
- 6.2.3.4. Japan
- 6.2.3.5. Malaysia
- 6.2.3.6. Vietnam
- 6.2.3.7. Thailand
- 6.2.3.8. Indonesia
- 6.2.3.9. Rest of Asia-Pacific
- 6.2.4. South America
- 6.2.4.1. Brazil
- 6.2.4.2. Argentina
- 6.2.4.3. Chile
- 6.2.4.4. Colombia
- 6.2.4.5. Rest of South America
- 6.2.5. Middle-East and Africa
- 6.2.5.1. United Arab Emirates
- 6.2.5.2. Saudi Arabia
- 6.2.5.3. South Africa
- 6.2.5.4. Qatar
- 6.2.5.5. Nigeria
- 6.2.5.6. Egypt
- 6.2.1. North America
- 6.3. Market Analysis, Insights and Forecast - by Market Player Ranking
- 6.1. Market Analysis, Insights and Forecast - by Type
- 7. South America Solar Photovoltaic Wafer Industry Analysis, Insights and Forecast, 2019-2031
- 7.1. Market Analysis, Insights and Forecast - by Type
- 7.1.1. Monocrystalline Wafer
- 7.1.2. Polycrystalline Wafer
- 7.2. Market Analysis, Insights and Forecast - by Geogrpahy
- 7.2.1. North America
- 7.2.1.1. United States
- 7.2.1.2. Canada
- 7.2.1.3. Rest of North America
- 7.2.2. Europe
- 7.2.2.1. Germany
- 7.2.2.2. France
- 7.2.2.3. United Kingdom
- 7.2.2.4. Italy
- 7.2.2.5. Spain
- 7.2.2.6. NORDIC
- 7.2.2.7. Turkey
- 7.2.2.8. Russia
- 7.2.2.9. Rest of Europe
- 7.2.3. Asia-Pacific
- 7.2.3.1. China
- 7.2.3.2. India
- 7.2.3.3. Australia
- 7.2.3.4. Japan
- 7.2.3.5. Malaysia
- 7.2.3.6. Vietnam
- 7.2.3.7. Thailand
- 7.2.3.8. Indonesia
- 7.2.3.9. Rest of Asia-Pacific
- 7.2.4. South America
- 7.2.4.1. Brazil
- 7.2.4.2. Argentina
- 7.2.4.3. Chile
- 7.2.4.4. Colombia
- 7.2.4.5. Rest of South America
- 7.2.5. Middle-East and Africa
- 7.2.5.1. United Arab Emirates
- 7.2.5.2. Saudi Arabia
- 7.2.5.3. South Africa
- 7.2.5.4. Qatar
- 7.2.5.5. Nigeria
- 7.2.5.6. Egypt
- 7.2.1. North America
- 7.3. Market Analysis, Insights and Forecast - by Market Player Ranking
- 7.1. Market Analysis, Insights and Forecast - by Type
- 8. Europe Solar Photovoltaic Wafer Industry Analysis, Insights and Forecast, 2019-2031
- 8.1. Market Analysis, Insights and Forecast - by Type
- 8.1.1. Monocrystalline Wafer
- 8.1.2. Polycrystalline Wafer
- 8.2. Market Analysis, Insights and Forecast - by Geogrpahy
- 8.2.1. North America
- 8.2.1.1. United States
- 8.2.1.2. Canada
- 8.2.1.3. Rest of North America
- 8.2.2. Europe
- 8.2.2.1. Germany
- 8.2.2.2. France
- 8.2.2.3. United Kingdom
- 8.2.2.4. Italy
- 8.2.2.5. Spain
- 8.2.2.6. NORDIC
- 8.2.2.7. Turkey
- 8.2.2.8. Russia
- 8.2.2.9. Rest of Europe
- 8.2.3. Asia-Pacific
- 8.2.3.1. China
- 8.2.3.2. India
- 8.2.3.3. Australia
- 8.2.3.4. Japan
- 8.2.3.5. Malaysia
- 8.2.3.6. Vietnam
- 8.2.3.7. Thailand
- 8.2.3.8. Indonesia
- 8.2.3.9. Rest of Asia-Pacific
- 8.2.4. South America
- 8.2.4.1. Brazil
- 8.2.4.2. Argentina
- 8.2.4.3. Chile
- 8.2.4.4. Colombia
- 8.2.4.5. Rest of South America
- 8.2.5. Middle-East and Africa
- 8.2.5.1. United Arab Emirates
- 8.2.5.2. Saudi Arabia
- 8.2.5.3. South Africa
- 8.2.5.4. Qatar
- 8.2.5.5. Nigeria
- 8.2.5.6. Egypt
- 8.2.1. North America
- 8.3. Market Analysis, Insights and Forecast - by Market Player Ranking
- 8.1. Market Analysis, Insights and Forecast - by Type
- 9. Middle East & Africa Solar Photovoltaic Wafer Industry Analysis, Insights and Forecast, 2019-2031
- 9.1. Market Analysis, Insights and Forecast - by Type
- 9.1.1. Monocrystalline Wafer
- 9.1.2. Polycrystalline Wafer
- 9.2. Market Analysis, Insights and Forecast - by Geogrpahy
- 9.2.1. North America
- 9.2.1.1. United States
- 9.2.1.2. Canada
- 9.2.1.3. Rest of North America
- 9.2.2. Europe
- 9.2.2.1. Germany
- 9.2.2.2. France
- 9.2.2.3. United Kingdom
- 9.2.2.4. Italy
- 9.2.2.5. Spain
- 9.2.2.6. NORDIC
- 9.2.2.7. Turkey
- 9.2.2.8. Russia
- 9.2.2.9. Rest of Europe
- 9.2.3. Asia-Pacific
- 9.2.3.1. China
- 9.2.3.2. India
- 9.2.3.3. Australia
- 9.2.3.4. Japan
- 9.2.3.5. Malaysia
- 9.2.3.6. Vietnam
- 9.2.3.7. Thailand
- 9.2.3.8. Indonesia
- 9.2.3.9. Rest of Asia-Pacific
- 9.2.4. South America
- 9.2.4.1. Brazil
- 9.2.4.2. Argentina
- 9.2.4.3. Chile
- 9.2.4.4. Colombia
- 9.2.4.5. Rest of South America
- 9.2.5. Middle-East and Africa
- 9.2.5.1. United Arab Emirates
- 9.2.5.2. Saudi Arabia
- 9.2.5.3. South Africa
- 9.2.5.4. Qatar
- 9.2.5.5. Nigeria
- 9.2.5.6. Egypt
- 9.2.1. North America
- 9.3. Market Analysis, Insights and Forecast - by Market Player Ranking
- 9.1. Market Analysis, Insights and Forecast - by Type
- 10. Asia Pacific Solar Photovoltaic Wafer Industry Analysis, Insights and Forecast, 2019-2031
- 10.1. Market Analysis, Insights and Forecast - by Type
- 10.1.1. Monocrystalline Wafer
- 10.1.2. Polycrystalline Wafer
- 10.2. Market Analysis, Insights and Forecast - by Geogrpahy
- 10.2.1. North America
- 10.2.1.1. United States
- 10.2.1.2. Canada
- 10.2.1.3. Rest of North America
- 10.2.2. Europe
- 10.2.2.1. Germany
- 10.2.2.2. France
- 10.2.2.3. United Kingdom
- 10.2.2.4. Italy
- 10.2.2.5. Spain
- 10.2.2.6. NORDIC
- 10.2.2.7. Turkey
- 10.2.2.8. Russia
- 10.2.2.9. Rest of Europe
- 10.2.3. Asia-Pacific
- 10.2.3.1. China
- 10.2.3.2. India
- 10.2.3.3. Australia
- 10.2.3.4. Japan
- 10.2.3.5. Malaysia
- 10.2.3.6. Vietnam
- 10.2.3.7. Thailand
- 10.2.3.8. Indonesia
- 10.2.3.9. Rest of Asia-Pacific
- 10.2.4. South America
- 10.2.4.1. Brazil
- 10.2.4.2. Argentina
- 10.2.4.3. Chile
- 10.2.4.4. Colombia
- 10.2.4.5. Rest of South America
- 10.2.5. Middle-East and Africa
- 10.2.5.1. United Arab Emirates
- 10.2.5.2. Saudi Arabia
- 10.2.5.3. South Africa
- 10.2.5.4. Qatar
- 10.2.5.5. Nigeria
- 10.2.5.6. Egypt
- 10.2.1. North America
- 10.3. Market Analysis, Insights and Forecast - by Market Player Ranking
- 10.1. Market Analysis, Insights and Forecast - by Type
- 11. North America Solar Photovoltaic Wafer Industry Analysis, Insights and Forecast, 2019-2031
- 11.1. Market Analysis, Insights and Forecast - By Country/Sub-region
- 11.1.1 United States
- 11.1.2 Canada
- 11.1.3 Mexico
- 12. Europe Solar Photovoltaic Wafer Industry Analysis, Insights and Forecast, 2019-2031
- 12.1. Market Analysis, Insights and Forecast - By Country/Sub-region
- 12.1.1 Germany
- 12.1.2 United Kingdom
- 12.1.3 France
- 12.1.4 Spain
- 12.1.5 Italy
- 12.1.6 Spain
- 12.1.7 Belgium
- 12.1.8 Netherland
- 12.1.9 Nordics
- 12.1.10 Rest of Europe
- 13. Asia Pacific Solar Photovoltaic Wafer Industry Analysis, Insights and Forecast, 2019-2031
- 13.1. Market Analysis, Insights and Forecast - By Country/Sub-region
- 13.1.1 China
- 13.1.2 Japan
- 13.1.3 India
- 13.1.4 South Korea
- 13.1.5 Southeast Asia
- 13.1.6 Australia
- 13.1.7 Indonesia
- 13.1.8 Phillipes
- 13.1.9 Singapore
- 13.1.10 Thailandc
- 13.1.11 Rest of Asia Pacific
- 14. South America Solar Photovoltaic Wafer Industry Analysis, Insights and Forecast, 2019-2031
- 14.1. Market Analysis, Insights and Forecast - By Country/Sub-region
- 14.1.1 Brazil
- 14.1.2 Argentina
- 14.1.3 Peru
- 14.1.4 Chile
- 14.1.5 Colombia
- 14.1.6 Ecuador
- 14.1.7 Venezuela
- 14.1.8 Rest of South America
- 15. MEA Solar Photovoltaic Wafer Industry Analysis, Insights and Forecast, 2019-2031
- 15.1. Market Analysis, Insights and Forecast - By Country/Sub-region
- 15.1.1 United Arab Emirates
- 15.1.2 Saudi Arabia
- 15.1.3 South Africa
- 15.1.4 Rest of Middle East and Africa
- 16. Competitive Analysis
- 16.1. Global Market Share Analysis 2024
- 16.2. Company Profiles
- 16.2.1 Targray Technology International Inc
- 16.2.1.1. Overview
- 16.2.1.2. Products
- 16.2.1.3. SWOT Analysis
- 16.2.1.4. Recent Developments
- 16.2.1.5. Financials (Based on Availability)
- 16.2.2 Sino-American Silicon Products Inc
- 16.2.2.1. Overview
- 16.2.2.2. Products
- 16.2.2.3. SWOT Analysis
- 16.2.2.4. Recent Developments
- 16.2.2.5. Financials (Based on Availability)
- 16.2.3 CETC Solar Energy Holdings Co
- 16.2.3.1. Overview
- 16.2.3.2. Products
- 16.2.3.3. SWOT Analysis
- 16.2.3.4. Recent Developments
- 16.2.3.5. Financials (Based on Availability)
- 16.2.4 GCL-Poly Energy Holdings Limited
- 16.2.4.1. Overview
- 16.2.4.2. Products
- 16.2.4.3. SWOT Analysis
- 16.2.4.4. Recent Developments
- 16.2.4.5. Financials (Based on Availability)
- 16.2.5 Renewable Energy Corporation
- 16.2.5.1. Overview
- 16.2.5.2. Products
- 16.2.5.3. SWOT Analysis
- 16.2.5.4. Recent Developments
- 16.2.5.5. Financials (Based on Availability)
- 16.2.6 Jinko Solar Holding Co Ltd
- 16.2.6.1. Overview
- 16.2.6.2. Products
- 16.2.6.3. SWOT Analysis
- 16.2.6.4. Recent Developments
- 16.2.6.5. Financials (Based on Availability)
- 16.2.7 JA Solar Holdings Co Ltd
- 16.2.7.1. Overview
- 16.2.7.2. Products
- 16.2.7.3. SWOT Analysis
- 16.2.7.4. Recent Developments
- 16.2.7.5. Financials (Based on Availability)
- 16.2.8 LONGi Green Energy Technology Co Ltd
- 16.2.8.1. Overview
- 16.2.8.2. Products
- 16.2.8.3. SWOT Analysis
- 16.2.8.4. Recent Developments
- 16.2.8.5. Financials (Based on Availability)
- 16.2.1 Targray Technology International Inc
List of Figures
- Figure 1: Global Solar Photovoltaic Wafer Industry Revenue Breakdown (Million, %) by Region 2024 & 2032
- Figure 2: North America Solar Photovoltaic Wafer Industry Revenue (Million), by Country 2024 & 2032
- Figure 3: North America Solar Photovoltaic Wafer Industry Revenue Share (%), by Country 2024 & 2032
- Figure 4: Europe Solar Photovoltaic Wafer Industry Revenue (Million), by Country 2024 & 2032
- Figure 5: Europe Solar Photovoltaic Wafer Industry Revenue Share (%), by Country 2024 & 2032
- Figure 6: Asia Pacific Solar Photovoltaic Wafer Industry Revenue (Million), by Country 2024 & 2032
- Figure 7: Asia Pacific Solar Photovoltaic Wafer Industry Revenue Share (%), by Country 2024 & 2032
- Figure 8: South America Solar Photovoltaic Wafer Industry Revenue (Million), by Country 2024 & 2032
- Figure 9: South America Solar Photovoltaic Wafer Industry Revenue Share (%), by Country 2024 & 2032
- Figure 10: MEA Solar Photovoltaic Wafer Industry Revenue (Million), by Country 2024 & 2032
- Figure 11: MEA Solar Photovoltaic Wafer Industry Revenue Share (%), by Country 2024 & 2032
- Figure 12: North America Solar Photovoltaic Wafer Industry Revenue (Million), by Type 2024 & 2032
- Figure 13: North America Solar Photovoltaic Wafer Industry Revenue Share (%), by Type 2024 & 2032
- Figure 14: North America Solar Photovoltaic Wafer Industry Revenue (Million), by Geogrpahy 2024 & 2032
- Figure 15: North America Solar Photovoltaic Wafer Industry Revenue Share (%), by Geogrpahy 2024 & 2032
- Figure 16: North America Solar Photovoltaic Wafer Industry Revenue (Million), by Market Player Ranking 2024 & 2032
- Figure 17: North America Solar Photovoltaic Wafer Industry Revenue Share (%), by Market Player Ranking 2024 & 2032
- Figure 18: North America Solar Photovoltaic Wafer Industry Revenue (Million), by Country 2024 & 2032
- Figure 19: North America Solar Photovoltaic Wafer Industry Revenue Share (%), by Country 2024 & 2032
- Figure 20: South America Solar Photovoltaic Wafer Industry Revenue (Million), by Type 2024 & 2032
- Figure 21: South America Solar Photovoltaic Wafer Industry Revenue Share (%), by Type 2024 & 2032
- Figure 22: South America Solar Photovoltaic Wafer Industry Revenue (Million), by Geogrpahy 2024 & 2032
- Figure 23: South America Solar Photovoltaic Wafer Industry Revenue Share (%), by Geogrpahy 2024 & 2032
- Figure 24: South America Solar Photovoltaic Wafer Industry Revenue (Million), by Market Player Ranking 2024 & 2032
- Figure 25: South America Solar Photovoltaic Wafer Industry Revenue Share (%), by Market Player Ranking 2024 & 2032
- Figure 26: South America Solar Photovoltaic Wafer Industry Revenue (Million), by Country 2024 & 2032
- Figure 27: South America Solar Photovoltaic Wafer Industry Revenue Share (%), by Country 2024 & 2032
- Figure 28: Europe Solar Photovoltaic Wafer Industry Revenue (Million), by Type 2024 & 2032
- Figure 29: Europe Solar Photovoltaic Wafer Industry Revenue Share (%), by Type 2024 & 2032
- Figure 30: Europe Solar Photovoltaic Wafer Industry Revenue (Million), by Geogrpahy 2024 & 2032
- Figure 31: Europe Solar Photovoltaic Wafer Industry Revenue Share (%), by Geogrpahy 2024 & 2032
- Figure 32: Europe Solar Photovoltaic Wafer Industry Revenue (Million), by Market Player Ranking 2024 & 2032
- Figure 33: Europe Solar Photovoltaic Wafer Industry Revenue Share (%), by Market Player Ranking 2024 & 2032
- Figure 34: Europe Solar Photovoltaic Wafer Industry Revenue (Million), by Country 2024 & 2032
- Figure 35: Europe Solar Photovoltaic Wafer Industry Revenue Share (%), by Country 2024 & 2032
- Figure 36: Middle East & Africa Solar Photovoltaic Wafer Industry Revenue (Million), by Type 2024 & 2032
- Figure 37: Middle East & Africa Solar Photovoltaic Wafer Industry Revenue Share (%), by Type 2024 & 2032
- Figure 38: Middle East & Africa Solar Photovoltaic Wafer Industry Revenue (Million), by Geogrpahy 2024 & 2032
- Figure 39: Middle East & Africa Solar Photovoltaic Wafer Industry Revenue Share (%), by Geogrpahy 2024 & 2032
- Figure 40: Middle East & Africa Solar Photovoltaic Wafer Industry Revenue (Million), by Market Player Ranking 2024 & 2032
- Figure 41: Middle East & Africa Solar Photovoltaic Wafer Industry Revenue Share (%), by Market Player Ranking 2024 & 2032
- Figure 42: Middle East & Africa Solar Photovoltaic Wafer Industry Revenue (Million), by Country 2024 & 2032
- Figure 43: Middle East & Africa Solar Photovoltaic Wafer Industry Revenue Share (%), by Country 2024 & 2032
- Figure 44: Asia Pacific Solar Photovoltaic Wafer Industry Revenue (Million), by Type 2024 & 2032
- Figure 45: Asia Pacific Solar Photovoltaic Wafer Industry Revenue Share (%), by Type 2024 & 2032
- Figure 46: Asia Pacific Solar Photovoltaic Wafer Industry Revenue (Million), by Geogrpahy 2024 & 2032
- Figure 47: Asia Pacific Solar Photovoltaic Wafer Industry Revenue Share (%), by Geogrpahy 2024 & 2032
- Figure 48: Asia Pacific Solar Photovoltaic Wafer Industry Revenue (Million), by Market Player Ranking 2024 & 2032
- Figure 49: Asia Pacific Solar Photovoltaic Wafer Industry Revenue Share (%), by Market Player Ranking 2024 & 2032
- Figure 50: Asia Pacific Solar Photovoltaic Wafer Industry Revenue (Million), by Country 2024 & 2032
- Figure 51: Asia Pacific Solar Photovoltaic Wafer Industry Revenue Share (%), by Country 2024 & 2032
List of Tables
- Table 1: Global Solar Photovoltaic Wafer Industry Revenue Million Forecast, by Region 2019 & 2032
- Table 2: Global Solar Photovoltaic Wafer Industry Revenue Million Forecast, by Type 2019 & 2032
- Table 3: Global Solar Photovoltaic Wafer Industry Revenue Million Forecast, by Geogrpahy 2019 & 2032
- Table 4: Global Solar Photovoltaic Wafer Industry Revenue Million Forecast, by Market Player Ranking 2019 & 2032
- Table 5: Global Solar Photovoltaic Wafer Industry Revenue Million Forecast, by Region 2019 & 2032
- Table 6: Global Solar Photovoltaic Wafer Industry Revenue Million Forecast, by Country 2019 & 2032
- Table 7: United States Solar Photovoltaic Wafer Industry Revenue (Million) Forecast, by Application 2019 & 2032
- Table 8: Canada Solar Photovoltaic Wafer Industry Revenue (Million) Forecast, by Application 2019 & 2032
- Table 9: Mexico Solar Photovoltaic Wafer Industry Revenue (Million) Forecast, by Application 2019 & 2032
- Table 10: Global Solar Photovoltaic Wafer Industry Revenue Million Forecast, by Country 2019 & 2032
- Table 11: Germany Solar Photovoltaic Wafer Industry Revenue (Million) Forecast, by Application 2019 & 2032
- Table 12: United Kingdom Solar Photovoltaic Wafer Industry Revenue (Million) Forecast, by Application 2019 & 2032
- Table 13: France Solar Photovoltaic Wafer Industry Revenue (Million) Forecast, by Application 2019 & 2032
- Table 14: Spain Solar Photovoltaic Wafer Industry Revenue (Million) Forecast, by Application 2019 & 2032
- Table 15: Italy Solar Photovoltaic Wafer Industry Revenue (Million) Forecast, by Application 2019 & 2032
- Table 16: Spain Solar Photovoltaic Wafer Industry Revenue (Million) Forecast, by Application 2019 & 2032
- Table 17: Belgium Solar Photovoltaic Wafer Industry Revenue (Million) Forecast, by Application 2019 & 2032
- Table 18: Netherland Solar Photovoltaic Wafer Industry Revenue (Million) Forecast, by Application 2019 & 2032
- Table 19: Nordics Solar Photovoltaic Wafer Industry Revenue (Million) Forecast, by Application 2019 & 2032
- Table 20: Rest of Europe Solar Photovoltaic Wafer Industry Revenue (Million) Forecast, by Application 2019 & 2032
- Table 21: Global Solar Photovoltaic Wafer Industry Revenue Million Forecast, by Country 2019 & 2032
- Table 22: China Solar Photovoltaic Wafer Industry Revenue (Million) Forecast, by Application 2019 & 2032
- Table 23: Japan Solar Photovoltaic Wafer Industry Revenue (Million) Forecast, by Application 2019 & 2032
- Table 24: India Solar Photovoltaic Wafer Industry Revenue (Million) Forecast, by Application 2019 & 2032
- Table 25: South Korea Solar Photovoltaic Wafer Industry Revenue (Million) Forecast, by Application 2019 & 2032
- Table 26: Southeast Asia Solar Photovoltaic Wafer Industry Revenue (Million) Forecast, by Application 2019 & 2032
- Table 27: Australia Solar Photovoltaic Wafer Industry Revenue (Million) Forecast, by Application 2019 & 2032
- Table 28: Indonesia Solar Photovoltaic Wafer Industry Revenue (Million) Forecast, by Application 2019 & 2032
- Table 29: Phillipes Solar Photovoltaic Wafer Industry Revenue (Million) Forecast, by Application 2019 & 2032
- Table 30: Singapore Solar Photovoltaic Wafer Industry Revenue (Million) Forecast, by Application 2019 & 2032
- Table 31: Thailandc Solar Photovoltaic Wafer Industry Revenue (Million) Forecast, by Application 2019 & 2032
- Table 32: Rest of Asia Pacific Solar Photovoltaic Wafer Industry Revenue (Million) Forecast, by Application 2019 & 2032
- Table 33: Global Solar Photovoltaic Wafer Industry Revenue Million Forecast, by Country 2019 & 2032
- Table 34: Brazil Solar Photovoltaic Wafer Industry Revenue (Million) Forecast, by Application 2019 & 2032
- Table 35: Argentina Solar Photovoltaic Wafer Industry Revenue (Million) Forecast, by Application 2019 & 2032
- Table 36: Peru Solar Photovoltaic Wafer Industry Revenue (Million) Forecast, by Application 2019 & 2032
- Table 37: Chile Solar Photovoltaic Wafer Industry Revenue (Million) Forecast, by Application 2019 & 2032
- Table 38: Colombia Solar Photovoltaic Wafer Industry Revenue (Million) Forecast, by Application 2019 & 2032
- Table 39: Ecuador Solar Photovoltaic Wafer Industry Revenue (Million) Forecast, by Application 2019 & 2032
- Table 40: Venezuela Solar Photovoltaic Wafer Industry Revenue (Million) Forecast, by Application 2019 & 2032
- Table 41: Rest of South America Solar Photovoltaic Wafer Industry Revenue (Million) Forecast, by Application 2019 & 2032
- Table 42: Global Solar Photovoltaic Wafer Industry Revenue Million Forecast, by Country 2019 & 2032
- Table 43: United Arab Emirates Solar Photovoltaic Wafer Industry Revenue (Million) Forecast, by Application 2019 & 2032
- Table 44: Saudi Arabia Solar Photovoltaic Wafer Industry Revenue (Million) Forecast, by Application 2019 & 2032
- Table 45: South Africa Solar Photovoltaic Wafer Industry Revenue (Million) Forecast, by Application 2019 & 2032
- Table 46: Rest of Middle East and Africa Solar Photovoltaic Wafer Industry Revenue (Million) Forecast, by Application 2019 & 2032
- Table 47: Global Solar Photovoltaic Wafer Industry Revenue Million Forecast, by Type 2019 & 2032
- Table 48: Global Solar Photovoltaic Wafer Industry Revenue Million Forecast, by Geogrpahy 2019 & 2032
- Table 49: Global Solar Photovoltaic Wafer Industry Revenue Million Forecast, by Market Player Ranking 2019 & 2032
- Table 50: Global Solar Photovoltaic Wafer Industry Revenue Million Forecast, by Country 2019 & 2032
- Table 51: United States Solar Photovoltaic Wafer Industry Revenue (Million) Forecast, by Application 2019 & 2032
- Table 52: Canada Solar Photovoltaic Wafer Industry Revenue (Million) Forecast, by Application 2019 & 2032
- Table 53: Mexico Solar Photovoltaic Wafer Industry Revenue (Million) Forecast, by Application 2019 & 2032
- Table 54: Global Solar Photovoltaic Wafer Industry Revenue Million Forecast, by Type 2019 & 2032
- Table 55: Global Solar Photovoltaic Wafer Industry Revenue Million Forecast, by Geogrpahy 2019 & 2032
- Table 56: Global Solar Photovoltaic Wafer Industry Revenue Million Forecast, by Market Player Ranking 2019 & 2032
- Table 57: Global Solar Photovoltaic Wafer Industry Revenue Million Forecast, by Country 2019 & 2032
- Table 58: Brazil Solar Photovoltaic Wafer Industry Revenue (Million) Forecast, by Application 2019 & 2032
- Table 59: Argentina Solar Photovoltaic Wafer Industry Revenue (Million) Forecast, by Application 2019 & 2032
- Table 60: Rest of South America Solar Photovoltaic Wafer Industry Revenue (Million) Forecast, by Application 2019 & 2032
- Table 61: Global Solar Photovoltaic Wafer Industry Revenue Million Forecast, by Type 2019 & 2032
- Table 62: Global Solar Photovoltaic Wafer Industry Revenue Million Forecast, by Geogrpahy 2019 & 2032
- Table 63: Global Solar Photovoltaic Wafer Industry Revenue Million Forecast, by Market Player Ranking 2019 & 2032
- Table 64: Global Solar Photovoltaic Wafer Industry Revenue Million Forecast, by Country 2019 & 2032
- Table 65: United Kingdom Solar Photovoltaic Wafer Industry Revenue (Million) Forecast, by Application 2019 & 2032
- Table 66: Germany Solar Photovoltaic Wafer Industry Revenue (Million) Forecast, by Application 2019 & 2032
- Table 67: France Solar Photovoltaic Wafer Industry Revenue (Million) Forecast, by Application 2019 & 2032
- Table 68: Italy Solar Photovoltaic Wafer Industry Revenue (Million) Forecast, by Application 2019 & 2032
- Table 69: Spain Solar Photovoltaic Wafer Industry Revenue (Million) Forecast, by Application 2019 & 2032
- Table 70: Russia Solar Photovoltaic Wafer Industry Revenue (Million) Forecast, by Application 2019 & 2032
- Table 71: Benelux Solar Photovoltaic Wafer Industry Revenue (Million) Forecast, by Application 2019 & 2032
- Table 72: Nordics Solar Photovoltaic Wafer Industry Revenue (Million) Forecast, by Application 2019 & 2032
- Table 73: Rest of Europe Solar Photovoltaic Wafer Industry Revenue (Million) Forecast, by Application 2019 & 2032
- Table 74: Global Solar Photovoltaic Wafer Industry Revenue Million Forecast, by Type 2019 & 2032
- Table 75: Global Solar Photovoltaic Wafer Industry Revenue Million Forecast, by Geogrpahy 2019 & 2032
- Table 76: Global Solar Photovoltaic Wafer Industry Revenue Million Forecast, by Market Player Ranking 2019 & 2032
- Table 77: Global Solar Photovoltaic Wafer Industry Revenue Million Forecast, by Country 2019 & 2032
- Table 78: Turkey Solar Photovoltaic Wafer Industry Revenue (Million) Forecast, by Application 2019 & 2032
- Table 79: Israel Solar Photovoltaic Wafer Industry Revenue (Million) Forecast, by Application 2019 & 2032
- Table 80: GCC Solar Photovoltaic Wafer Industry Revenue (Million) Forecast, by Application 2019 & 2032
- Table 81: North Africa Solar Photovoltaic Wafer Industry Revenue (Million) Forecast, by Application 2019 & 2032
- Table 82: South Africa Solar Photovoltaic Wafer Industry Revenue (Million) Forecast, by Application 2019 & 2032
- Table 83: Rest of Middle East & Africa Solar Photovoltaic Wafer Industry Revenue (Million) Forecast, by Application 2019 & 2032
- Table 84: Global Solar Photovoltaic Wafer Industry Revenue Million Forecast, by Type 2019 & 2032
- Table 85: Global Solar Photovoltaic Wafer Industry Revenue Million Forecast, by Geogrpahy 2019 & 2032
- Table 86: Global Solar Photovoltaic Wafer Industry Revenue Million Forecast, by Market Player Ranking 2019 & 2032
- Table 87: Global Solar Photovoltaic Wafer Industry Revenue Million Forecast, by Country 2019 & 2032
- Table 88: China Solar Photovoltaic Wafer Industry Revenue (Million) Forecast, by Application 2019 & 2032
- Table 89: India Solar Photovoltaic Wafer Industry Revenue (Million) Forecast, by Application 2019 & 2032
- Table 90: Japan Solar Photovoltaic Wafer Industry Revenue (Million) Forecast, by Application 2019 & 2032
- Table 91: South Korea Solar Photovoltaic Wafer Industry Revenue (Million) Forecast, by Application 2019 & 2032
- Table 92: ASEAN Solar Photovoltaic Wafer Industry Revenue (Million) Forecast, by Application 2019 & 2032
- Table 93: Oceania Solar Photovoltaic Wafer Industry Revenue (Million) Forecast, by Application 2019 & 2032
- Table 94: Rest of Asia Pacific Solar Photovoltaic Wafer Industry Revenue (Million) Forecast, by Application 2019 & 2032
Frequently Asked Questions
1. What is the projected Compound Annual Growth Rate (CAGR) of the Solar Photovoltaic Wafer Industry?
The projected CAGR is approximately 13.90%.
2. Which companies are prominent players in the Solar Photovoltaic Wafer Industry?
Key companies in the market include Targray Technology International Inc, Sino-American Silicon Products Inc, CETC Solar Energy Holdings Co, GCL-Poly Energy Holdings Limited, Renewable Energy Corporation, Jinko Solar Holding Co Ltd, JA Solar Holdings Co Ltd, LONGi Green Energy Technology Co Ltd.
3. What are the main segments of the Solar Photovoltaic Wafer Industry?
The market segments include Type, Geogrpahy, Market Player Ranking.
4. Can you provide details about the market size?
The market size is estimated to be USD 14.58 Million as of 2022.
5. What are some drivers contributing to market growth?
4.; Increasing Demand for Renewable Energy4.; Supportive Government Policies.
6. What are the notable trends driving market growth?
Monocrystalline Solar Photovoltaic Wafer is Expected to Dominate the Market.
7. Are there any restraints impacting market growth?
4.; High Cost Compared to Alternatives like Thin Films.
8. Can you provide examples of recent developments in the market?
In June 2023, Solar Wafer manufacturer NexdWafe GmbH secured USD 32 million contract from a group of investors including Reliance New Energy to accelerate the construction of its first commercial scla green solar wafers production facility in Germany Bitterfield.
9. What pricing options are available for accessing the report?
Pricing options include single-user, multi-user, and enterprise licenses priced at USD 4750, USD 5250, and USD 8750 respectively.
10. Is the market size provided in terms of value or volume?
The market size is provided in terms of value, measured in Million.
11. Are there any specific market keywords associated with the report?
Yes, the market keyword associated with the report is "Solar Photovoltaic Wafer Industry," which aids in identifying and referencing the specific market segment covered.
12. How do I determine which pricing option suits my needs best?
The pricing options vary based on user requirements and access needs. Individual users may opt for single-user licenses, while businesses requiring broader access may choose multi-user or enterprise licenses for cost-effective access to the report.
13. Are there any additional resources or data provided in the Solar Photovoltaic Wafer Industry report?
While the report offers comprehensive insights, it's advisable to review the specific contents or supplementary materials provided to ascertain if additional resources or data are available.
14. How can I stay updated on further developments or reports in the Solar Photovoltaic Wafer Industry?
To stay informed about further developments, trends, and reports in the Solar Photovoltaic Wafer Industry, consider subscribing to industry newsletters, following relevant companies and organizations, or regularly checking reputable industry news sources and publications.
Methodology
Step 1 - Identification of Relevant Samples Size from Population Database


Step 2 - Approaches for Defining Global Market Size (Value, Volume* & Price*)

Note*: In applicable scenarios
Step 3 - Data Sources
Primary Research
- Web Analytics
- Survey Reports
- Research Institute
- Latest Research Reports
- Opinion Leaders
Secondary Research
- Annual Reports
- White Paper
- Latest Press Release
- Industry Association
- Paid Database
- Investor Presentations

Step 4 - Data Triangulation
Involves using different sources of information in order to increase the validity of a study
These sources are likely to be stakeholders in a program - participants, other researchers, program staff, other community members, and so on.
Then we put all data in single framework & apply various statistical tools to find out the dynamic on the market.
During the analysis stage, feedback from the stakeholder groups would be compared to determine areas of agreement as well as areas of divergence


