
Key Insights
The Spent Fuel and Nuclear Waste Management industry is experiencing steady growth, driven by the increasing global reliance on nuclear energy and the growing need for safe and sustainable solutions for spent nuclear fuel and radioactive waste disposal. The market's expansion is propelled by stringent government regulations regarding nuclear waste management, rising environmental concerns related to improper disposal, and advancements in technologies such as dry storage, reprocessing, and geological repositories. While the industry faces challenges in terms of high capital expenditures for infrastructure development and the complex nature of handling hazardous materials, the long-term outlook remains positive due to the continuing operation of existing nuclear power plants and the potential for future nuclear energy expansion. The market is witnessing increased adoption of innovative technologies aimed at improving efficiency, reducing costs, and enhancing the safety of waste management processes. Significant investments are being made in research and development to explore advanced solutions, including advanced recycling techniques and the development of more durable and secure geological repositories. This ongoing technological evolution is expected to reshape the industry landscape over the next decade.
The forecast period (2025-2033) anticipates consistent growth, although the CAGR may fluctuate depending on factors such as global political and economic stability, policy changes affecting nuclear energy, and breakthroughs in waste management technologies. Regional variations in market size will likely reflect differences in nuclear energy production levels, regulatory frameworks, and the availability of suitable geological disposal sites. North America and Europe are expected to remain significant markets, though developing nations with expanding nuclear power programs will contribute increasingly to overall market growth. The industry will also continue to see consolidation among key players, further driving innovation and efficiency improvements. Long-term projections suggest a continued need for robust and reliable spent fuel and nuclear waste management solutions, making this a strategically important sector for both public and private investments.
Spent Fuel & Nuclear Waste Management Industry: A Comprehensive Market Report (2019-2033)
This in-depth report provides a comprehensive analysis of the Spent Fuel and Nuclear Waste Management industry, offering actionable insights for industry professionals, investors, and stakeholders. Covering the period 2019-2033, with a base year of 2025, this report examines market dynamics, key players, and future growth potential. The market is segmented by waste type (Low-level, Intermediate-level, High-level), source (Nuclear Fuel Cycle, Radioactive Mining, Research & Industrial, Military, Other), and geographic regions. The report projects a market value exceeding xx Million by 2033.
Spent Fuel And Nuclear Waste Management Industry Market Structure & Innovation Trends
This section analyzes the competitive landscape, innovation drivers, and regulatory influences within the Spent Fuel and Nuclear Waste Management industry. We examine market concentration, identifying key players and their respective market shares. The report further explores M&A activities, including deal values and their impact on market consolidation. Regulatory frameworks and their effect on innovation are also discussed, along with an assessment of substitute products and end-user demographics.
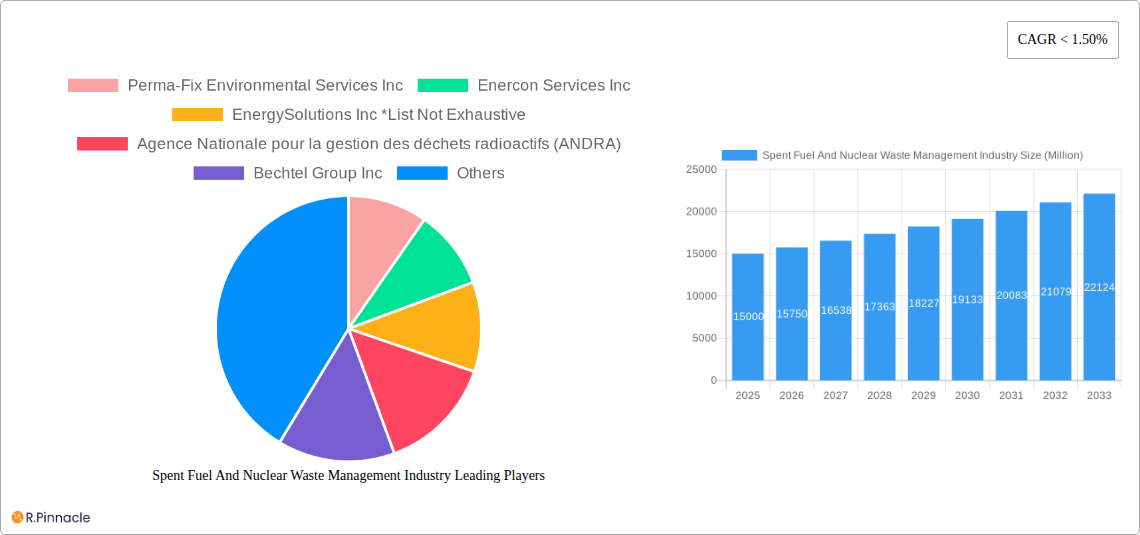
- Market Concentration: The industry exhibits a moderately concentrated structure, with key players including Perma-Fix Environmental Services Inc, Enercon Services Inc, EnergySolutions Inc, Agence Nationale pour la gestion des déchets radioactifs (ANDRA), Bechtel Group Inc, Fluor Corporation, Westinghouse Electric Company LLC (Toshiba), Veolia Environment SA, Augean PLC, and Studsvik AB. However, a significant number of smaller, specialized firms also contribute to the market. Precise market share data will be provided in the full report.
- Innovation Drivers: Growing environmental concerns and stringent regulations are driving innovation in waste treatment technologies, including advanced separation techniques and improved disposal methods. Research and development efforts focus on reducing long-term risks associated with nuclear waste.
- M&A Activity: The industry has witnessed several mergers and acquisitions in recent years, primarily driven by the need for increased operational efficiency and expansion into new geographic markets. The full report will detail specific M&A transactions and their associated valuations, exceeding xx Million in total deal value over the study period.
- Regulatory Frameworks: Government regulations play a significant role in shaping industry practices, impacting both technology adoption and disposal strategies. These regulations vary across different regions, influencing market growth and development.
Spent Fuel And Nuclear Waste Management Industry Market Dynamics & Trends
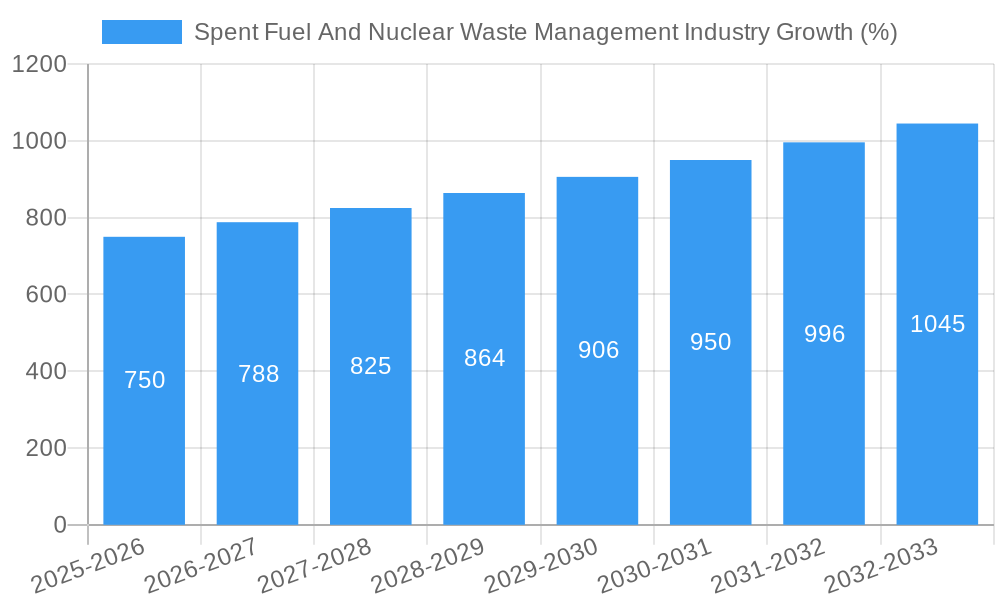
This section examines the key factors influencing market growth, including technological advancements, evolving consumer preferences, and competitive dynamics. The report analyzes market growth drivers, technological disruptions, and competitive strategies employed by key players. Quantifiable metrics such as the Compound Annual Growth Rate (CAGR) and market penetration rates are presented. The forecast period (2025-2033) projects robust growth driven by the increasing volume of nuclear waste generated globally, coupled with stricter environmental regulations and a rising demand for advanced waste management solutions. This will result in a CAGR of xx% during the forecast period, leading to a market size exceeding xx Million by 2033.
Dominant Regions & Segments in Spent Fuel And Nuclear Waste Management Industry
This section identifies the leading regions and segments within the Spent Fuel and Nuclear Waste Management industry. A detailed dominance analysis will be presented, highlighting key factors such as economic policies, infrastructure development, and regulatory environments contributing to regional variations in market growth.
Leading Regions: (Detailed analysis to be included in the full report, highlighting key regions based on waste generation, regulatory frameworks, and industry presence.)
Dominant Segments by Waste Type: The high-level waste segment is expected to dominate due to its complex management requirements and the associated high costs. Further breakdown and analysis for low-level and intermediate-level waste will be provided in the full report.
Dominant Segments by Source: The Nuclear Fuel Cycle segment currently holds the largest market share, followed by the Radioactive Mining, Milling, and Extracting Activities segment. A detailed analysis of the other sources segment (Research, Medical, Industrial, Military, Other) will be presented in the full report.
Key Drivers (Examples):
- Economic Policies: Government incentives and subsidies supporting nuclear waste management initiatives.
- Infrastructure: Availability of adequate disposal facilities and transportation networks.
Spent Fuel And Nuclear Waste Management Industry Product Innovations
This section focuses on recent product developments, applications, and the competitive advantages offered by these innovations. Technological advancements, such as advanced separation techniques and improved container designs, are emphasized, along with their market fit and impact on industry competitiveness. The sector is witnessing innovation in areas like improved vitrification processes, advanced dry storage technologies, and the development of next-generation geological repositories for long-term disposal. These innovations are driven by the need to reduce costs, enhance safety, and minimize environmental impact.
Report Scope & Segmentation Analysis
This report comprehensively segments the Spent Fuel and Nuclear Waste Management market across various parameters, including waste type, source, and geography. Growth projections, market sizes, and competitive dynamics are presented for each segment.
- Waste Type: Low-level waste, intermediate-level waste, and high-level waste segments will be individually analyzed in the full report.
- Source: Each source category (Nuclear Fuel Cycle, Radioactive Mining, Research & Industrial, Military, Other) will be independently assessed within the full report.
Key Drivers of Spent Fuel And Nuclear Waste Management Industry Growth
This section outlines the key factors driving market growth, including technological advancements, supportive government policies, and increasing environmental concerns. Specific examples will be provided, highlighting the role of each driver. Strong regulatory frameworks and growing environmental awareness are major growth drivers. Advancements in waste processing and disposal technologies also contribute significantly to market expansion.
Challenges in the Spent Fuel And Nuclear Waste Management Industry Sector
This section addresses the significant barriers and restraints impacting industry growth. Regulatory hurdles, supply chain issues, and intense competition are discussed, highlighting their quantitative effects on market development. High capital expenditure required for waste processing facilities and the long-term liability associated with waste disposal pose significant challenges. Public perception and acceptance of nuclear waste disposal sites also present obstacles.
Emerging Opportunities in Spent Fuel And Nuclear Waste Management Industry
This section highlights emerging trends and future opportunities within the Spent Fuel and Nuclear Waste Management industry. New market segments, technological advancements, and shifting consumer preferences are examined. The development of innovative recycling techniques and the exploration of alternative disposal methods present significant opportunities for industry players. The growing demand for advanced monitoring and surveillance systems further opens up market avenues.
Leading Players in the Spent Fuel And Nuclear Waste Management Industry Market
- Perma-Fix Environmental Services Inc
- Enercon Services Inc
- EnergySolutions Inc
- Agence Nationale pour la gestion des déchets radioactifs (ANDRA)
- Bechtel Group Inc
- Fluor Corporation
- Westinghouse Electric Company LLC (Toshiba)
- Veolia Environment SA
- Augean PLC
- Studsvik AB
Key Developments in Spent Fuel And Nuclear Waste Management Industry Industry
- August 2020: The US Department of Energy authorized the start of radioactive operations at the Salt Waste Processing Facility (SWPF) at its Savannah River Site (SRS), designed to process 31 million gallons of radioactive salt waste.
- August 2021: German utility companies signed contracts with Orano for the return of German nuclear waste stored at the Orano la Hague plant, exceeding EUR 1 billion in value.
Future Outlook for Spent Fuel And Nuclear Waste Management Industry Market
The future of the Spent Fuel and Nuclear Waste Management market looks promising, driven by factors such as increasing nuclear waste generation, stringent environmental regulations, and advancements in waste management technologies. Strategic partnerships and collaborations will be crucial for market expansion. The industry is expected to witness significant growth, with ongoing technological innovations driving efficiency and cost reduction.
Spent Fuel And Nuclear Waste Management Industry Segmentation
-
1. Type
- 1.1. Low-level Waste
- 1.2. Intermediate-level Waste
- 1.3. High-level Waste
-
2. Source
-
2.1. Nuclear Fuel Cycle
- 2.1.1. Nuclear Power Reactors
- 2.1.2. Radioact
- 2.2. Research, Medical, and Industrial Source
- 2.3. Military and Defense Programs
- 2.4. Other Sources
-
2.1. Nuclear Fuel Cycle
Spent Fuel And Nuclear Waste Management Industry Segmentation By Geography
- 1. North America
- 2. Europe
- 3. Asia Pacific
- 4. South America
- 5. Middle East

Spent Fuel And Nuclear Waste Management Industry REPORT HIGHLIGHTS
| Aspects | Details |
|---|---|
| Study Period | 2019-2033 |
| Base Year | 2024 |
| Estimated Year | 2025 |
| Forecast Period | 2025-2033 |
| Historical Period | 2019-2024 |
| Growth Rate | CAGR of < 1.50% from 2019-2033 |
| Segmentation |
|
Table of Contents
- 1. Introduction
- 1.1. Research Scope
- 1.2. Market Segmentation
- 1.3. Research Methodology
- 1.4. Definitions and Assumptions
- 2. Executive Summary
- 2.1. Introduction
- 3. Market Dynamics
- 3.1. Introduction
- 3.2. Market Drivers
- 3.2.1. 4.; Increasing Infrastructure Development4.; Rising Emphasis Water and Wastewater Management
- 3.3. Market Restrains
- 3.3.1. 4.; Volatility in Raw Material Prices
- 3.4. Market Trends
- 3.4.1. Low-level Waste Expected to Dominate the Market
- 4. Market Factor Analysis
- 4.1. Porters Five Forces
- 4.2. Supply/Value Chain
- 4.3. PESTEL analysis
- 4.4. Market Entropy
- 4.5. Patent/Trademark Analysis
- 5. Global Spent Fuel And Nuclear Waste Management Industry Analysis, Insights and Forecast, 2019-2031
- 5.1. Market Analysis, Insights and Forecast - by Type
- 5.1.1. Low-level Waste
- 5.1.2. Intermediate-level Waste
- 5.1.3. High-level Waste
- 5.2. Market Analysis, Insights and Forecast - by Source
- 5.2.1. Nuclear Fuel Cycle
- 5.2.1.1. Nuclear Power Reactors
- 5.2.1.2. Radioact
- 5.2.2. Research, Medical, and Industrial Source
- 5.2.3. Military and Defense Programs
- 5.2.4. Other Sources
- 5.2.1. Nuclear Fuel Cycle
- 5.3. Market Analysis, Insights and Forecast - by Region
- 5.3.1. North America
- 5.3.2. Europe
- 5.3.3. Asia Pacific
- 5.3.4. South America
- 5.3.5. Middle East
- 5.1. Market Analysis, Insights and Forecast - by Type
- 6. North America Spent Fuel And Nuclear Waste Management Industry Analysis, Insights and Forecast, 2019-2031
- 6.1. Market Analysis, Insights and Forecast - by Type
- 6.1.1. Low-level Waste
- 6.1.2. Intermediate-level Waste
- 6.1.3. High-level Waste
- 6.2. Market Analysis, Insights and Forecast - by Source
- 6.2.1. Nuclear Fuel Cycle
- 6.2.1.1. Nuclear Power Reactors
- 6.2.1.2. Radioact
- 6.2.2. Research, Medical, and Industrial Source
- 6.2.3. Military and Defense Programs
- 6.2.4. Other Sources
- 6.2.1. Nuclear Fuel Cycle
- 6.1. Market Analysis, Insights and Forecast - by Type
- 7. Europe Spent Fuel And Nuclear Waste Management Industry Analysis, Insights and Forecast, 2019-2031
- 7.1. Market Analysis, Insights and Forecast - by Type
- 7.1.1. Low-level Waste
- 7.1.2. Intermediate-level Waste
- 7.1.3. High-level Waste
- 7.2. Market Analysis, Insights and Forecast - by Source
- 7.2.1. Nuclear Fuel Cycle
- 7.2.1.1. Nuclear Power Reactors
- 7.2.1.2. Radioact
- 7.2.2. Research, Medical, and Industrial Source
- 7.2.3. Military and Defense Programs
- 7.2.4. Other Sources
- 7.2.1. Nuclear Fuel Cycle
- 7.1. Market Analysis, Insights and Forecast - by Type
- 8. Asia Pacific Spent Fuel And Nuclear Waste Management Industry Analysis, Insights and Forecast, 2019-2031
- 8.1. Market Analysis, Insights and Forecast - by Type
- 8.1.1. Low-level Waste
- 8.1.2. Intermediate-level Waste
- 8.1.3. High-level Waste
- 8.2. Market Analysis, Insights and Forecast - by Source
- 8.2.1. Nuclear Fuel Cycle
- 8.2.1.1. Nuclear Power Reactors
- 8.2.1.2. Radioact
- 8.2.2. Research, Medical, and Industrial Source
- 8.2.3. Military and Defense Programs
- 8.2.4. Other Sources
- 8.2.1. Nuclear Fuel Cycle
- 8.1. Market Analysis, Insights and Forecast - by Type
- 9. South America Spent Fuel And Nuclear Waste Management Industry Analysis, Insights and Forecast, 2019-2031
- 9.1. Market Analysis, Insights and Forecast - by Type
- 9.1.1. Low-level Waste
- 9.1.2. Intermediate-level Waste
- 9.1.3. High-level Waste
- 9.2. Market Analysis, Insights and Forecast - by Source
- 9.2.1. Nuclear Fuel Cycle
- 9.2.1.1. Nuclear Power Reactors
- 9.2.1.2. Radioact
- 9.2.2. Research, Medical, and Industrial Source
- 9.2.3. Military and Defense Programs
- 9.2.4. Other Sources
- 9.2.1. Nuclear Fuel Cycle
- 9.1. Market Analysis, Insights and Forecast - by Type
- 10. Middle East Spent Fuel And Nuclear Waste Management Industry Analysis, Insights and Forecast, 2019-2031
- 10.1. Market Analysis, Insights and Forecast - by Type
- 10.1.1. Low-level Waste
- 10.1.2. Intermediate-level Waste
- 10.1.3. High-level Waste
- 10.2. Market Analysis, Insights and Forecast - by Source
- 10.2.1. Nuclear Fuel Cycle
- 10.2.1.1. Nuclear Power Reactors
- 10.2.1.2. Radioact
- 10.2.2. Research, Medical, and Industrial Source
- 10.2.3. Military and Defense Programs
- 10.2.4. Other Sources
- 10.2.1. Nuclear Fuel Cycle
- 10.1. Market Analysis, Insights and Forecast - by Type
- 11. North America Spent Fuel And Nuclear Waste Management Industry Analysis, Insights and Forecast, 2019-2031
- 11.1. Market Analysis, Insights and Forecast - By Country/Sub-region
- 11.1.1 United States
- 11.1.2 Canada
- 11.1.3 Mexico
- 12. Europe Spent Fuel And Nuclear Waste Management Industry Analysis, Insights and Forecast, 2019-2031
- 12.1. Market Analysis, Insights and Forecast - By Country/Sub-region
- 12.1.1 Germany
- 12.1.2 United Kingdom
- 12.1.3 France
- 12.1.4 Spain
- 12.1.5 Italy
- 12.1.6 Spain
- 12.1.7 Belgium
- 12.1.8 Netherland
- 12.1.9 Nordics
- 12.1.10 Rest of Europe
- 13. Asia Pacific Spent Fuel And Nuclear Waste Management Industry Analysis, Insights and Forecast, 2019-2031
- 13.1. Market Analysis, Insights and Forecast - By Country/Sub-region
- 13.1.1 China
- 13.1.2 Japan
- 13.1.3 India
- 13.1.4 South Korea
- 13.1.5 Southeast Asia
- 13.1.6 Australia
- 13.1.7 Indonesia
- 13.1.8 Phillipes
- 13.1.9 Singapore
- 13.1.10 Thailandc
- 13.1.11 Rest of Asia Pacific
- 14. South America Spent Fuel And Nuclear Waste Management Industry Analysis, Insights and Forecast, 2019-2031
- 14.1. Market Analysis, Insights and Forecast - By Country/Sub-region
- 14.1.1 Brazil
- 14.1.2 Argentina
- 14.1.3 Peru
- 14.1.4 Chile
- 14.1.5 Colombia
- 14.1.6 Ecuador
- 14.1.7 Venezuela
- 14.1.8 Rest of South America
- 15. North America Spent Fuel And Nuclear Waste Management Industry Analysis, Insights and Forecast, 2019-2031
- 15.1. Market Analysis, Insights and Forecast - By Country/Sub-region
- 15.1.1 United States
- 15.1.2 Canada
- 15.1.3 Mexico
- 16. MEA Spent Fuel And Nuclear Waste Management Industry Analysis, Insights and Forecast, 2019-2031
- 16.1. Market Analysis, Insights and Forecast - By Country/Sub-region
- 16.1.1 United Arab Emirates
- 16.1.2 Saudi Arabia
- 16.1.3 South Africa
- 16.1.4 Rest of Middle East and Africa
- 17. Competitive Analysis
- 17.1. Global Market Share Analysis 2024
- 17.2. Company Profiles
- 17.2.1 Perma-Fix Environmental Services Inc
- 17.2.1.1. Overview
- 17.2.1.2. Products
- 17.2.1.3. SWOT Analysis
- 17.2.1.4. Recent Developments
- 17.2.1.5. Financials (Based on Availability)
- 17.2.2 Enercon Services Inc
- 17.2.2.1. Overview
- 17.2.2.2. Products
- 17.2.2.3. SWOT Analysis
- 17.2.2.4. Recent Developments
- 17.2.2.5. Financials (Based on Availability)
- 17.2.3 EnergySolutions Inc *List Not Exhaustive
- 17.2.3.1. Overview
- 17.2.3.2. Products
- 17.2.3.3. SWOT Analysis
- 17.2.3.4. Recent Developments
- 17.2.3.5. Financials (Based on Availability)
- 17.2.4 Agence Nationale pour la gestion des déchets radioactifs (ANDRA)
- 17.2.4.1. Overview
- 17.2.4.2. Products
- 17.2.4.3. SWOT Analysis
- 17.2.4.4. Recent Developments
- 17.2.4.5. Financials (Based on Availability)
- 17.2.5 Bechtel Group Inc
- 17.2.5.1. Overview
- 17.2.5.2. Products
- 17.2.5.3. SWOT Analysis
- 17.2.5.4. Recent Developments
- 17.2.5.5. Financials (Based on Availability)
- 17.2.6 Fluor Corporation
- 17.2.6.1. Overview
- 17.2.6.2. Products
- 17.2.6.3. SWOT Analysis
- 17.2.6.4. Recent Developments
- 17.2.6.5. Financials (Based on Availability)
- 17.2.7 Westinghouse Electric Company LLC (Toshiba)
- 17.2.7.1. Overview
- 17.2.7.2. Products
- 17.2.7.3. SWOT Analysis
- 17.2.7.4. Recent Developments
- 17.2.7.5. Financials (Based on Availability)
- 17.2.8 Veolia Environment SA
- 17.2.8.1. Overview
- 17.2.8.2. Products
- 17.2.8.3. SWOT Analysis
- 17.2.8.4. Recent Developments
- 17.2.8.5. Financials (Based on Availability)
- 17.2.9 Augean PLC
- 17.2.9.1. Overview
- 17.2.9.2. Products
- 17.2.9.3. SWOT Analysis
- 17.2.9.4. Recent Developments
- 17.2.9.5. Financials (Based on Availability)
- 17.2.10 Studsvik AB
- 17.2.10.1. Overview
- 17.2.10.2. Products
- 17.2.10.3. SWOT Analysis
- 17.2.10.4. Recent Developments
- 17.2.10.5. Financials (Based on Availability)
- 17.2.1 Perma-Fix Environmental Services Inc
List of Figures
- Figure 1: Global Spent Fuel And Nuclear Waste Management Industry Revenue Breakdown (Million, %) by Region 2024 & 2032
- Figure 2: North America Spent Fuel And Nuclear Waste Management Industry Revenue (Million), by Country 2024 & 2032
- Figure 3: North America Spent Fuel And Nuclear Waste Management Industry Revenue Share (%), by Country 2024 & 2032
- Figure 4: Europe Spent Fuel And Nuclear Waste Management Industry Revenue (Million), by Country 2024 & 2032
- Figure 5: Europe Spent Fuel And Nuclear Waste Management Industry Revenue Share (%), by Country 2024 & 2032
- Figure 6: Asia Pacific Spent Fuel And Nuclear Waste Management Industry Revenue (Million), by Country 2024 & 2032
- Figure 7: Asia Pacific Spent Fuel And Nuclear Waste Management Industry Revenue Share (%), by Country 2024 & 2032
- Figure 8: South America Spent Fuel And Nuclear Waste Management Industry Revenue (Million), by Country 2024 & 2032
- Figure 9: South America Spent Fuel And Nuclear Waste Management Industry Revenue Share (%), by Country 2024 & 2032
- Figure 10: North America Spent Fuel And Nuclear Waste Management Industry Revenue (Million), by Country 2024 & 2032
- Figure 11: North America Spent Fuel And Nuclear Waste Management Industry Revenue Share (%), by Country 2024 & 2032
- Figure 12: MEA Spent Fuel And Nuclear Waste Management Industry Revenue (Million), by Country 2024 & 2032
- Figure 13: MEA Spent Fuel And Nuclear Waste Management Industry Revenue Share (%), by Country 2024 & 2032
- Figure 14: North America Spent Fuel And Nuclear Waste Management Industry Revenue (Million), by Type 2024 & 2032
- Figure 15: North America Spent Fuel And Nuclear Waste Management Industry Revenue Share (%), by Type 2024 & 2032
- Figure 16: North America Spent Fuel And Nuclear Waste Management Industry Revenue (Million), by Source 2024 & 2032
- Figure 17: North America Spent Fuel And Nuclear Waste Management Industry Revenue Share (%), by Source 2024 & 2032
- Figure 18: North America Spent Fuel And Nuclear Waste Management Industry Revenue (Million), by Country 2024 & 2032
- Figure 19: North America Spent Fuel And Nuclear Waste Management Industry Revenue Share (%), by Country 2024 & 2032
- Figure 20: Europe Spent Fuel And Nuclear Waste Management Industry Revenue (Million), by Type 2024 & 2032
- Figure 21: Europe Spent Fuel And Nuclear Waste Management Industry Revenue Share (%), by Type 2024 & 2032
- Figure 22: Europe Spent Fuel And Nuclear Waste Management Industry Revenue (Million), by Source 2024 & 2032
- Figure 23: Europe Spent Fuel And Nuclear Waste Management Industry Revenue Share (%), by Source 2024 & 2032
- Figure 24: Europe Spent Fuel And Nuclear Waste Management Industry Revenue (Million), by Country 2024 & 2032
- Figure 25: Europe Spent Fuel And Nuclear Waste Management Industry Revenue Share (%), by Country 2024 & 2032
- Figure 26: Asia Pacific Spent Fuel And Nuclear Waste Management Industry Revenue (Million), by Type 2024 & 2032
- Figure 27: Asia Pacific Spent Fuel And Nuclear Waste Management Industry Revenue Share (%), by Type 2024 & 2032
- Figure 28: Asia Pacific Spent Fuel And Nuclear Waste Management Industry Revenue (Million), by Source 2024 & 2032
- Figure 29: Asia Pacific Spent Fuel And Nuclear Waste Management Industry Revenue Share (%), by Source 2024 & 2032
- Figure 30: Asia Pacific Spent Fuel And Nuclear Waste Management Industry Revenue (Million), by Country 2024 & 2032
- Figure 31: Asia Pacific Spent Fuel And Nuclear Waste Management Industry Revenue Share (%), by Country 2024 & 2032
- Figure 32: South America Spent Fuel And Nuclear Waste Management Industry Revenue (Million), by Type 2024 & 2032
- Figure 33: South America Spent Fuel And Nuclear Waste Management Industry Revenue Share (%), by Type 2024 & 2032
- Figure 34: South America Spent Fuel And Nuclear Waste Management Industry Revenue (Million), by Source 2024 & 2032
- Figure 35: South America Spent Fuel And Nuclear Waste Management Industry Revenue Share (%), by Source 2024 & 2032
- Figure 36: South America Spent Fuel And Nuclear Waste Management Industry Revenue (Million), by Country 2024 & 2032
- Figure 37: South America Spent Fuel And Nuclear Waste Management Industry Revenue Share (%), by Country 2024 & 2032
- Figure 38: Middle East Spent Fuel And Nuclear Waste Management Industry Revenue (Million), by Type 2024 & 2032
- Figure 39: Middle East Spent Fuel And Nuclear Waste Management Industry Revenue Share (%), by Type 2024 & 2032
- Figure 40: Middle East Spent Fuel And Nuclear Waste Management Industry Revenue (Million), by Source 2024 & 2032
- Figure 41: Middle East Spent Fuel And Nuclear Waste Management Industry Revenue Share (%), by Source 2024 & 2032
- Figure 42: Middle East Spent Fuel And Nuclear Waste Management Industry Revenue (Million), by Country 2024 & 2032
- Figure 43: Middle East Spent Fuel And Nuclear Waste Management Industry Revenue Share (%), by Country 2024 & 2032
List of Tables
- Table 1: Global Spent Fuel And Nuclear Waste Management Industry Revenue Million Forecast, by Region 2019 & 2032
- Table 2: Global Spent Fuel And Nuclear Waste Management Industry Revenue Million Forecast, by Type 2019 & 2032
- Table 3: Global Spent Fuel And Nuclear Waste Management Industry Revenue Million Forecast, by Source 2019 & 2032
- Table 4: Global Spent Fuel And Nuclear Waste Management Industry Revenue Million Forecast, by Region 2019 & 2032
- Table 5: Global Spent Fuel And Nuclear Waste Management Industry Revenue Million Forecast, by Country 2019 & 2032
- Table 6: United States Spent Fuel And Nuclear Waste Management Industry Revenue (Million) Forecast, by Application 2019 & 2032
- Table 7: Canada Spent Fuel And Nuclear Waste Management Industry Revenue (Million) Forecast, by Application 2019 & 2032
- Table 8: Mexico Spent Fuel And Nuclear Waste Management Industry Revenue (Million) Forecast, by Application 2019 & 2032
- Table 9: Global Spent Fuel And Nuclear Waste Management Industry Revenue Million Forecast, by Country 2019 & 2032
- Table 10: Germany Spent Fuel And Nuclear Waste Management Industry Revenue (Million) Forecast, by Application 2019 & 2032
- Table 11: United Kingdom Spent Fuel And Nuclear Waste Management Industry Revenue (Million) Forecast, by Application 2019 & 2032
- Table 12: France Spent Fuel And Nuclear Waste Management Industry Revenue (Million) Forecast, by Application 2019 & 2032
- Table 13: Spain Spent Fuel And Nuclear Waste Management Industry Revenue (Million) Forecast, by Application 2019 & 2032
- Table 14: Italy Spent Fuel And Nuclear Waste Management Industry Revenue (Million) Forecast, by Application 2019 & 2032
- Table 15: Spain Spent Fuel And Nuclear Waste Management Industry Revenue (Million) Forecast, by Application 2019 & 2032
- Table 16: Belgium Spent Fuel And Nuclear Waste Management Industry Revenue (Million) Forecast, by Application 2019 & 2032
- Table 17: Netherland Spent Fuel And Nuclear Waste Management Industry Revenue (Million) Forecast, by Application 2019 & 2032
- Table 18: Nordics Spent Fuel And Nuclear Waste Management Industry Revenue (Million) Forecast, by Application 2019 & 2032
- Table 19: Rest of Europe Spent Fuel And Nuclear Waste Management Industry Revenue (Million) Forecast, by Application 2019 & 2032
- Table 20: Global Spent Fuel And Nuclear Waste Management Industry Revenue Million Forecast, by Country 2019 & 2032
- Table 21: China Spent Fuel And Nuclear Waste Management Industry Revenue (Million) Forecast, by Application 2019 & 2032
- Table 22: Japan Spent Fuel And Nuclear Waste Management Industry Revenue (Million) Forecast, by Application 2019 & 2032
- Table 23: India Spent Fuel And Nuclear Waste Management Industry Revenue (Million) Forecast, by Application 2019 & 2032
- Table 24: South Korea Spent Fuel And Nuclear Waste Management Industry Revenue (Million) Forecast, by Application 2019 & 2032
- Table 25: Southeast Asia Spent Fuel And Nuclear Waste Management Industry Revenue (Million) Forecast, by Application 2019 & 2032
- Table 26: Australia Spent Fuel And Nuclear Waste Management Industry Revenue (Million) Forecast, by Application 2019 & 2032
- Table 27: Indonesia Spent Fuel And Nuclear Waste Management Industry Revenue (Million) Forecast, by Application 2019 & 2032
- Table 28: Phillipes Spent Fuel And Nuclear Waste Management Industry Revenue (Million) Forecast, by Application 2019 & 2032
- Table 29: Singapore Spent Fuel And Nuclear Waste Management Industry Revenue (Million) Forecast, by Application 2019 & 2032
- Table 30: Thailandc Spent Fuel And Nuclear Waste Management Industry Revenue (Million) Forecast, by Application 2019 & 2032
- Table 31: Rest of Asia Pacific Spent Fuel And Nuclear Waste Management Industry Revenue (Million) Forecast, by Application 2019 & 2032
- Table 32: Global Spent Fuel And Nuclear Waste Management Industry Revenue Million Forecast, by Country 2019 & 2032
- Table 33: Brazil Spent Fuel And Nuclear Waste Management Industry Revenue (Million) Forecast, by Application 2019 & 2032
- Table 34: Argentina Spent Fuel And Nuclear Waste Management Industry Revenue (Million) Forecast, by Application 2019 & 2032
- Table 35: Peru Spent Fuel And Nuclear Waste Management Industry Revenue (Million) Forecast, by Application 2019 & 2032
- Table 36: Chile Spent Fuel And Nuclear Waste Management Industry Revenue (Million) Forecast, by Application 2019 & 2032
- Table 37: Colombia Spent Fuel And Nuclear Waste Management Industry Revenue (Million) Forecast, by Application 2019 & 2032
- Table 38: Ecuador Spent Fuel And Nuclear Waste Management Industry Revenue (Million) Forecast, by Application 2019 & 2032
- Table 39: Venezuela Spent Fuel And Nuclear Waste Management Industry Revenue (Million) Forecast, by Application 2019 & 2032
- Table 40: Rest of South America Spent Fuel And Nuclear Waste Management Industry Revenue (Million) Forecast, by Application 2019 & 2032
- Table 41: Global Spent Fuel And Nuclear Waste Management Industry Revenue Million Forecast, by Country 2019 & 2032
- Table 42: United States Spent Fuel And Nuclear Waste Management Industry Revenue (Million) Forecast, by Application 2019 & 2032
- Table 43: Canada Spent Fuel And Nuclear Waste Management Industry Revenue (Million) Forecast, by Application 2019 & 2032
- Table 44: Mexico Spent Fuel And Nuclear Waste Management Industry Revenue (Million) Forecast, by Application 2019 & 2032
- Table 45: Global Spent Fuel And Nuclear Waste Management Industry Revenue Million Forecast, by Country 2019 & 2032
- Table 46: United Arab Emirates Spent Fuel And Nuclear Waste Management Industry Revenue (Million) Forecast, by Application 2019 & 2032
- Table 47: Saudi Arabia Spent Fuel And Nuclear Waste Management Industry Revenue (Million) Forecast, by Application 2019 & 2032
- Table 48: South Africa Spent Fuel And Nuclear Waste Management Industry Revenue (Million) Forecast, by Application 2019 & 2032
- Table 49: Rest of Middle East and Africa Spent Fuel And Nuclear Waste Management Industry Revenue (Million) Forecast, by Application 2019 & 2032
- Table 50: Global Spent Fuel And Nuclear Waste Management Industry Revenue Million Forecast, by Type 2019 & 2032
- Table 51: Global Spent Fuel And Nuclear Waste Management Industry Revenue Million Forecast, by Source 2019 & 2032
- Table 52: Global Spent Fuel And Nuclear Waste Management Industry Revenue Million Forecast, by Country 2019 & 2032
- Table 53: Global Spent Fuel And Nuclear Waste Management Industry Revenue Million Forecast, by Type 2019 & 2032
- Table 54: Global Spent Fuel And Nuclear Waste Management Industry Revenue Million Forecast, by Source 2019 & 2032
- Table 55: Global Spent Fuel And Nuclear Waste Management Industry Revenue Million Forecast, by Country 2019 & 2032
- Table 56: Global Spent Fuel And Nuclear Waste Management Industry Revenue Million Forecast, by Type 2019 & 2032
- Table 57: Global Spent Fuel And Nuclear Waste Management Industry Revenue Million Forecast, by Source 2019 & 2032
- Table 58: Global Spent Fuel And Nuclear Waste Management Industry Revenue Million Forecast, by Country 2019 & 2032
- Table 59: Global Spent Fuel And Nuclear Waste Management Industry Revenue Million Forecast, by Type 2019 & 2032
- Table 60: Global Spent Fuel And Nuclear Waste Management Industry Revenue Million Forecast, by Source 2019 & 2032
- Table 61: Global Spent Fuel And Nuclear Waste Management Industry Revenue Million Forecast, by Country 2019 & 2032
- Table 62: Global Spent Fuel And Nuclear Waste Management Industry Revenue Million Forecast, by Type 2019 & 2032
- Table 63: Global Spent Fuel And Nuclear Waste Management Industry Revenue Million Forecast, by Source 2019 & 2032
- Table 64: Global Spent Fuel And Nuclear Waste Management Industry Revenue Million Forecast, by Country 2019 & 2032
Frequently Asked Questions
1. What is the projected Compound Annual Growth Rate (CAGR) of the Spent Fuel And Nuclear Waste Management Industry?
The projected CAGR is approximately < 1.50%.
2. Which companies are prominent players in the Spent Fuel And Nuclear Waste Management Industry?
Key companies in the market include Perma-Fix Environmental Services Inc, Enercon Services Inc, EnergySolutions Inc *List Not Exhaustive, Agence Nationale pour la gestion des déchets radioactifs (ANDRA), Bechtel Group Inc, Fluor Corporation, Westinghouse Electric Company LLC (Toshiba), Veolia Environment SA, Augean PLC, Studsvik AB.
3. What are the main segments of the Spent Fuel And Nuclear Waste Management Industry?
The market segments include Type, Source.
4. Can you provide details about the market size?
The market size is estimated to be USD XX Million as of 2022.
5. What are some drivers contributing to market growth?
4.; Increasing Infrastructure Development4.; Rising Emphasis Water and Wastewater Management.
6. What are the notable trends driving market growth?
Low-level Waste Expected to Dominate the Market.
7. Are there any restraints impacting market growth?
4.; Volatility in Raw Material Prices.
8. Can you provide examples of recent developments in the market?
The US Department of Energy, in August 2020, announced that it authorized the start of radioactive operations at the Salt Waste Processing Facility (SWPF) at its Savannah River Site (SRS). The first-of-a-kind facility is expected to process 31 million gallons of radioactive salt waste currently stored in underground tanks at the South Carolina location. The facility was designed and built and initially expected to be operated by Parsons Corporation. It is further expected to start normal operations later this year after hot commissioning is complete.
9. What pricing options are available for accessing the report?
Pricing options include single-user, multi-user, and enterprise licenses priced at USD 4750, USD 5250, and USD 8750 respectively.
10. Is the market size provided in terms of value or volume?
The market size is provided in terms of value, measured in Million.
11. Are there any specific market keywords associated with the report?
Yes, the market keyword associated with the report is "Spent Fuel And Nuclear Waste Management Industry," which aids in identifying and referencing the specific market segment covered.
12. How do I determine which pricing option suits my needs best?
The pricing options vary based on user requirements and access needs. Individual users may opt for single-user licenses, while businesses requiring broader access may choose multi-user or enterprise licenses for cost-effective access to the report.
13. Are there any additional resources or data provided in the Spent Fuel And Nuclear Waste Management Industry report?
While the report offers comprehensive insights, it's advisable to review the specific contents or supplementary materials provided to ascertain if additional resources or data are available.
14. How can I stay updated on further developments or reports in the Spent Fuel And Nuclear Waste Management Industry?
To stay informed about further developments, trends, and reports in the Spent Fuel And Nuclear Waste Management Industry, consider subscribing to industry newsletters, following relevant companies and organizations, or regularly checking reputable industry news sources and publications.
Methodology
Step 1 - Identification of Relevant Samples Size from Population Database


Step 2 - Approaches for Defining Global Market Size (Value, Volume* & Price*)

Note*: In applicable scenarios
Step 3 - Data Sources
Primary Research
- Web Analytics
- Survey Reports
- Research Institute
- Latest Research Reports
- Opinion Leaders
Secondary Research
- Annual Reports
- White Paper
- Latest Press Release
- Industry Association
- Paid Database
- Investor Presentations

Step 4 - Data Triangulation
Involves using different sources of information in order to increase the validity of a study
These sources are likely to be stakeholders in a program - participants, other researchers, program staff, other community members, and so on.
Then we put all data in single framework & apply various statistical tools to find out the dynamic on the market.
During the analysis stage, feedback from the stakeholder groups would be compared to determine areas of agreement as well as areas of divergence


