
Key Insights
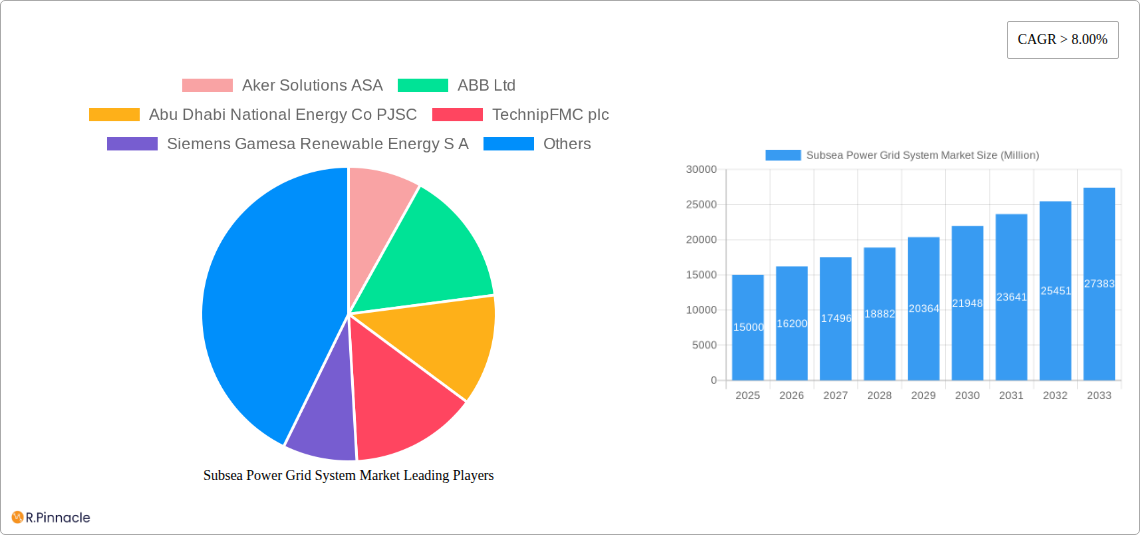
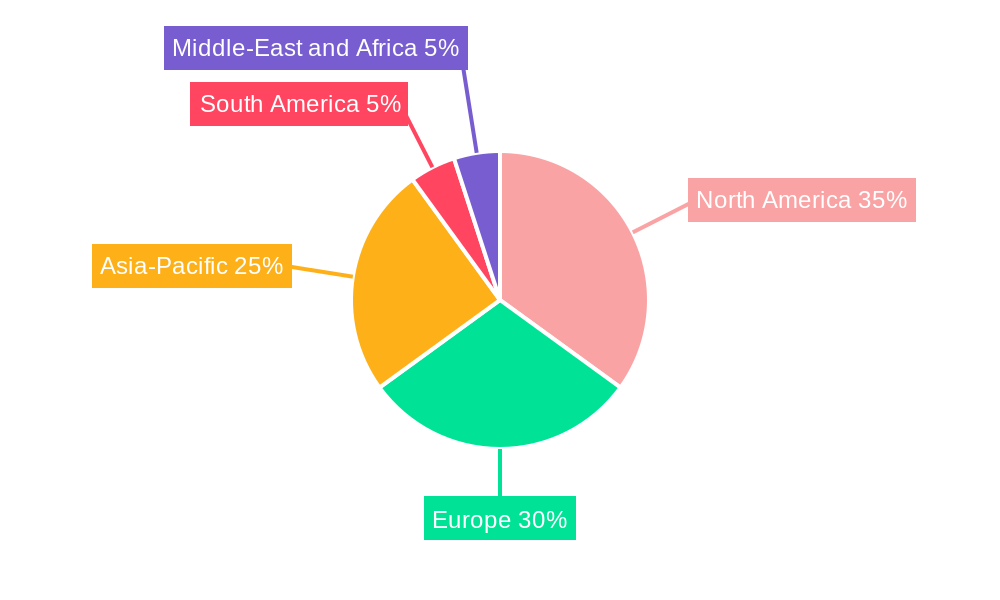
The Subsea Power Grid System market is experiencing robust growth, driven by the increasing demand for renewable energy sources, particularly offshore wind farms. The market's Compound Annual Growth Rate (CAGR) exceeding 8% from 2019 to 2024 indicates a significant upward trajectory. This expansion is fueled by several key factors: the need for efficient and reliable power transmission from offshore wind farms to onshore grids, stringent environmental regulations promoting cleaner energy solutions, and advancements in subsea cable technology improving transmission capacity and longevity. North America and Europe currently hold significant market shares, owing to established offshore wind energy infrastructure and supportive government policies. However, the Asia-Pacific region is projected to witness the fastest growth in the coming years, driven by massive investments in offshore wind projects in countries like China, Japan, and India. The market is segmented by power generation type (captive generation, wind energy, others) and geography, reflecting diverse applications and regional development disparities. Key players like Aker Solutions, ABB, Siemens Gamesa, and General Electric are actively shaping the market through technological innovation and strategic partnerships. The market's restraints include high initial investment costs, complex installation processes, and the challenges associated with maintaining and repairing subsea infrastructure in harsh marine environments.
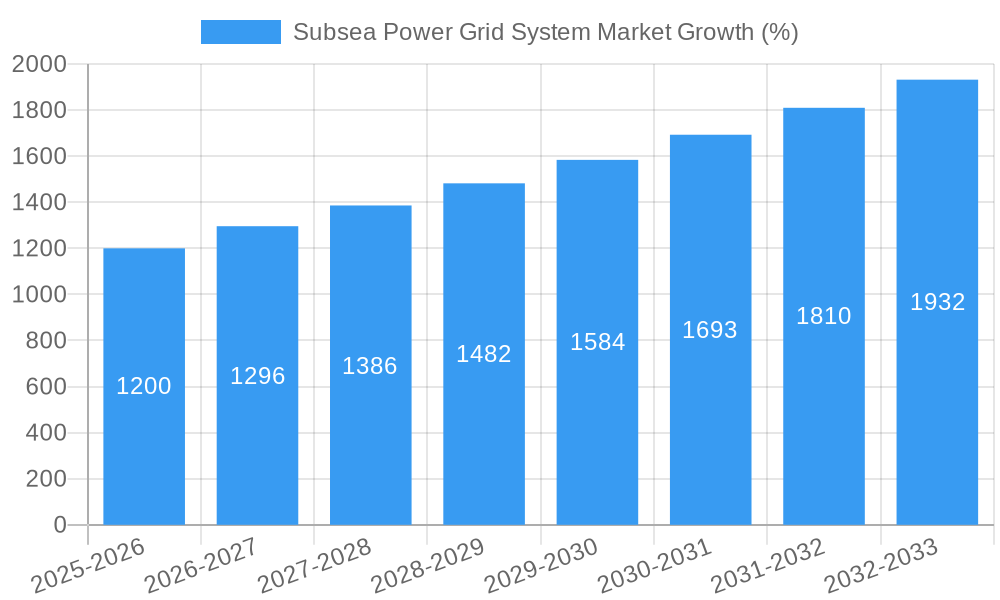
Despite these challenges, the long-term outlook for the Subsea Power Grid System market remains positive. The continuous expansion of offshore wind capacity globally, coupled with technological advancements leading to cost reductions and improved reliability, is expected to drive sustained market growth throughout the forecast period (2025-2033). Government incentives and supportive regulatory frameworks in various regions are further bolstering market expansion. Competition among key players is expected to intensify, leading to innovation and further cost optimization within the industry. Focus on developing sustainable and environmentally friendly subsea power grid solutions will be crucial for long-term market success. The market is expected to see significant value creation during the forecast period, with consistent growth driven by the factors outlined above.
Subsea Power Grid System Market Report: 2019-2033
This comprehensive report provides an in-depth analysis of the Subsea Power Grid System market, offering invaluable insights for industry professionals, investors, and strategic decision-makers. Covering the period 2019-2033, with a focus on 2025, this report meticulously examines market dynamics, technological advancements, regional variations, and key players shaping this rapidly evolving sector. The market is projected to reach xx Million by 2033, exhibiting a robust CAGR of xx% during the forecast period (2025-2033).
Subsea Power Grid System Market Structure & Innovation Trends
This section analyzes the competitive landscape of the subsea power grid system market, encompassing market concentration, innovation drivers, regulatory frameworks, product substitutes, end-user demographics, and mergers and acquisitions (M&A) activities.
The market exhibits a moderately concentrated structure, with key players like Aker Solutions ASA, ABB Ltd, and Siemens AG holding significant market share. However, the presence of numerous smaller players indicates a dynamic competitive environment. Innovation is driven by the need for efficient and reliable power transmission across vast distances, particularly in offshore renewable energy projects. Stringent regulatory frameworks, focused on safety and environmental protection, influence technological advancements and market entry. The primary substitute for subsea power grid systems is overhead transmission lines, but the limitations in their offshore applicability favor subsea solutions. End-users include power generation companies, renewable energy developers, and grid operators. M&A activity in the sector is moderate, with deal values typically ranging from xx Million to xx Million, reflecting strategic consolidation efforts to enhance technological capabilities and market reach. For instance, a recent merger between two key players resulted in a xx% increase in market share for the combined entity.
Subsea Power Grid System Market Dynamics & Trends
The subsea power grid system market is experiencing robust growth fueled by several key drivers. The increasing demand for renewable energy, particularly offshore wind power, is a major catalyst. Technological advancements, such as the development of high-voltage direct current (HVDC) cables and improved installation techniques, are enhancing efficiency and reducing costs. Government initiatives promoting renewable energy and grid modernization are further bolstering market expansion. Consumer preference for sustainable energy sources is driving investment in offshore wind farms, creating a strong demand for reliable subsea power transmission infrastructure. The competitive landscape is characterized by intense rivalry among established players and emerging companies, leading to product innovation and price competitiveness. The market penetration rate of subsea power grid systems in offshore wind projects is projected to reach xx% by 2033, contributing significantly to overall market growth.
Dominant Regions & Segments in Subsea Power Grid System Market
Europe and North America currently lead the subsea power grid system market, driven by substantial investments in offshore wind energy and existing robust power grid infrastructure.
Europe:
- Strong government support for renewable energy initiatives.
- Well-established offshore wind industry.
- Extensive grid infrastructure.
North America:
- Growing offshore wind energy projects.
- Increasing focus on grid modernization.
- Investment in advanced grid technologies.
Asia-Pacific:
- Rapid growth in offshore wind energy capacity.
- Increasing government support for renewable energy.
- Significant potential for market expansion.
The wind energy segment dominates the power generation type category, accounting for approximately xx% of the market share, while the captive generation segment holds a significant xx% share. Other applications are also growing as the technology expands.
Subsea Power Grid System Market Product Innovations
Recent product innovations focus on enhancing cable capacity, improving installation methods, and integrating smart grid technologies. HVDC cables are gaining prominence due to their superior efficiency in long-distance power transmission. Advanced cable materials and improved manufacturing techniques are contributing to enhanced durability and reliability. These innovations are addressing key challenges such as cost-effectiveness, installation complexity, and environmental impact, leading to broader market adoption.
Report Scope & Segmentation Analysis
This report segments the subsea power grid system market by power generation type (Captive Generation, Wind Energy, Others) and geography (North America, Europe, Asia-Pacific, South America, Middle-East and Africa). Each segment is analyzed in detail, providing insights into market size, growth projections, and competitive dynamics. The wind energy segment is expected to witness the fastest growth due to the expansion of offshore wind farms globally. Europe and North America are projected to dominate the geographic segments due to early adoption and favorable government policies.
Key Drivers of Subsea Power Grid System Market Growth
The growth of the subsea power grid system market is primarily driven by the increasing demand for renewable energy, particularly offshore wind power. Government policies promoting renewable energy and grid modernization are also significant catalysts. Technological advancements in HVDC cable technology and installation techniques further enhance market growth. The rising awareness of climate change and the global shift toward sustainable energy sources are also key drivers.
Challenges in the Subsea Power Grid System Market Sector
The subsea power grid system market faces several challenges, including the high capital cost associated with cable installation and maintenance. Stringent regulatory requirements and environmental concerns related to cable laying also pose challenges. Supply chain disruptions and the dependence on specialized expertise can impact project timelines and costs. Furthermore, intense competition among established players and emerging companies can put downward pressure on prices.
Emerging Opportunities in Subsea Power Grid System Market
Emerging opportunities include the expansion of offshore wind farms in new geographic regions, the development of hybrid energy systems integrating offshore wind with other renewable energy sources, and the integration of smart grid technologies to enhance grid stability and efficiency. The increasing adoption of digitalization in the energy sector, including advanced monitoring and control systems, also presents significant opportunities.
Leading Players in the Subsea Power Grid System Market Market
- Aker Solutions ASA
- ABB Ltd
- Abu Dhabi National Energy Co PJSC
- TechnipFMC plc
- Siemens Gamesa Renewable Energy S A
- Siemens AG
- General Electric Company
- MHI Vestas Offshore Wind A/S
Key Developments in Subsea Power Grid System Market Industry
- February 2023: Prysmian Group completed the cable laying and burial operations for the submarine power interconnection between Ibiza and Formentera in Spain.
- April 2022: XLCC announced the construction of a factory in Hunterston, Scotland, for the Xlinks Morocco-UK Power Project.
Future Outlook for Subsea Power Grid System Market Market
The subsea power grid system market is poised for significant growth in the coming years, driven by the continued expansion of offshore renewable energy, particularly wind power. Technological advancements and supportive government policies will further accelerate market expansion. Strategic partnerships and investments in research and development will play a crucial role in shaping the future of the market. The integration of smart grid technologies and the development of next-generation HVDC cables will drive innovation and efficiency gains, creating new opportunities for market players.
Subsea Power Grid System Market Segmentation
-
1. Power Generation Type
- 1.1. Captive Generation
- 1.2. Wind Energy
- 1.3. Others
-
2. Geogrpahy
- 2.1. North America
- 2.2. Europe
- 2.3. Asia-Pacific
- 2.4. South America
- 2.5. Middle-East and Africa
Subsea Power Grid System Market Segmentation By Geography
-
1. North America
- 1.1. United States
- 1.2. Canada
- 1.3. Mexico
-
2. South America
- 2.1. Brazil
- 2.2. Argentina
- 2.3. Rest of South America
-
3. Europe
- 3.1. United Kingdom
- 3.2. Germany
- 3.3. France
- 3.4. Italy
- 3.5. Spain
- 3.6. Russia
- 3.7. Benelux
- 3.8. Nordics
- 3.9. Rest of Europe
-
4. Middle East & Africa
- 4.1. Turkey
- 4.2. Israel
- 4.3. GCC
- 4.4. North Africa
- 4.5. South Africa
- 4.6. Rest of Middle East & Africa
-
5. Asia Pacific
- 5.1. China
- 5.2. India
- 5.3. Japan
- 5.4. South Korea
- 5.5. ASEAN
- 5.6. Oceania
- 5.7. Rest of Asia Pacific
Subsea Power Grid System Market REPORT HIGHLIGHTS
| Aspects | Details |
|---|---|
| Study Period | 2019-2033 |
| Base Year | 2024 |
| Estimated Year | 2025 |
| Forecast Period | 2025-2033 |
| Historical Period | 2019-2024 |
| Growth Rate | CAGR of > 8.00% from 2019-2033 |
| Segmentation |
|
Table of Contents
- 1. Introduction
- 1.1. Research Scope
- 1.2. Market Segmentation
- 1.3. Research Methodology
- 1.4. Definitions and Assumptions
- 2. Executive Summary
- 2.1. Introduction
- 3. Market Dynamics
- 3.1. Introduction
- 3.2. Market Drivers
- 3.2.1. 4.; Increasing Power Generation Capacity Worldwide4.; Rise In Electricity Demand Due Increase Industrial And Infrastructural Development Activities
- 3.3. Market Restrains
- 3.3.1. 4.; Growth In Distributed Energy Generation
- 3.4. Market Trends
- 3.4.1. Wind Energy to Witness Significant Growth
- 4. Market Factor Analysis
- 4.1. Porters Five Forces
- 4.2. Supply/Value Chain
- 4.3. PESTEL analysis
- 4.4. Market Entropy
- 4.5. Patent/Trademark Analysis
- 5. Global Subsea Power Grid System Market Analysis, Insights and Forecast, 2019-2031
- 5.1. Market Analysis, Insights and Forecast - by Power Generation Type
- 5.1.1. Captive Generation
- 5.1.2. Wind Energy
- 5.1.3. Others
- 5.2. Market Analysis, Insights and Forecast - by Geogrpahy
- 5.2.1. North America
- 5.2.2. Europe
- 5.2.3. Asia-Pacific
- 5.2.4. South America
- 5.2.5. Middle-East and Africa
- 5.3. Market Analysis, Insights and Forecast - by Region
- 5.3.1. North America
- 5.3.2. South America
- 5.3.3. Europe
- 5.3.4. Middle East & Africa
- 5.3.5. Asia Pacific
- 5.1. Market Analysis, Insights and Forecast - by Power Generation Type
- 6. North America Subsea Power Grid System Market Analysis, Insights and Forecast, 2019-2031
- 6.1. Market Analysis, Insights and Forecast - by Power Generation Type
- 6.1.1. Captive Generation
- 6.1.2. Wind Energy
- 6.1.3. Others
- 6.2. Market Analysis, Insights and Forecast - by Geogrpahy
- 6.2.1. North America
- 6.2.2. Europe
- 6.2.3. Asia-Pacific
- 6.2.4. South America
- 6.2.5. Middle-East and Africa
- 6.1. Market Analysis, Insights and Forecast - by Power Generation Type
- 7. South America Subsea Power Grid System Market Analysis, Insights and Forecast, 2019-2031
- 7.1. Market Analysis, Insights and Forecast - by Power Generation Type
- 7.1.1. Captive Generation
- 7.1.2. Wind Energy
- 7.1.3. Others
- 7.2. Market Analysis, Insights and Forecast - by Geogrpahy
- 7.2.1. North America
- 7.2.2. Europe
- 7.2.3. Asia-Pacific
- 7.2.4. South America
- 7.2.5. Middle-East and Africa
- 7.1. Market Analysis, Insights and Forecast - by Power Generation Type
- 8. Europe Subsea Power Grid System Market Analysis, Insights and Forecast, 2019-2031
- 8.1. Market Analysis, Insights and Forecast - by Power Generation Type
- 8.1.1. Captive Generation
- 8.1.2. Wind Energy
- 8.1.3. Others
- 8.2. Market Analysis, Insights and Forecast - by Geogrpahy
- 8.2.1. North America
- 8.2.2. Europe
- 8.2.3. Asia-Pacific
- 8.2.4. South America
- 8.2.5. Middle-East and Africa
- 8.1. Market Analysis, Insights and Forecast - by Power Generation Type
- 9. Middle East & Africa Subsea Power Grid System Market Analysis, Insights and Forecast, 2019-2031
- 9.1. Market Analysis, Insights and Forecast - by Power Generation Type
- 9.1.1. Captive Generation
- 9.1.2. Wind Energy
- 9.1.3. Others
- 9.2. Market Analysis, Insights and Forecast - by Geogrpahy
- 9.2.1. North America
- 9.2.2. Europe
- 9.2.3. Asia-Pacific
- 9.2.4. South America
- 9.2.5. Middle-East and Africa
- 9.1. Market Analysis, Insights and Forecast - by Power Generation Type
- 10. Asia Pacific Subsea Power Grid System Market Analysis, Insights and Forecast, 2019-2031
- 10.1. Market Analysis, Insights and Forecast - by Power Generation Type
- 10.1.1. Captive Generation
- 10.1.2. Wind Energy
- 10.1.3. Others
- 10.2. Market Analysis, Insights and Forecast - by Geogrpahy
- 10.2.1. North America
- 10.2.2. Europe
- 10.2.3. Asia-Pacific
- 10.2.4. South America
- 10.2.5. Middle-East and Africa
- 10.1. Market Analysis, Insights and Forecast - by Power Generation Type
- 11. North America Subsea Power Grid System Market Analysis, Insights and Forecast, 2019-2031
- 11.1. Market Analysis, Insights and Forecast - By Country/Sub-region
- 11.1.1 United States
- 11.1.2 Canada
- 11.1.3 Mexico
- 12. Europe Subsea Power Grid System Market Analysis, Insights and Forecast, 2019-2031
- 12.1. Market Analysis, Insights and Forecast - By Country/Sub-region
- 12.1.1 Germany
- 12.1.2 United Kingdom
- 12.1.3 France
- 12.1.4 Spain
- 12.1.5 Italy
- 12.1.6 Spain
- 12.1.7 Belgium
- 12.1.8 Netherland
- 12.1.9 Nordics
- 12.1.10 Rest of Europe
- 13. Asia Pacific Subsea Power Grid System Market Analysis, Insights and Forecast, 2019-2031
- 13.1. Market Analysis, Insights and Forecast - By Country/Sub-region
- 13.1.1 China
- 13.1.2 Japan
- 13.1.3 India
- 13.1.4 South Korea
- 13.1.5 Southeast Asia
- 13.1.6 Australia
- 13.1.7 Indonesia
- 13.1.8 Phillipes
- 13.1.9 Singapore
- 13.1.10 Thailandc
- 13.1.11 Rest of Asia Pacific
- 14. South America Subsea Power Grid System Market Analysis, Insights and Forecast, 2019-2031
- 14.1. Market Analysis, Insights and Forecast - By Country/Sub-region
- 14.1.1 Brazil
- 14.1.2 Argentina
- 14.1.3 Peru
- 14.1.4 Chile
- 14.1.5 Colombia
- 14.1.6 Ecuador
- 14.1.7 Venezuela
- 14.1.8 Rest of South America
- 15. North America Subsea Power Grid System Market Analysis, Insights and Forecast, 2019-2031
- 15.1. Market Analysis, Insights and Forecast - By Country/Sub-region
- 15.1.1 United States
- 15.1.2 Canada
- 15.1.3 Mexico
- 16. MEA Subsea Power Grid System Market Analysis, Insights and Forecast, 2019-2031
- 16.1. Market Analysis, Insights and Forecast - By Country/Sub-region
- 16.1.1 United Arab Emirates
- 16.1.2 Saudi Arabia
- 16.1.3 South Africa
- 16.1.4 Rest of Middle East and Africa
- 17. Competitive Analysis
- 17.1. Global Market Share Analysis 2024
- 17.2. Company Profiles
- 17.2.1 Aker Solutions ASA
- 17.2.1.1. Overview
- 17.2.1.2. Products
- 17.2.1.3. SWOT Analysis
- 17.2.1.4. Recent Developments
- 17.2.1.5. Financials (Based on Availability)
- 17.2.2 ABB Ltd
- 17.2.2.1. Overview
- 17.2.2.2. Products
- 17.2.2.3. SWOT Analysis
- 17.2.2.4. Recent Developments
- 17.2.2.5. Financials (Based on Availability)
- 17.2.3 Abu Dhabi National Energy Co PJSC
- 17.2.3.1. Overview
- 17.2.3.2. Products
- 17.2.3.3. SWOT Analysis
- 17.2.3.4. Recent Developments
- 17.2.3.5. Financials (Based on Availability)
- 17.2.4 TechnipFMC plc
- 17.2.4.1. Overview
- 17.2.4.2. Products
- 17.2.4.3. SWOT Analysis
- 17.2.4.4. Recent Developments
- 17.2.4.5. Financials (Based on Availability)
- 17.2.5 Siemens Gamesa Renewable Energy S A
- 17.2.5.1. Overview
- 17.2.5.2. Products
- 17.2.5.3. SWOT Analysis
- 17.2.5.4. Recent Developments
- 17.2.5.5. Financials (Based on Availability)
- 17.2.6 Siemens AG*List Not Exhaustive
- 17.2.6.1. Overview
- 17.2.6.2. Products
- 17.2.6.3. SWOT Analysis
- 17.2.6.4. Recent Developments
- 17.2.6.5. Financials (Based on Availability)
- 17.2.7 General Electric Company
- 17.2.7.1. Overview
- 17.2.7.2. Products
- 17.2.7.3. SWOT Analysis
- 17.2.7.4. Recent Developments
- 17.2.7.5. Financials (Based on Availability)
- 17.2.8 MHI Vestas Offshore Wind A/S
- 17.2.8.1. Overview
- 17.2.8.2. Products
- 17.2.8.3. SWOT Analysis
- 17.2.8.4. Recent Developments
- 17.2.8.5. Financials (Based on Availability)
- 17.2.1 Aker Solutions ASA
List of Figures
- Figure 1: Global Subsea Power Grid System Market Revenue Breakdown (Million, %) by Region 2024 & 2032
- Figure 2: North America Subsea Power Grid System Market Revenue (Million), by Country 2024 & 2032
- Figure 3: North America Subsea Power Grid System Market Revenue Share (%), by Country 2024 & 2032
- Figure 4: Europe Subsea Power Grid System Market Revenue (Million), by Country 2024 & 2032
- Figure 5: Europe Subsea Power Grid System Market Revenue Share (%), by Country 2024 & 2032
- Figure 6: Asia Pacific Subsea Power Grid System Market Revenue (Million), by Country 2024 & 2032
- Figure 7: Asia Pacific Subsea Power Grid System Market Revenue Share (%), by Country 2024 & 2032
- Figure 8: South America Subsea Power Grid System Market Revenue (Million), by Country 2024 & 2032
- Figure 9: South America Subsea Power Grid System Market Revenue Share (%), by Country 2024 & 2032
- Figure 10: North America Subsea Power Grid System Market Revenue (Million), by Country 2024 & 2032
- Figure 11: North America Subsea Power Grid System Market Revenue Share (%), by Country 2024 & 2032
- Figure 12: MEA Subsea Power Grid System Market Revenue (Million), by Country 2024 & 2032
- Figure 13: MEA Subsea Power Grid System Market Revenue Share (%), by Country 2024 & 2032
- Figure 14: North America Subsea Power Grid System Market Revenue (Million), by Power Generation Type 2024 & 2032
- Figure 15: North America Subsea Power Grid System Market Revenue Share (%), by Power Generation Type 2024 & 2032
- Figure 16: North America Subsea Power Grid System Market Revenue (Million), by Geogrpahy 2024 & 2032
- Figure 17: North America Subsea Power Grid System Market Revenue Share (%), by Geogrpahy 2024 & 2032
- Figure 18: North America Subsea Power Grid System Market Revenue (Million), by Country 2024 & 2032
- Figure 19: North America Subsea Power Grid System Market Revenue Share (%), by Country 2024 & 2032
- Figure 20: South America Subsea Power Grid System Market Revenue (Million), by Power Generation Type 2024 & 2032
- Figure 21: South America Subsea Power Grid System Market Revenue Share (%), by Power Generation Type 2024 & 2032
- Figure 22: South America Subsea Power Grid System Market Revenue (Million), by Geogrpahy 2024 & 2032
- Figure 23: South America Subsea Power Grid System Market Revenue Share (%), by Geogrpahy 2024 & 2032
- Figure 24: South America Subsea Power Grid System Market Revenue (Million), by Country 2024 & 2032
- Figure 25: South America Subsea Power Grid System Market Revenue Share (%), by Country 2024 & 2032
- Figure 26: Europe Subsea Power Grid System Market Revenue (Million), by Power Generation Type 2024 & 2032
- Figure 27: Europe Subsea Power Grid System Market Revenue Share (%), by Power Generation Type 2024 & 2032
- Figure 28: Europe Subsea Power Grid System Market Revenue (Million), by Geogrpahy 2024 & 2032
- Figure 29: Europe Subsea Power Grid System Market Revenue Share (%), by Geogrpahy 2024 & 2032
- Figure 30: Europe Subsea Power Grid System Market Revenue (Million), by Country 2024 & 2032
- Figure 31: Europe Subsea Power Grid System Market Revenue Share (%), by Country 2024 & 2032
- Figure 32: Middle East & Africa Subsea Power Grid System Market Revenue (Million), by Power Generation Type 2024 & 2032
- Figure 33: Middle East & Africa Subsea Power Grid System Market Revenue Share (%), by Power Generation Type 2024 & 2032
- Figure 34: Middle East & Africa Subsea Power Grid System Market Revenue (Million), by Geogrpahy 2024 & 2032
- Figure 35: Middle East & Africa Subsea Power Grid System Market Revenue Share (%), by Geogrpahy 2024 & 2032
- Figure 36: Middle East & Africa Subsea Power Grid System Market Revenue (Million), by Country 2024 & 2032
- Figure 37: Middle East & Africa Subsea Power Grid System Market Revenue Share (%), by Country 2024 & 2032
- Figure 38: Asia Pacific Subsea Power Grid System Market Revenue (Million), by Power Generation Type 2024 & 2032
- Figure 39: Asia Pacific Subsea Power Grid System Market Revenue Share (%), by Power Generation Type 2024 & 2032
- Figure 40: Asia Pacific Subsea Power Grid System Market Revenue (Million), by Geogrpahy 2024 & 2032
- Figure 41: Asia Pacific Subsea Power Grid System Market Revenue Share (%), by Geogrpahy 2024 & 2032
- Figure 42: Asia Pacific Subsea Power Grid System Market Revenue (Million), by Country 2024 & 2032
- Figure 43: Asia Pacific Subsea Power Grid System Market Revenue Share (%), by Country 2024 & 2032
List of Tables
- Table 1: Global Subsea Power Grid System Market Revenue Million Forecast, by Region 2019 & 2032
- Table 2: Global Subsea Power Grid System Market Revenue Million Forecast, by Power Generation Type 2019 & 2032
- Table 3: Global Subsea Power Grid System Market Revenue Million Forecast, by Geogrpahy 2019 & 2032
- Table 4: Global Subsea Power Grid System Market Revenue Million Forecast, by Region 2019 & 2032
- Table 5: Global Subsea Power Grid System Market Revenue Million Forecast, by Country 2019 & 2032
- Table 6: United States Subsea Power Grid System Market Revenue (Million) Forecast, by Application 2019 & 2032
- Table 7: Canada Subsea Power Grid System Market Revenue (Million) Forecast, by Application 2019 & 2032
- Table 8: Mexico Subsea Power Grid System Market Revenue (Million) Forecast, by Application 2019 & 2032
- Table 9: Global Subsea Power Grid System Market Revenue Million Forecast, by Country 2019 & 2032
- Table 10: Germany Subsea Power Grid System Market Revenue (Million) Forecast, by Application 2019 & 2032
- Table 11: United Kingdom Subsea Power Grid System Market Revenue (Million) Forecast, by Application 2019 & 2032
- Table 12: France Subsea Power Grid System Market Revenue (Million) Forecast, by Application 2019 & 2032
- Table 13: Spain Subsea Power Grid System Market Revenue (Million) Forecast, by Application 2019 & 2032
- Table 14: Italy Subsea Power Grid System Market Revenue (Million) Forecast, by Application 2019 & 2032
- Table 15: Spain Subsea Power Grid System Market Revenue (Million) Forecast, by Application 2019 & 2032
- Table 16: Belgium Subsea Power Grid System Market Revenue (Million) Forecast, by Application 2019 & 2032
- Table 17: Netherland Subsea Power Grid System Market Revenue (Million) Forecast, by Application 2019 & 2032
- Table 18: Nordics Subsea Power Grid System Market Revenue (Million) Forecast, by Application 2019 & 2032
- Table 19: Rest of Europe Subsea Power Grid System Market Revenue (Million) Forecast, by Application 2019 & 2032
- Table 20: Global Subsea Power Grid System Market Revenue Million Forecast, by Country 2019 & 2032
- Table 21: China Subsea Power Grid System Market Revenue (Million) Forecast, by Application 2019 & 2032
- Table 22: Japan Subsea Power Grid System Market Revenue (Million) Forecast, by Application 2019 & 2032
- Table 23: India Subsea Power Grid System Market Revenue (Million) Forecast, by Application 2019 & 2032
- Table 24: South Korea Subsea Power Grid System Market Revenue (Million) Forecast, by Application 2019 & 2032
- Table 25: Southeast Asia Subsea Power Grid System Market Revenue (Million) Forecast, by Application 2019 & 2032
- Table 26: Australia Subsea Power Grid System Market Revenue (Million) Forecast, by Application 2019 & 2032
- Table 27: Indonesia Subsea Power Grid System Market Revenue (Million) Forecast, by Application 2019 & 2032
- Table 28: Phillipes Subsea Power Grid System Market Revenue (Million) Forecast, by Application 2019 & 2032
- Table 29: Singapore Subsea Power Grid System Market Revenue (Million) Forecast, by Application 2019 & 2032
- Table 30: Thailandc Subsea Power Grid System Market Revenue (Million) Forecast, by Application 2019 & 2032
- Table 31: Rest of Asia Pacific Subsea Power Grid System Market Revenue (Million) Forecast, by Application 2019 & 2032
- Table 32: Global Subsea Power Grid System Market Revenue Million Forecast, by Country 2019 & 2032
- Table 33: Brazil Subsea Power Grid System Market Revenue (Million) Forecast, by Application 2019 & 2032
- Table 34: Argentina Subsea Power Grid System Market Revenue (Million) Forecast, by Application 2019 & 2032
- Table 35: Peru Subsea Power Grid System Market Revenue (Million) Forecast, by Application 2019 & 2032
- Table 36: Chile Subsea Power Grid System Market Revenue (Million) Forecast, by Application 2019 & 2032
- Table 37: Colombia Subsea Power Grid System Market Revenue (Million) Forecast, by Application 2019 & 2032
- Table 38: Ecuador Subsea Power Grid System Market Revenue (Million) Forecast, by Application 2019 & 2032
- Table 39: Venezuela Subsea Power Grid System Market Revenue (Million) Forecast, by Application 2019 & 2032
- Table 40: Rest of South America Subsea Power Grid System Market Revenue (Million) Forecast, by Application 2019 & 2032
- Table 41: Global Subsea Power Grid System Market Revenue Million Forecast, by Country 2019 & 2032
- Table 42: United States Subsea Power Grid System Market Revenue (Million) Forecast, by Application 2019 & 2032
- Table 43: Canada Subsea Power Grid System Market Revenue (Million) Forecast, by Application 2019 & 2032
- Table 44: Mexico Subsea Power Grid System Market Revenue (Million) Forecast, by Application 2019 & 2032
- Table 45: Global Subsea Power Grid System Market Revenue Million Forecast, by Country 2019 & 2032
- Table 46: United Arab Emirates Subsea Power Grid System Market Revenue (Million) Forecast, by Application 2019 & 2032
- Table 47: Saudi Arabia Subsea Power Grid System Market Revenue (Million) Forecast, by Application 2019 & 2032
- Table 48: South Africa Subsea Power Grid System Market Revenue (Million) Forecast, by Application 2019 & 2032
- Table 49: Rest of Middle East and Africa Subsea Power Grid System Market Revenue (Million) Forecast, by Application 2019 & 2032
- Table 50: Global Subsea Power Grid System Market Revenue Million Forecast, by Power Generation Type 2019 & 2032
- Table 51: Global Subsea Power Grid System Market Revenue Million Forecast, by Geogrpahy 2019 & 2032
- Table 52: Global Subsea Power Grid System Market Revenue Million Forecast, by Country 2019 & 2032
- Table 53: United States Subsea Power Grid System Market Revenue (Million) Forecast, by Application 2019 & 2032
- Table 54: Canada Subsea Power Grid System Market Revenue (Million) Forecast, by Application 2019 & 2032
- Table 55: Mexico Subsea Power Grid System Market Revenue (Million) Forecast, by Application 2019 & 2032
- Table 56: Global Subsea Power Grid System Market Revenue Million Forecast, by Power Generation Type 2019 & 2032
- Table 57: Global Subsea Power Grid System Market Revenue Million Forecast, by Geogrpahy 2019 & 2032
- Table 58: Global Subsea Power Grid System Market Revenue Million Forecast, by Country 2019 & 2032
- Table 59: Brazil Subsea Power Grid System Market Revenue (Million) Forecast, by Application 2019 & 2032
- Table 60: Argentina Subsea Power Grid System Market Revenue (Million) Forecast, by Application 2019 & 2032
- Table 61: Rest of South America Subsea Power Grid System Market Revenue (Million) Forecast, by Application 2019 & 2032
- Table 62: Global Subsea Power Grid System Market Revenue Million Forecast, by Power Generation Type 2019 & 2032
- Table 63: Global Subsea Power Grid System Market Revenue Million Forecast, by Geogrpahy 2019 & 2032
- Table 64: Global Subsea Power Grid System Market Revenue Million Forecast, by Country 2019 & 2032
- Table 65: United Kingdom Subsea Power Grid System Market Revenue (Million) Forecast, by Application 2019 & 2032
- Table 66: Germany Subsea Power Grid System Market Revenue (Million) Forecast, by Application 2019 & 2032
- Table 67: France Subsea Power Grid System Market Revenue (Million) Forecast, by Application 2019 & 2032
- Table 68: Italy Subsea Power Grid System Market Revenue (Million) Forecast, by Application 2019 & 2032
- Table 69: Spain Subsea Power Grid System Market Revenue (Million) Forecast, by Application 2019 & 2032
- Table 70: Russia Subsea Power Grid System Market Revenue (Million) Forecast, by Application 2019 & 2032
- Table 71: Benelux Subsea Power Grid System Market Revenue (Million) Forecast, by Application 2019 & 2032
- Table 72: Nordics Subsea Power Grid System Market Revenue (Million) Forecast, by Application 2019 & 2032
- Table 73: Rest of Europe Subsea Power Grid System Market Revenue (Million) Forecast, by Application 2019 & 2032
- Table 74: Global Subsea Power Grid System Market Revenue Million Forecast, by Power Generation Type 2019 & 2032
- Table 75: Global Subsea Power Grid System Market Revenue Million Forecast, by Geogrpahy 2019 & 2032
- Table 76: Global Subsea Power Grid System Market Revenue Million Forecast, by Country 2019 & 2032
- Table 77: Turkey Subsea Power Grid System Market Revenue (Million) Forecast, by Application 2019 & 2032
- Table 78: Israel Subsea Power Grid System Market Revenue (Million) Forecast, by Application 2019 & 2032
- Table 79: GCC Subsea Power Grid System Market Revenue (Million) Forecast, by Application 2019 & 2032
- Table 80: North Africa Subsea Power Grid System Market Revenue (Million) Forecast, by Application 2019 & 2032
- Table 81: South Africa Subsea Power Grid System Market Revenue (Million) Forecast, by Application 2019 & 2032
- Table 82: Rest of Middle East & Africa Subsea Power Grid System Market Revenue (Million) Forecast, by Application 2019 & 2032
- Table 83: Global Subsea Power Grid System Market Revenue Million Forecast, by Power Generation Type 2019 & 2032
- Table 84: Global Subsea Power Grid System Market Revenue Million Forecast, by Geogrpahy 2019 & 2032
- Table 85: Global Subsea Power Grid System Market Revenue Million Forecast, by Country 2019 & 2032
- Table 86: China Subsea Power Grid System Market Revenue (Million) Forecast, by Application 2019 & 2032
- Table 87: India Subsea Power Grid System Market Revenue (Million) Forecast, by Application 2019 & 2032
- Table 88: Japan Subsea Power Grid System Market Revenue (Million) Forecast, by Application 2019 & 2032
- Table 89: South Korea Subsea Power Grid System Market Revenue (Million) Forecast, by Application 2019 & 2032
- Table 90: ASEAN Subsea Power Grid System Market Revenue (Million) Forecast, by Application 2019 & 2032
- Table 91: Oceania Subsea Power Grid System Market Revenue (Million) Forecast, by Application 2019 & 2032
- Table 92: Rest of Asia Pacific Subsea Power Grid System Market Revenue (Million) Forecast, by Application 2019 & 2032
Frequently Asked Questions
1. What is the projected Compound Annual Growth Rate (CAGR) of the Subsea Power Grid System Market?
The projected CAGR is approximately > 8.00%.
2. Which companies are prominent players in the Subsea Power Grid System Market?
Key companies in the market include Aker Solutions ASA, ABB Ltd, Abu Dhabi National Energy Co PJSC, TechnipFMC plc, Siemens Gamesa Renewable Energy S A, Siemens AG*List Not Exhaustive, General Electric Company, MHI Vestas Offshore Wind A/S.
3. What are the main segments of the Subsea Power Grid System Market?
The market segments include Power Generation Type, Geogrpahy.
4. Can you provide details about the market size?
The market size is estimated to be USD XX Million as of 2022.
5. What are some drivers contributing to market growth?
4.; Increasing Power Generation Capacity Worldwide4.; Rise In Electricity Demand Due Increase Industrial And Infrastructural Development Activities.
6. What are the notable trends driving market growth?
Wind Energy to Witness Significant Growth.
7. Are there any restraints impacting market growth?
4.; Growth In Distributed Energy Generation.
8. Can you provide examples of recent developments in the market?
In February 2023, Prysmian Group completed the cable laying and burial operations for the submarine power interconnection between Ibiza and Formentera in Spain. The system comprises around 27 kilometers of submarine cables and 10 kilometers of land cables, both manufactured at the company's plant in Arco Felice in Naples, Italy.
9. What pricing options are available for accessing the report?
Pricing options include single-user, multi-user, and enterprise licenses priced at USD 4750, USD 5250, and USD 8750 respectively.
10. Is the market size provided in terms of value or volume?
The market size is provided in terms of value, measured in Million.
11. Are there any specific market keywords associated with the report?
Yes, the market keyword associated with the report is "Subsea Power Grid System Market," which aids in identifying and referencing the specific market segment covered.
12. How do I determine which pricing option suits my needs best?
The pricing options vary based on user requirements and access needs. Individual users may opt for single-user licenses, while businesses requiring broader access may choose multi-user or enterprise licenses for cost-effective access to the report.
13. Are there any additional resources or data provided in the Subsea Power Grid System Market report?
While the report offers comprehensive insights, it's advisable to review the specific contents or supplementary materials provided to ascertain if additional resources or data are available.
14. How can I stay updated on further developments or reports in the Subsea Power Grid System Market?
To stay informed about further developments, trends, and reports in the Subsea Power Grid System Market, consider subscribing to industry newsletters, following relevant companies and organizations, or regularly checking reputable industry news sources and publications.
Methodology
Step 1 - Identification of Relevant Samples Size from Population Database


Step 2 - Approaches for Defining Global Market Size (Value, Volume* & Price*)

Note*: In applicable scenarios
Step 3 - Data Sources
Primary Research
- Web Analytics
- Survey Reports
- Research Institute
- Latest Research Reports
- Opinion Leaders
Secondary Research
- Annual Reports
- White Paper
- Latest Press Release
- Industry Association
- Paid Database
- Investor Presentations

Step 4 - Data Triangulation
Involves using different sources of information in order to increase the validity of a study
These sources are likely to be stakeholders in a program - participants, other researchers, program staff, other community members, and so on.
Then we put all data in single framework & apply various statistical tools to find out the dynamic on the market.
During the analysis stage, feedback from the stakeholder groups would be compared to determine areas of agreement as well as areas of divergence


