
Key Insights
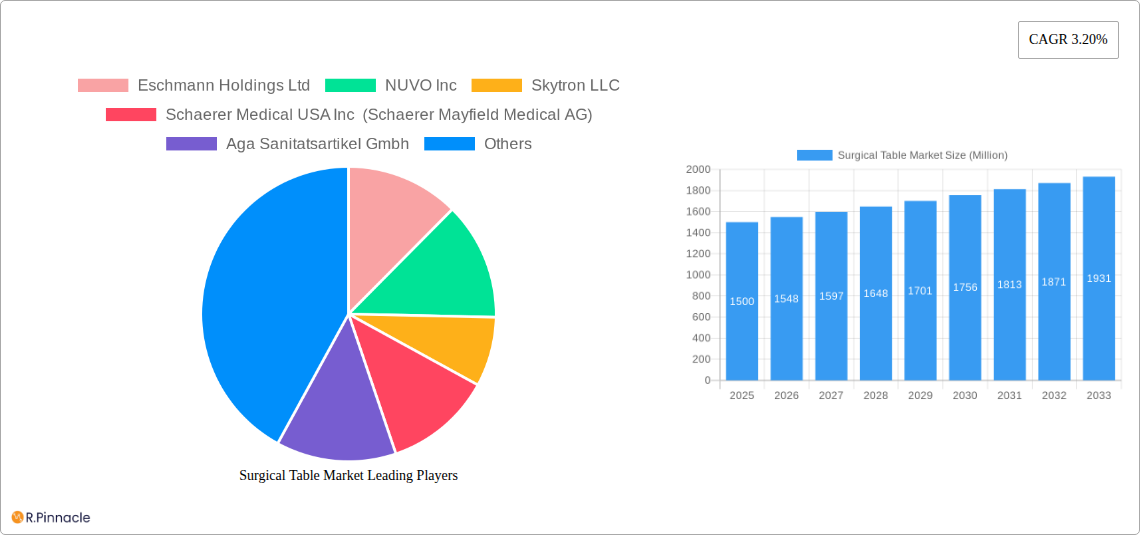
The global surgical table market, valued at approximately $1.5 billion in 2025, is projected to experience steady growth, driven by several key factors. Technological advancements leading to the development of more sophisticated and versatile surgical tables, capable of accommodating a wider range of surgical procedures and patient sizes, are significantly impacting market expansion. The increasing prevalence of minimally invasive surgeries (MIS) and robotic-assisted procedures fuels demand for specialized surgical tables designed to optimize surgical workflow and enhance precision. Furthermore, the rising geriatric population, coupled with a surge in chronic diseases requiring surgical intervention, contributes to the market's growth trajectory. Growth is also fueled by the expansion of healthcare infrastructure, particularly in developing economies, and increasing investments in advanced medical technology. Hospitals and ambulatory surgical centers represent the largest end-user segments, reflecting the widespread adoption of surgical tables across various healthcare settings. The metal segment dominates the material type category due to its durability and cost-effectiveness. However, the composite material segment is expected to witness significant growth owing to its lightweight and enhanced ergonomics. While advancements in technology are driving market growth, potential restraints include high initial investment costs associated with advanced surgical tables and the need for specialized training for efficient operation.
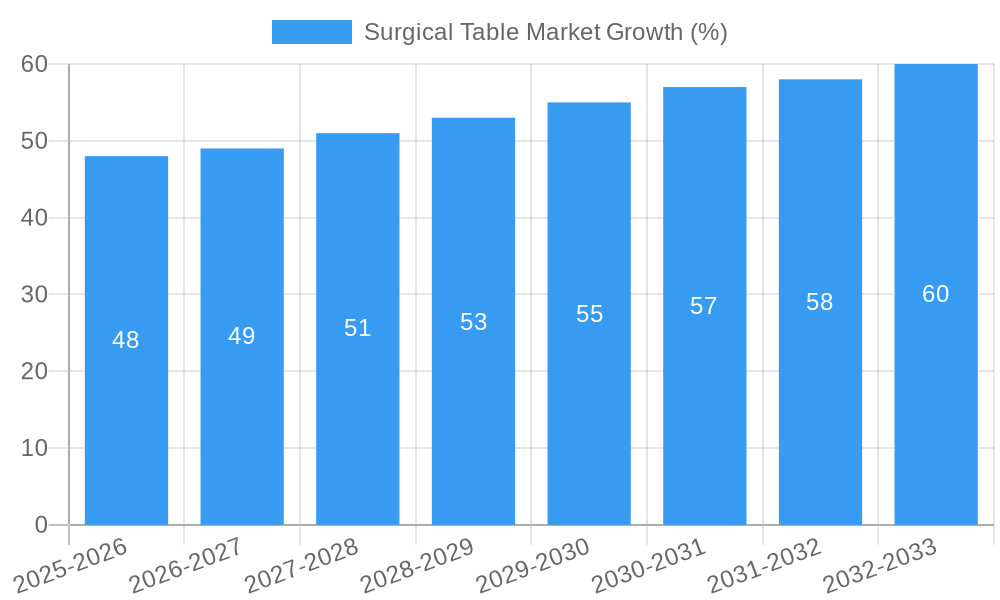
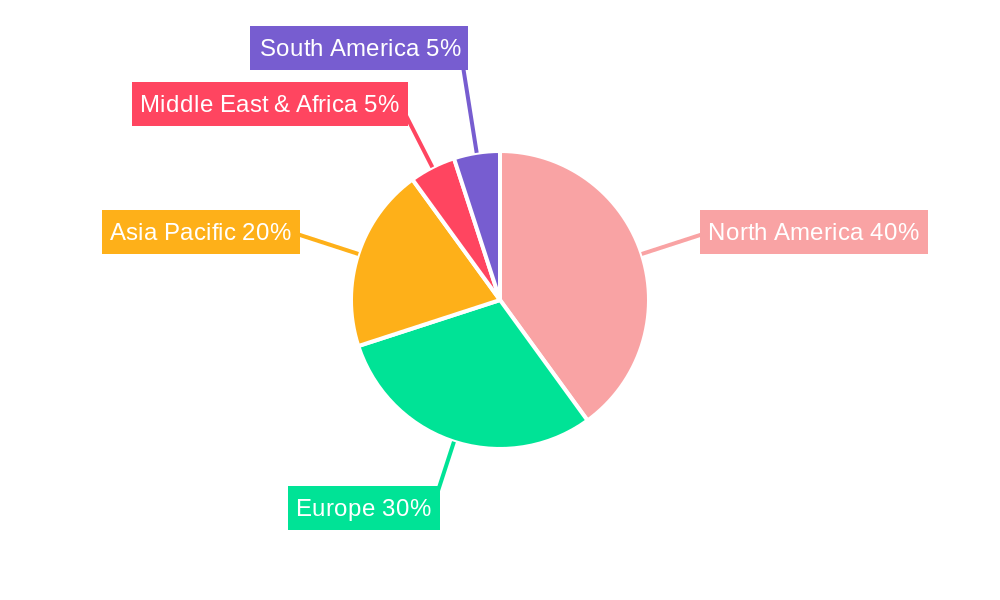
Geographical segmentation reveals a strong presence in North America and Europe, driven by well-established healthcare infrastructure and high adoption rates of advanced medical technologies. However, the Asia-Pacific region is poised for considerable expansion, fueled by rapid economic growth, increasing healthcare expenditure, and expanding healthcare facilities. Competition in the market is intense, with key players such as Stryker Corporation, Getinge AB, and Hill-Rom Holdings Inc. continually striving to innovate and expand their product portfolios. This competition fosters innovation and drives the development of increasingly advanced surgical tables that enhance surgical precision, patient comfort, and overall surgical outcomes. The market is predicted to demonstrate a compound annual growth rate (CAGR) of approximately 3.2% from 2025 to 2033, indicating a consistent, albeit moderate, growth trajectory.
This comprehensive report provides a detailed analysis of the global Surgical Table Market, offering invaluable insights for industry professionals, investors, and strategic decision-makers. The study covers the period from 2019 to 2033, with a focus on the forecast period from 2025 to 2033. The base year for this analysis is 2025. The report meticulously examines market segmentation, competitive dynamics, growth drivers, challenges, and emerging opportunities, offering actionable strategies for success in this dynamic market. The global market size is estimated at XX Million in 2025 and is projected to reach XX Million by 2033, exhibiting a CAGR of xx% during the forecast period.
Surgical Table Market Structure & Innovation Trends
This section analyzes the competitive landscape of the surgical table market, encompassing market concentration, innovation drivers, regulatory frameworks, product substitutes, end-user demographics, and mergers and acquisitions (M&A) activities. The market is moderately concentrated, with key players holding significant market share. However, the presence of several smaller players indicates a dynamic competitive environment.
- Market Concentration: The top 5 players account for approximately xx% of the global market share in 2025.
- Innovation Drivers: Technological advancements such as integration of advanced imaging systems, improved ergonomics, and enhanced patient safety features drive innovation. Stringent regulatory frameworks necessitate continuous product improvements.
- Product Substitutes: Limited direct substitutes exist, but advancements in minimally invasive surgery techniques indirectly impact demand.
- End-User Demographics: The primary end-users are hospitals, followed by ambulatory surgical centers and clinics. Growth in these sectors fuels market expansion.
- M&A Activities: The market has witnessed several M&A activities in the past five years, with deal values totaling approximately xx Million. These activities aim to expand market reach and enhance product portfolios. For example, the acquisition of Company X by Company Y in 2023 significantly impacted market dynamics.
Surgical Table Market Dynamics & Trends
This section delves into the market's growth drivers, technological disruptions, consumer preferences, and competitive dynamics. The market is experiencing steady growth, driven by factors such as the increasing prevalence of surgical procedures, technological advancements, and rising healthcare expenditure. However, economic downturns and regulatory changes can influence market growth trajectories.
The global market is expected to witness a CAGR of xx% from 2025 to 2033. Market penetration is expected to reach xx% by 2033 across major regions. Technological disruptions, particularly in minimally invasive surgical techniques and the incorporation of smart technologies into surgical tables, are creating new opportunities and altering market dynamics. Growing emphasis on patient safety, comfort, and improved ergonomic designs influence consumer preferences. The competitive landscape is characterized by intense competition among established players and the emergence of new entrants offering innovative products.
Dominant Regions & Segments in Surgical Table Market
This section identifies the leading regions, countries, and segments within the surgical table market. The market is geographically diverse, with North America and Europe dominating in terms of revenue generation due to well-established healthcare infrastructure and high adoption rates. However, Asia-Pacific is emerging as a high-growth market owing to expanding healthcare infrastructure and rising disposable incomes.
Key Drivers:
- North America: High healthcare expenditure, advanced medical technology adoption, and a large number of surgical procedures drive market growth.
- Europe: Well-established healthcare infrastructure and stringent regulatory frameworks contribute to market stability.
- Asia-Pacific: Rapid economic growth, rising disposable incomes, and increasing healthcare investments fuel market expansion.
Segment Dominance:
- Type of Surgery: The general surgery segment currently holds the largest market share due to high volumes of procedures. However, the specialty surgery segment is expected to witness faster growth due to increasing demand for specialized surgical procedures.
- Material: Metal surgical tables dominate the market due to their durability and cost-effectiveness. However, the composite material segment is witnessing increasing demand due to its lightweight and ergonomic benefits.
- End-User: Hospitals comprise the largest segment, followed by ambulatory surgical centers and clinics. The growth of ambulatory surgical centers is driving the demand for portable and easily adaptable surgical tables.
Surgical Table Market Product Innovations
Recent product developments focus on enhanced ergonomics, integration of advanced imaging technologies, improved patient safety features, and increased modularity. These innovations cater to the growing demand for patient-centric care and improved surgical outcomes. The market is witnessing a trend toward minimally invasive surgery techniques, impacting the design and functionality of surgical tables. Manufacturers are also focusing on developing cost-effective and easily maintainable products to cater to budget constraints in certain regions.
Report Scope & Segmentation Analysis
This report provides a detailed segmentation analysis of the surgical table market across various parameters:
Type of Surgery: General Surgery, Specialty Surgery. The general surgery segment is projected to experience xx% CAGR, while specialty surgery is expected to grow at xx% CAGR, due to the rise in complex surgical procedures.
Material: Metal, Composite. The metal segment currently dominates due to robustness and cost-effectiveness, but the composite segment is showing promising growth due to lightweight features and improved ergonomics.
End-User: Hospitals, Ambulatory Surgical Centres, Clinics. Hospitals hold the largest market share, while ambulatory surgical centres are showing rapid growth due to increased preference for outpatient surgeries. The competitive dynamics within each segment vary depending on factors such as pricing, product differentiation, and technological advancements.
Key Drivers of Surgical Table Market Growth
Several factors fuel the growth of the surgical table market. The increasing prevalence of chronic diseases necessitates more surgeries, driving demand. Technological advancements, such as improved ergonomics, integration of imaging systems, and enhanced safety features, significantly boost market growth. Government initiatives and investments in healthcare infrastructure, particularly in developing economies, provide a further impetus. Favorable regulatory frameworks promoting the adoption of advanced medical technology also support market expansion.
Challenges in the Surgical Table Market Sector
Several challenges hinder the growth of this sector. The high cost of advanced surgical tables limits accessibility, especially in developing countries. Stringent regulatory requirements increase the cost and time required for product approvals. Supply chain disruptions and fluctuations in raw material prices can impact production costs and profitability. Intense competition among established players necessitates continuous innovation and product differentiation to maintain market share. These challenges have a quantifiable impact, estimated to constrain market growth by approximately xx% annually.
Emerging Opportunities in Surgical Table Market
Several emerging opportunities exist within the market. The rising prevalence of minimally invasive surgeries creates demand for specialized surgical tables. The integration of AI and IoT technologies offers opportunities for developing smart surgical tables with enhanced features. Expansion into emerging markets with growing healthcare infrastructure presents significant growth potential. The increasing demand for portable and easily adaptable surgical tables for ambulatory surgical centers represents another significant opportunity.
Leading Players in the Surgical Table Market Market
- Eschmann Holdings Ltd
- NUVO Inc
- Skytron LLC
- Schaerer Medical USA Inc (Schaerer Mayfield Medical AG)
- Aga Sanitatsartikel Gmbh
- Trumpf Medical (Hill-Rom Holdings Inc)
- Getinge AB
- Staan Bio-Med Engineering Private Limited
- Stryker Corporation
- Alvo Medical
- Steris PLC
- Mizuho OSI (MIZUHO Corporation)
- Allengers Medical Systems Limited
- Merivaara Corp
Key Developments in Surgical Table Market Industry
- April 2022: Getinge partnered with the International Finance Corporation (IFC) to enhance access to medical equipment across Africa, significantly impacting market reach and social responsibility.
- February 2022: ALVO Medical showcased its ALVO Rapsodia operating table at Arab Health, highlighting product innovation and market expansion efforts.
Future Outlook for Surgical Table Market Market
The future of the surgical table market appears promising. Continued technological advancements, increasing demand for minimally invasive surgeries, and expansion into emerging markets are projected to drive significant growth. Strategic partnerships, mergers, and acquisitions will likely reshape the competitive landscape. Focusing on innovation, improved ergonomics, and cost-effectiveness will be crucial for success in this evolving market. The market is expected to experience sustained growth, with considerable potential for expansion in both developed and developing economies.
Surgical Table Market Segmentation
-
1. Type of Surgery
- 1.1. General
- 1.2. Specialty
-
2. Material
- 2.1. Metal
- 2.2. Composite
-
3. End User
- 3.1. Hospitals
- 3.2. Ambulatory Surgical Centres
- 3.3. Clinics
Surgical Table Market Segmentation By Geography
-
1. North America
- 1.1. United States
- 1.2. Canada
- 1.3. Mexico
-
2. Europe
- 2.1. Germany
- 2.2. United Kingdom
- 2.3. France
- 2.4. Italy
- 2.5. Spain
- 2.6. Rest of Europe
-
3. Asia Pacific
- 3.1. China
- 3.2. Japan
- 3.3. India
- 3.4. Australia
- 3.5. South Korea
- 3.6. Rest of Asia Pacific
-
4. Middle East and Africa
- 4.1. GCC
- 4.2. South Africa
- 4.3. Rest of Middle East and Africa
-
5. South America
- 5.1. Brazil
- 5.2. Argentina
- 5.3. Rest of South America
Surgical Table Market REPORT HIGHLIGHTS
| Aspects | Details |
|---|---|
| Study Period | 2019-2033 |
| Base Year | 2024 |
| Estimated Year | 2025 |
| Forecast Period | 2025-2033 |
| Historical Period | 2019-2024 |
| Growth Rate | CAGR of 3.20% from 2019-2033 |
| Segmentation |
|
Table of Contents
- 1. Introduction
- 1.1. Research Scope
- 1.2. Market Segmentation
- 1.3. Research Methodology
- 1.4. Definitions and Assumptions
- 2. Executive Summary
- 2.1. Introduction
- 3. Market Dynamics
- 3.1. Introduction
- 3.2. Market Drivers
- 3.2.1 Growing Number of Surgeries
- 3.2.2 Coupled with the Increasing Number of Ambulatory Surgical Centers; Technological Advancements in Operation Theatres
- 3.3. Market Restrains
- 3.3.1. High Cost of Composite Surgical Tables; Lack of Skilled Labor
- 3.4. Market Trends
- 3.4.1. General Surgical Table is Expected to Witness Strong Growth Over the Forecast Period
- 4. Market Factor Analysis
- 4.1. Porters Five Forces
- 4.2. Supply/Value Chain
- 4.3. PESTEL analysis
- 4.4. Market Entropy
- 4.5. Patent/Trademark Analysis
- 5. Global Surgical Table Market Analysis, Insights and Forecast, 2019-2031
- 5.1. Market Analysis, Insights and Forecast - by Type of Surgery
- 5.1.1. General
- 5.1.2. Specialty
- 5.2. Market Analysis, Insights and Forecast - by Material
- 5.2.1. Metal
- 5.2.2. Composite
- 5.3. Market Analysis, Insights and Forecast - by End User
- 5.3.1. Hospitals
- 5.3.2. Ambulatory Surgical Centres
- 5.3.3. Clinics
- 5.4. Market Analysis, Insights and Forecast - by Region
- 5.4.1. North America
- 5.4.2. Europe
- 5.4.3. Asia Pacific
- 5.4.4. Middle East and Africa
- 5.4.5. South America
- 5.1. Market Analysis, Insights and Forecast - by Type of Surgery
- 6. North America Surgical Table Market Analysis, Insights and Forecast, 2019-2031
- 6.1. Market Analysis, Insights and Forecast - by Type of Surgery
- 6.1.1. General
- 6.1.2. Specialty
- 6.2. Market Analysis, Insights and Forecast - by Material
- 6.2.1. Metal
- 6.2.2. Composite
- 6.3. Market Analysis, Insights and Forecast - by End User
- 6.3.1. Hospitals
- 6.3.2. Ambulatory Surgical Centres
- 6.3.3. Clinics
- 6.1. Market Analysis, Insights and Forecast - by Type of Surgery
- 7. Europe Surgical Table Market Analysis, Insights and Forecast, 2019-2031
- 7.1. Market Analysis, Insights and Forecast - by Type of Surgery
- 7.1.1. General
- 7.1.2. Specialty
- 7.2. Market Analysis, Insights and Forecast - by Material
- 7.2.1. Metal
- 7.2.2. Composite
- 7.3. Market Analysis, Insights and Forecast - by End User
- 7.3.1. Hospitals
- 7.3.2. Ambulatory Surgical Centres
- 7.3.3. Clinics
- 7.1. Market Analysis, Insights and Forecast - by Type of Surgery
- 8. Asia Pacific Surgical Table Market Analysis, Insights and Forecast, 2019-2031
- 8.1. Market Analysis, Insights and Forecast - by Type of Surgery
- 8.1.1. General
- 8.1.2. Specialty
- 8.2. Market Analysis, Insights and Forecast - by Material
- 8.2.1. Metal
- 8.2.2. Composite
- 8.3. Market Analysis, Insights and Forecast - by End User
- 8.3.1. Hospitals
- 8.3.2. Ambulatory Surgical Centres
- 8.3.3. Clinics
- 8.1. Market Analysis, Insights and Forecast - by Type of Surgery
- 9. Middle East and Africa Surgical Table Market Analysis, Insights and Forecast, 2019-2031
- 9.1. Market Analysis, Insights and Forecast - by Type of Surgery
- 9.1.1. General
- 9.1.2. Specialty
- 9.2. Market Analysis, Insights and Forecast - by Material
- 9.2.1. Metal
- 9.2.2. Composite
- 9.3. Market Analysis, Insights and Forecast - by End User
- 9.3.1. Hospitals
- 9.3.2. Ambulatory Surgical Centres
- 9.3.3. Clinics
- 9.1. Market Analysis, Insights and Forecast - by Type of Surgery
- 10. South America Surgical Table Market Analysis, Insights and Forecast, 2019-2031
- 10.1. Market Analysis, Insights and Forecast - by Type of Surgery
- 10.1.1. General
- 10.1.2. Specialty
- 10.2. Market Analysis, Insights and Forecast - by Material
- 10.2.1. Metal
- 10.2.2. Composite
- 10.3. Market Analysis, Insights and Forecast - by End User
- 10.3.1. Hospitals
- 10.3.2. Ambulatory Surgical Centres
- 10.3.3. Clinics
- 10.1. Market Analysis, Insights and Forecast - by Type of Surgery
- 11. North America Surgical Table Market Analysis, Insights and Forecast, 2019-2031
- 11.1. Market Analysis, Insights and Forecast - By Country/Sub-region
- 11.1.1 United States
- 11.1.2 Canada
- 11.1.3 Mexico
- 12. Europe Surgical Table Market Analysis, Insights and Forecast, 2019-2031
- 12.1. Market Analysis, Insights and Forecast - By Country/Sub-region
- 12.1.1 Germany
- 12.1.2 United Kingdom
- 12.1.3 France
- 12.1.4 Italy
- 12.1.5 Spain
- 12.1.6 Rest of Europe
- 13. Asia Pacific Surgical Table Market Analysis, Insights and Forecast, 2019-2031
- 13.1. Market Analysis, Insights and Forecast - By Country/Sub-region
- 13.1.1 China
- 13.1.2 Japan
- 13.1.3 India
- 13.1.4 Australia
- 13.1.5 South Korea
- 13.1.6 Rest of Asia Pacific
- 14. Middle East and Africa Surgical Table Market Analysis, Insights and Forecast, 2019-2031
- 14.1. Market Analysis, Insights and Forecast - By Country/Sub-region
- 14.1.1 GCC
- 14.1.2 South Africa
- 14.1.3 Rest of Middle East and Africa
- 15. South America Surgical Table Market Analysis, Insights and Forecast, 2019-2031
- 15.1. Market Analysis, Insights and Forecast - By Country/Sub-region
- 15.1.1 Brazil
- 15.1.2 Argentina
- 15.1.3 Rest of South America
- 16. Competitive Analysis
- 16.1. Global Market Share Analysis 2024
- 16.2. Company Profiles
- 16.2.1 Eschmann Holdings Ltd
- 16.2.1.1. Overview
- 16.2.1.2. Products
- 16.2.1.3. SWOT Analysis
- 16.2.1.4. Recent Developments
- 16.2.1.5. Financials (Based on Availability)
- 16.2.2 NUVO Inc
- 16.2.2.1. Overview
- 16.2.2.2. Products
- 16.2.2.3. SWOT Analysis
- 16.2.2.4. Recent Developments
- 16.2.2.5. Financials (Based on Availability)
- 16.2.3 Skytron LLC
- 16.2.3.1. Overview
- 16.2.3.2. Products
- 16.2.3.3. SWOT Analysis
- 16.2.3.4. Recent Developments
- 16.2.3.5. Financials (Based on Availability)
- 16.2.4 Schaerer Medical USA Inc (Schaerer Mayfield Medical AG)
- 16.2.4.1. Overview
- 16.2.4.2. Products
- 16.2.4.3. SWOT Analysis
- 16.2.4.4. Recent Developments
- 16.2.4.5. Financials (Based on Availability)
- 16.2.5 Aga Sanitatsartikel Gmbh
- 16.2.5.1. Overview
- 16.2.5.2. Products
- 16.2.5.3. SWOT Analysis
- 16.2.5.4. Recent Developments
- 16.2.5.5. Financials (Based on Availability)
- 16.2.6 Trumpf Medical (Hill-Rom Holdings Inc )
- 16.2.6.1. Overview
- 16.2.6.2. Products
- 16.2.6.3. SWOT Analysis
- 16.2.6.4. Recent Developments
- 16.2.6.5. Financials (Based on Availability)
- 16.2.7 Getinge AB
- 16.2.7.1. Overview
- 16.2.7.2. Products
- 16.2.7.3. SWOT Analysis
- 16.2.7.4. Recent Developments
- 16.2.7.5. Financials (Based on Availability)
- 16.2.8 Staan Bio-Med Engineering Private Limited
- 16.2.8.1. Overview
- 16.2.8.2. Products
- 16.2.8.3. SWOT Analysis
- 16.2.8.4. Recent Developments
- 16.2.8.5. Financials (Based on Availability)
- 16.2.9 Stryker Corporation
- 16.2.9.1. Overview
- 16.2.9.2. Products
- 16.2.9.3. SWOT Analysis
- 16.2.9.4. Recent Developments
- 16.2.9.5. Financials (Based on Availability)
- 16.2.10 Alvo Medical
- 16.2.10.1. Overview
- 16.2.10.2. Products
- 16.2.10.3. SWOT Analysis
- 16.2.10.4. Recent Developments
- 16.2.10.5. Financials (Based on Availability)
- 16.2.11 Steris PLC
- 16.2.11.1. Overview
- 16.2.11.2. Products
- 16.2.11.3. SWOT Analysis
- 16.2.11.4. Recent Developments
- 16.2.11.5. Financials (Based on Availability)
- 16.2.12 Mizuho OSI (MIZUHO Corporation)
- 16.2.12.1. Overview
- 16.2.12.2. Products
- 16.2.12.3. SWOT Analysis
- 16.2.12.4. Recent Developments
- 16.2.12.5. Financials (Based on Availability)
- 16.2.13 Allengers Medical Systems Limited
- 16.2.13.1. Overview
- 16.2.13.2. Products
- 16.2.13.3. SWOT Analysis
- 16.2.13.4. Recent Developments
- 16.2.13.5. Financials (Based on Availability)
- 16.2.14 Merivaara Corp
- 16.2.14.1. Overview
- 16.2.14.2. Products
- 16.2.14.3. SWOT Analysis
- 16.2.14.4. Recent Developments
- 16.2.14.5. Financials (Based on Availability)
- 16.2.1 Eschmann Holdings Ltd
List of Figures
- Figure 1: Global Surgical Table Market Revenue Breakdown (Million, %) by Region 2024 & 2032
- Figure 2: Global Surgical Table Market Volume Breakdown (K Unit, %) by Region 2024 & 2032
- Figure 3: North America Surgical Table Market Revenue (Million), by Country 2024 & 2032
- Figure 4: North America Surgical Table Market Volume (K Unit), by Country 2024 & 2032
- Figure 5: North America Surgical Table Market Revenue Share (%), by Country 2024 & 2032
- Figure 6: North America Surgical Table Market Volume Share (%), by Country 2024 & 2032
- Figure 7: Europe Surgical Table Market Revenue (Million), by Country 2024 & 2032
- Figure 8: Europe Surgical Table Market Volume (K Unit), by Country 2024 & 2032
- Figure 9: Europe Surgical Table Market Revenue Share (%), by Country 2024 & 2032
- Figure 10: Europe Surgical Table Market Volume Share (%), by Country 2024 & 2032
- Figure 11: Asia Pacific Surgical Table Market Revenue (Million), by Country 2024 & 2032
- Figure 12: Asia Pacific Surgical Table Market Volume (K Unit), by Country 2024 & 2032
- Figure 13: Asia Pacific Surgical Table Market Revenue Share (%), by Country 2024 & 2032
- Figure 14: Asia Pacific Surgical Table Market Volume Share (%), by Country 2024 & 2032
- Figure 15: Middle East and Africa Surgical Table Market Revenue (Million), by Country 2024 & 2032
- Figure 16: Middle East and Africa Surgical Table Market Volume (K Unit), by Country 2024 & 2032
- Figure 17: Middle East and Africa Surgical Table Market Revenue Share (%), by Country 2024 & 2032
- Figure 18: Middle East and Africa Surgical Table Market Volume Share (%), by Country 2024 & 2032
- Figure 19: South America Surgical Table Market Revenue (Million), by Country 2024 & 2032
- Figure 20: South America Surgical Table Market Volume (K Unit), by Country 2024 & 2032
- Figure 21: South America Surgical Table Market Revenue Share (%), by Country 2024 & 2032
- Figure 22: South America Surgical Table Market Volume Share (%), by Country 2024 & 2032
- Figure 23: North America Surgical Table Market Revenue (Million), by Type of Surgery 2024 & 2032
- Figure 24: North America Surgical Table Market Volume (K Unit), by Type of Surgery 2024 & 2032
- Figure 25: North America Surgical Table Market Revenue Share (%), by Type of Surgery 2024 & 2032
- Figure 26: North America Surgical Table Market Volume Share (%), by Type of Surgery 2024 & 2032
- Figure 27: North America Surgical Table Market Revenue (Million), by Material 2024 & 2032
- Figure 28: North America Surgical Table Market Volume (K Unit), by Material 2024 & 2032
- Figure 29: North America Surgical Table Market Revenue Share (%), by Material 2024 & 2032
- Figure 30: North America Surgical Table Market Volume Share (%), by Material 2024 & 2032
- Figure 31: North America Surgical Table Market Revenue (Million), by End User 2024 & 2032
- Figure 32: North America Surgical Table Market Volume (K Unit), by End User 2024 & 2032
- Figure 33: North America Surgical Table Market Revenue Share (%), by End User 2024 & 2032
- Figure 34: North America Surgical Table Market Volume Share (%), by End User 2024 & 2032
- Figure 35: North America Surgical Table Market Revenue (Million), by Country 2024 & 2032
- Figure 36: North America Surgical Table Market Volume (K Unit), by Country 2024 & 2032
- Figure 37: North America Surgical Table Market Revenue Share (%), by Country 2024 & 2032
- Figure 38: North America Surgical Table Market Volume Share (%), by Country 2024 & 2032
- Figure 39: Europe Surgical Table Market Revenue (Million), by Type of Surgery 2024 & 2032
- Figure 40: Europe Surgical Table Market Volume (K Unit), by Type of Surgery 2024 & 2032
- Figure 41: Europe Surgical Table Market Revenue Share (%), by Type of Surgery 2024 & 2032
- Figure 42: Europe Surgical Table Market Volume Share (%), by Type of Surgery 2024 & 2032
- Figure 43: Europe Surgical Table Market Revenue (Million), by Material 2024 & 2032
- Figure 44: Europe Surgical Table Market Volume (K Unit), by Material 2024 & 2032
- Figure 45: Europe Surgical Table Market Revenue Share (%), by Material 2024 & 2032
- Figure 46: Europe Surgical Table Market Volume Share (%), by Material 2024 & 2032
- Figure 47: Europe Surgical Table Market Revenue (Million), by End User 2024 & 2032
- Figure 48: Europe Surgical Table Market Volume (K Unit), by End User 2024 & 2032
- Figure 49: Europe Surgical Table Market Revenue Share (%), by End User 2024 & 2032
- Figure 50: Europe Surgical Table Market Volume Share (%), by End User 2024 & 2032
- Figure 51: Europe Surgical Table Market Revenue (Million), by Country 2024 & 2032
- Figure 52: Europe Surgical Table Market Volume (K Unit), by Country 2024 & 2032
- Figure 53: Europe Surgical Table Market Revenue Share (%), by Country 2024 & 2032
- Figure 54: Europe Surgical Table Market Volume Share (%), by Country 2024 & 2032
- Figure 55: Asia Pacific Surgical Table Market Revenue (Million), by Type of Surgery 2024 & 2032
- Figure 56: Asia Pacific Surgical Table Market Volume (K Unit), by Type of Surgery 2024 & 2032
- Figure 57: Asia Pacific Surgical Table Market Revenue Share (%), by Type of Surgery 2024 & 2032
- Figure 58: Asia Pacific Surgical Table Market Volume Share (%), by Type of Surgery 2024 & 2032
- Figure 59: Asia Pacific Surgical Table Market Revenue (Million), by Material 2024 & 2032
- Figure 60: Asia Pacific Surgical Table Market Volume (K Unit), by Material 2024 & 2032
- Figure 61: Asia Pacific Surgical Table Market Revenue Share (%), by Material 2024 & 2032
- Figure 62: Asia Pacific Surgical Table Market Volume Share (%), by Material 2024 & 2032
- Figure 63: Asia Pacific Surgical Table Market Revenue (Million), by End User 2024 & 2032
- Figure 64: Asia Pacific Surgical Table Market Volume (K Unit), by End User 2024 & 2032
- Figure 65: Asia Pacific Surgical Table Market Revenue Share (%), by End User 2024 & 2032
- Figure 66: Asia Pacific Surgical Table Market Volume Share (%), by End User 2024 & 2032
- Figure 67: Asia Pacific Surgical Table Market Revenue (Million), by Country 2024 & 2032
- Figure 68: Asia Pacific Surgical Table Market Volume (K Unit), by Country 2024 & 2032
- Figure 69: Asia Pacific Surgical Table Market Revenue Share (%), by Country 2024 & 2032
- Figure 70: Asia Pacific Surgical Table Market Volume Share (%), by Country 2024 & 2032
- Figure 71: Middle East and Africa Surgical Table Market Revenue (Million), by Type of Surgery 2024 & 2032
- Figure 72: Middle East and Africa Surgical Table Market Volume (K Unit), by Type of Surgery 2024 & 2032
- Figure 73: Middle East and Africa Surgical Table Market Revenue Share (%), by Type of Surgery 2024 & 2032
- Figure 74: Middle East and Africa Surgical Table Market Volume Share (%), by Type of Surgery 2024 & 2032
- Figure 75: Middle East and Africa Surgical Table Market Revenue (Million), by Material 2024 & 2032
- Figure 76: Middle East and Africa Surgical Table Market Volume (K Unit), by Material 2024 & 2032
- Figure 77: Middle East and Africa Surgical Table Market Revenue Share (%), by Material 2024 & 2032
- Figure 78: Middle East and Africa Surgical Table Market Volume Share (%), by Material 2024 & 2032
- Figure 79: Middle East and Africa Surgical Table Market Revenue (Million), by End User 2024 & 2032
- Figure 80: Middle East and Africa Surgical Table Market Volume (K Unit), by End User 2024 & 2032
- Figure 81: Middle East and Africa Surgical Table Market Revenue Share (%), by End User 2024 & 2032
- Figure 82: Middle East and Africa Surgical Table Market Volume Share (%), by End User 2024 & 2032
- Figure 83: Middle East and Africa Surgical Table Market Revenue (Million), by Country 2024 & 2032
- Figure 84: Middle East and Africa Surgical Table Market Volume (K Unit), by Country 2024 & 2032
- Figure 85: Middle East and Africa Surgical Table Market Revenue Share (%), by Country 2024 & 2032
- Figure 86: Middle East and Africa Surgical Table Market Volume Share (%), by Country 2024 & 2032
- Figure 87: South America Surgical Table Market Revenue (Million), by Type of Surgery 2024 & 2032
- Figure 88: South America Surgical Table Market Volume (K Unit), by Type of Surgery 2024 & 2032
- Figure 89: South America Surgical Table Market Revenue Share (%), by Type of Surgery 2024 & 2032
- Figure 90: South America Surgical Table Market Volume Share (%), by Type of Surgery 2024 & 2032
- Figure 91: South America Surgical Table Market Revenue (Million), by Material 2024 & 2032
- Figure 92: South America Surgical Table Market Volume (K Unit), by Material 2024 & 2032
- Figure 93: South America Surgical Table Market Revenue Share (%), by Material 2024 & 2032
- Figure 94: South America Surgical Table Market Volume Share (%), by Material 2024 & 2032
- Figure 95: South America Surgical Table Market Revenue (Million), by End User 2024 & 2032
- Figure 96: South America Surgical Table Market Volume (K Unit), by End User 2024 & 2032
- Figure 97: South America Surgical Table Market Revenue Share (%), by End User 2024 & 2032
- Figure 98: South America Surgical Table Market Volume Share (%), by End User 2024 & 2032
- Figure 99: South America Surgical Table Market Revenue (Million), by Country 2024 & 2032
- Figure 100: South America Surgical Table Market Volume (K Unit), by Country 2024 & 2032
- Figure 101: South America Surgical Table Market Revenue Share (%), by Country 2024 & 2032
- Figure 102: South America Surgical Table Market Volume Share (%), by Country 2024 & 2032
List of Tables
- Table 1: Global Surgical Table Market Revenue Million Forecast, by Region 2019 & 2032
- Table 2: Global Surgical Table Market Volume K Unit Forecast, by Region 2019 & 2032
- Table 3: Global Surgical Table Market Revenue Million Forecast, by Type of Surgery 2019 & 2032
- Table 4: Global Surgical Table Market Volume K Unit Forecast, by Type of Surgery 2019 & 2032
- Table 5: Global Surgical Table Market Revenue Million Forecast, by Material 2019 & 2032
- Table 6: Global Surgical Table Market Volume K Unit Forecast, by Material 2019 & 2032
- Table 7: Global Surgical Table Market Revenue Million Forecast, by End User 2019 & 2032
- Table 8: Global Surgical Table Market Volume K Unit Forecast, by End User 2019 & 2032
- Table 9: Global Surgical Table Market Revenue Million Forecast, by Region 2019 & 2032
- Table 10: Global Surgical Table Market Volume K Unit Forecast, by Region 2019 & 2032
- Table 11: Global Surgical Table Market Revenue Million Forecast, by Country 2019 & 2032
- Table 12: Global Surgical Table Market Volume K Unit Forecast, by Country 2019 & 2032
- Table 13: United States Surgical Table Market Revenue (Million) Forecast, by Application 2019 & 2032
- Table 14: United States Surgical Table Market Volume (K Unit) Forecast, by Application 2019 & 2032
- Table 15: Canada Surgical Table Market Revenue (Million) Forecast, by Application 2019 & 2032
- Table 16: Canada Surgical Table Market Volume (K Unit) Forecast, by Application 2019 & 2032
- Table 17: Mexico Surgical Table Market Revenue (Million) Forecast, by Application 2019 & 2032
- Table 18: Mexico Surgical Table Market Volume (K Unit) Forecast, by Application 2019 & 2032
- Table 19: Global Surgical Table Market Revenue Million Forecast, by Country 2019 & 2032
- Table 20: Global Surgical Table Market Volume K Unit Forecast, by Country 2019 & 2032
- Table 21: Germany Surgical Table Market Revenue (Million) Forecast, by Application 2019 & 2032
- Table 22: Germany Surgical Table Market Volume (K Unit) Forecast, by Application 2019 & 2032
- Table 23: United Kingdom Surgical Table Market Revenue (Million) Forecast, by Application 2019 & 2032
- Table 24: United Kingdom Surgical Table Market Volume (K Unit) Forecast, by Application 2019 & 2032
- Table 25: France Surgical Table Market Revenue (Million) Forecast, by Application 2019 & 2032
- Table 26: France Surgical Table Market Volume (K Unit) Forecast, by Application 2019 & 2032
- Table 27: Italy Surgical Table Market Revenue (Million) Forecast, by Application 2019 & 2032
- Table 28: Italy Surgical Table Market Volume (K Unit) Forecast, by Application 2019 & 2032
- Table 29: Spain Surgical Table Market Revenue (Million) Forecast, by Application 2019 & 2032
- Table 30: Spain Surgical Table Market Volume (K Unit) Forecast, by Application 2019 & 2032
- Table 31: Rest of Europe Surgical Table Market Revenue (Million) Forecast, by Application 2019 & 2032
- Table 32: Rest of Europe Surgical Table Market Volume (K Unit) Forecast, by Application 2019 & 2032
- Table 33: Global Surgical Table Market Revenue Million Forecast, by Country 2019 & 2032
- Table 34: Global Surgical Table Market Volume K Unit Forecast, by Country 2019 & 2032
- Table 35: China Surgical Table Market Revenue (Million) Forecast, by Application 2019 & 2032
- Table 36: China Surgical Table Market Volume (K Unit) Forecast, by Application 2019 & 2032
- Table 37: Japan Surgical Table Market Revenue (Million) Forecast, by Application 2019 & 2032
- Table 38: Japan Surgical Table Market Volume (K Unit) Forecast, by Application 2019 & 2032
- Table 39: India Surgical Table Market Revenue (Million) Forecast, by Application 2019 & 2032
- Table 40: India Surgical Table Market Volume (K Unit) Forecast, by Application 2019 & 2032
- Table 41: Australia Surgical Table Market Revenue (Million) Forecast, by Application 2019 & 2032
- Table 42: Australia Surgical Table Market Volume (K Unit) Forecast, by Application 2019 & 2032
- Table 43: South Korea Surgical Table Market Revenue (Million) Forecast, by Application 2019 & 2032
- Table 44: South Korea Surgical Table Market Volume (K Unit) Forecast, by Application 2019 & 2032
- Table 45: Rest of Asia Pacific Surgical Table Market Revenue (Million) Forecast, by Application 2019 & 2032
- Table 46: Rest of Asia Pacific Surgical Table Market Volume (K Unit) Forecast, by Application 2019 & 2032
- Table 47: Global Surgical Table Market Revenue Million Forecast, by Country 2019 & 2032
- Table 48: Global Surgical Table Market Volume K Unit Forecast, by Country 2019 & 2032
- Table 49: GCC Surgical Table Market Revenue (Million) Forecast, by Application 2019 & 2032
- Table 50: GCC Surgical Table Market Volume (K Unit) Forecast, by Application 2019 & 2032
- Table 51: South Africa Surgical Table Market Revenue (Million) Forecast, by Application 2019 & 2032
- Table 52: South Africa Surgical Table Market Volume (K Unit) Forecast, by Application 2019 & 2032
- Table 53: Rest of Middle East and Africa Surgical Table Market Revenue (Million) Forecast, by Application 2019 & 2032
- Table 54: Rest of Middle East and Africa Surgical Table Market Volume (K Unit) Forecast, by Application 2019 & 2032
- Table 55: Global Surgical Table Market Revenue Million Forecast, by Country 2019 & 2032
- Table 56: Global Surgical Table Market Volume K Unit Forecast, by Country 2019 & 2032
- Table 57: Brazil Surgical Table Market Revenue (Million) Forecast, by Application 2019 & 2032
- Table 58: Brazil Surgical Table Market Volume (K Unit) Forecast, by Application 2019 & 2032
- Table 59: Argentina Surgical Table Market Revenue (Million) Forecast, by Application 2019 & 2032
- Table 60: Argentina Surgical Table Market Volume (K Unit) Forecast, by Application 2019 & 2032
- Table 61: Rest of South America Surgical Table Market Revenue (Million) Forecast, by Application 2019 & 2032
- Table 62: Rest of South America Surgical Table Market Volume (K Unit) Forecast, by Application 2019 & 2032
- Table 63: Global Surgical Table Market Revenue Million Forecast, by Type of Surgery 2019 & 2032
- Table 64: Global Surgical Table Market Volume K Unit Forecast, by Type of Surgery 2019 & 2032
- Table 65: Global Surgical Table Market Revenue Million Forecast, by Material 2019 & 2032
- Table 66: Global Surgical Table Market Volume K Unit Forecast, by Material 2019 & 2032
- Table 67: Global Surgical Table Market Revenue Million Forecast, by End User 2019 & 2032
- Table 68: Global Surgical Table Market Volume K Unit Forecast, by End User 2019 & 2032
- Table 69: Global Surgical Table Market Revenue Million Forecast, by Country 2019 & 2032
- Table 70: Global Surgical Table Market Volume K Unit Forecast, by Country 2019 & 2032
- Table 71: United States Surgical Table Market Revenue (Million) Forecast, by Application 2019 & 2032
- Table 72: United States Surgical Table Market Volume (K Unit) Forecast, by Application 2019 & 2032
- Table 73: Canada Surgical Table Market Revenue (Million) Forecast, by Application 2019 & 2032
- Table 74: Canada Surgical Table Market Volume (K Unit) Forecast, by Application 2019 & 2032
- Table 75: Mexico Surgical Table Market Revenue (Million) Forecast, by Application 2019 & 2032
- Table 76: Mexico Surgical Table Market Volume (K Unit) Forecast, by Application 2019 & 2032
- Table 77: Global Surgical Table Market Revenue Million Forecast, by Type of Surgery 2019 & 2032
- Table 78: Global Surgical Table Market Volume K Unit Forecast, by Type of Surgery 2019 & 2032
- Table 79: Global Surgical Table Market Revenue Million Forecast, by Material 2019 & 2032
- Table 80: Global Surgical Table Market Volume K Unit Forecast, by Material 2019 & 2032
- Table 81: Global Surgical Table Market Revenue Million Forecast, by End User 2019 & 2032
- Table 82: Global Surgical Table Market Volume K Unit Forecast, by End User 2019 & 2032
- Table 83: Global Surgical Table Market Revenue Million Forecast, by Country 2019 & 2032
- Table 84: Global Surgical Table Market Volume K Unit Forecast, by Country 2019 & 2032
- Table 85: Germany Surgical Table Market Revenue (Million) Forecast, by Application 2019 & 2032
- Table 86: Germany Surgical Table Market Volume (K Unit) Forecast, by Application 2019 & 2032
- Table 87: United Kingdom Surgical Table Market Revenue (Million) Forecast, by Application 2019 & 2032
- Table 88: United Kingdom Surgical Table Market Volume (K Unit) Forecast, by Application 2019 & 2032
- Table 89: France Surgical Table Market Revenue (Million) Forecast, by Application 2019 & 2032
- Table 90: France Surgical Table Market Volume (K Unit) Forecast, by Application 2019 & 2032
- Table 91: Italy Surgical Table Market Revenue (Million) Forecast, by Application 2019 & 2032
- Table 92: Italy Surgical Table Market Volume (K Unit) Forecast, by Application 2019 & 2032
- Table 93: Spain Surgical Table Market Revenue (Million) Forecast, by Application 2019 & 2032
- Table 94: Spain Surgical Table Market Volume (K Unit) Forecast, by Application 2019 & 2032
- Table 95: Rest of Europe Surgical Table Market Revenue (Million) Forecast, by Application 2019 & 2032
- Table 96: Rest of Europe Surgical Table Market Volume (K Unit) Forecast, by Application 2019 & 2032
- Table 97: Global Surgical Table Market Revenue Million Forecast, by Type of Surgery 2019 & 2032
- Table 98: Global Surgical Table Market Volume K Unit Forecast, by Type of Surgery 2019 & 2032
- Table 99: Global Surgical Table Market Revenue Million Forecast, by Material 2019 & 2032
- Table 100: Global Surgical Table Market Volume K Unit Forecast, by Material 2019 & 2032
- Table 101: Global Surgical Table Market Revenue Million Forecast, by End User 2019 & 2032
- Table 102: Global Surgical Table Market Volume K Unit Forecast, by End User 2019 & 2032
- Table 103: Global Surgical Table Market Revenue Million Forecast, by Country 2019 & 2032
- Table 104: Global Surgical Table Market Volume K Unit Forecast, by Country 2019 & 2032
- Table 105: China Surgical Table Market Revenue (Million) Forecast, by Application 2019 & 2032
- Table 106: China Surgical Table Market Volume (K Unit) Forecast, by Application 2019 & 2032
- Table 107: Japan Surgical Table Market Revenue (Million) Forecast, by Application 2019 & 2032
- Table 108: Japan Surgical Table Market Volume (K Unit) Forecast, by Application 2019 & 2032
- Table 109: India Surgical Table Market Revenue (Million) Forecast, by Application 2019 & 2032
- Table 110: India Surgical Table Market Volume (K Unit) Forecast, by Application 2019 & 2032
- Table 111: Australia Surgical Table Market Revenue (Million) Forecast, by Application 2019 & 2032
- Table 112: Australia Surgical Table Market Volume (K Unit) Forecast, by Application 2019 & 2032
- Table 113: South Korea Surgical Table Market Revenue (Million) Forecast, by Application 2019 & 2032
- Table 114: South Korea Surgical Table Market Volume (K Unit) Forecast, by Application 2019 & 2032
- Table 115: Rest of Asia Pacific Surgical Table Market Revenue (Million) Forecast, by Application 2019 & 2032
- Table 116: Rest of Asia Pacific Surgical Table Market Volume (K Unit) Forecast, by Application 2019 & 2032
- Table 117: Global Surgical Table Market Revenue Million Forecast, by Type of Surgery 2019 & 2032
- Table 118: Global Surgical Table Market Volume K Unit Forecast, by Type of Surgery 2019 & 2032
- Table 119: Global Surgical Table Market Revenue Million Forecast, by Material 2019 & 2032
- Table 120: Global Surgical Table Market Volume K Unit Forecast, by Material 2019 & 2032
- Table 121: Global Surgical Table Market Revenue Million Forecast, by End User 2019 & 2032
- Table 122: Global Surgical Table Market Volume K Unit Forecast, by End User 2019 & 2032
- Table 123: Global Surgical Table Market Revenue Million Forecast, by Country 2019 & 2032
- Table 124: Global Surgical Table Market Volume K Unit Forecast, by Country 2019 & 2032
- Table 125: GCC Surgical Table Market Revenue (Million) Forecast, by Application 2019 & 2032
- Table 126: GCC Surgical Table Market Volume (K Unit) Forecast, by Application 2019 & 2032
- Table 127: South Africa Surgical Table Market Revenue (Million) Forecast, by Application 2019 & 2032
- Table 128: South Africa Surgical Table Market Volume (K Unit) Forecast, by Application 2019 & 2032
- Table 129: Rest of Middle East and Africa Surgical Table Market Revenue (Million) Forecast, by Application 2019 & 2032
- Table 130: Rest of Middle East and Africa Surgical Table Market Volume (K Unit) Forecast, by Application 2019 & 2032
- Table 131: Global Surgical Table Market Revenue Million Forecast, by Type of Surgery 2019 & 2032
- Table 132: Global Surgical Table Market Volume K Unit Forecast, by Type of Surgery 2019 & 2032
- Table 133: Global Surgical Table Market Revenue Million Forecast, by Material 2019 & 2032
- Table 134: Global Surgical Table Market Volume K Unit Forecast, by Material 2019 & 2032
- Table 135: Global Surgical Table Market Revenue Million Forecast, by End User 2019 & 2032
- Table 136: Global Surgical Table Market Volume K Unit Forecast, by End User 2019 & 2032
- Table 137: Global Surgical Table Market Revenue Million Forecast, by Country 2019 & 2032
- Table 138: Global Surgical Table Market Volume K Unit Forecast, by Country 2019 & 2032
- Table 139: Brazil Surgical Table Market Revenue (Million) Forecast, by Application 2019 & 2032
- Table 140: Brazil Surgical Table Market Volume (K Unit) Forecast, by Application 2019 & 2032
- Table 141: Argentina Surgical Table Market Revenue (Million) Forecast, by Application 2019 & 2032
- Table 142: Argentina Surgical Table Market Volume (K Unit) Forecast, by Application 2019 & 2032
- Table 143: Rest of South America Surgical Table Market Revenue (Million) Forecast, by Application 2019 & 2032
- Table 144: Rest of South America Surgical Table Market Volume (K Unit) Forecast, by Application 2019 & 2032
Frequently Asked Questions
1. What is the projected Compound Annual Growth Rate (CAGR) of the Surgical Table Market?
The projected CAGR is approximately 3.20%.
2. Which companies are prominent players in the Surgical Table Market?
Key companies in the market include Eschmann Holdings Ltd, NUVO Inc, Skytron LLC, Schaerer Medical USA Inc (Schaerer Mayfield Medical AG), Aga Sanitatsartikel Gmbh, Trumpf Medical (Hill-Rom Holdings Inc ), Getinge AB, Staan Bio-Med Engineering Private Limited, Stryker Corporation, Alvo Medical, Steris PLC, Mizuho OSI (MIZUHO Corporation), Allengers Medical Systems Limited, Merivaara Corp.
3. What are the main segments of the Surgical Table Market?
The market segments include Type of Surgery, Material, End User.
4. Can you provide details about the market size?
The market size is estimated to be USD XX Million as of 2022.
5. What are some drivers contributing to market growth?
Growing Number of Surgeries. Coupled with the Increasing Number of Ambulatory Surgical Centers; Technological Advancements in Operation Theatres.
6. What are the notable trends driving market growth?
General Surgical Table is Expected to Witness Strong Growth Over the Forecast Period.
7. Are there any restraints impacting market growth?
High Cost of Composite Surgical Tables; Lack of Skilled Labor.
8. Can you provide examples of recent developments in the market?
April 2022: Getinge partnered with the International Finance Corporation (IFC) to help increase access to medical equipment across Africa.
9. What pricing options are available for accessing the report?
Pricing options include single-user, multi-user, and enterprise licenses priced at USD 4750, USD 5250, and USD 8750 respectively.
10. Is the market size provided in terms of value or volume?
The market size is provided in terms of value, measured in Million and volume, measured in K Unit.
11. Are there any specific market keywords associated with the report?
Yes, the market keyword associated with the report is "Surgical Table Market," which aids in identifying and referencing the specific market segment covered.
12. How do I determine which pricing option suits my needs best?
The pricing options vary based on user requirements and access needs. Individual users may opt for single-user licenses, while businesses requiring broader access may choose multi-user or enterprise licenses for cost-effective access to the report.
13. Are there any additional resources or data provided in the Surgical Table Market report?
While the report offers comprehensive insights, it's advisable to review the specific contents or supplementary materials provided to ascertain if additional resources or data are available.
14. How can I stay updated on further developments or reports in the Surgical Table Market?
To stay informed about further developments, trends, and reports in the Surgical Table Market, consider subscribing to industry newsletters, following relevant companies and organizations, or regularly checking reputable industry news sources and publications.
Methodology
Step 1 - Identification of Relevant Samples Size from Population Database


Step 2 - Approaches for Defining Global Market Size (Value, Volume* & Price*)

Note*: In applicable scenarios
Step 3 - Data Sources
Primary Research
- Web Analytics
- Survey Reports
- Research Institute
- Latest Research Reports
- Opinion Leaders
Secondary Research
- Annual Reports
- White Paper
- Latest Press Release
- Industry Association
- Paid Database
- Investor Presentations

Step 4 - Data Triangulation
Involves using different sources of information in order to increase the validity of a study
These sources are likely to be stakeholders in a program - participants, other researchers, program staff, other community members, and so on.
Then we put all data in single framework & apply various statistical tools to find out the dynamic on the market.
During the analysis stage, feedback from the stakeholder groups would be compared to determine areas of agreement as well as areas of divergence


