
Key Insights
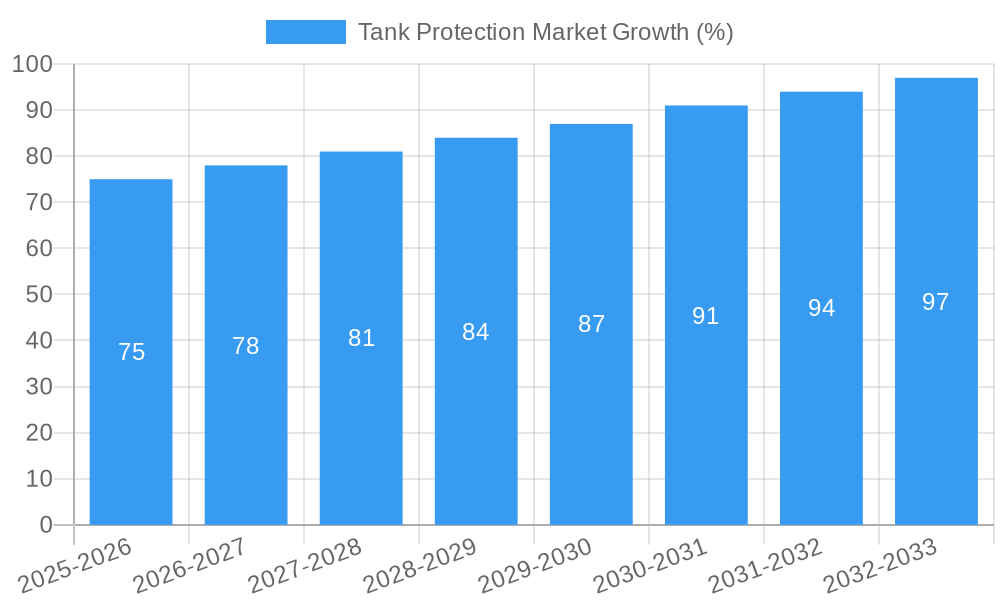
The global tank protection market is experiencing robust growth, driven by increasing demand for enhanced security and safety across various industries. The market's expansion is fueled by several key factors, including the rising prevalence of industrial accidents, stringent government regulations mandating improved tank protection, and the growing adoption of advanced materials like polyurethane (PU) and rockwool offering superior insulation and impact resistance. The transportation and storage sectors are significant contributors to this market's growth, with applications ranging from protecting fuel tanks in vehicles and marine vessels to safeguarding chemical storage tanks in industrial facilities. A projected CAGR exceeding 3.00% suggests a steady and continuous expansion throughout the forecast period (2025-2033). This growth is further stimulated by innovations in material science, leading to lighter, stronger, and more cost-effective tank protection solutions. Geographic expansion, particularly in rapidly developing economies of Asia-Pacific and South America, contributes significantly to market expansion, alongside increased infrastructure development projects.
However, the market faces challenges. High initial investment costs associated with implementing advanced tank protection systems could restrain market growth, particularly among smaller businesses. Furthermore, the availability and fluctuation in prices of raw materials, coupled with potential supply chain disruptions, could impact overall market profitability and expansion. Despite these restraints, the long-term outlook for the tank protection market remains positive, with continuous technological advancements and rising awareness of safety regulations driving sustained growth. Key players such as Kumtek Thermotech, Rockwool International A/S, and Owens Corning are actively contributing to this growth through innovation and expansion strategies, fostering competition and driving down costs. The market segmentation by material (PU, rockwool, fiberglass, etc.) and application (transportation, storage) provides further opportunities for targeted market penetration and specialization.
Tank Protection Market: A Comprehensive Report (2019-2033)
This in-depth report provides a comprehensive analysis of the global Tank Protection Market, offering invaluable insights for industry professionals, investors, and stakeholders. Covering the period from 2019 to 2033, with a focus on 2025, this report dissects market dynamics, segmentation, competitive landscapes, and future growth prospects. The report's findings are based on rigorous research and analysis, incorporating data from both historical periods (2019-2024) and future projections (2025-2033). Expected market value is projected to reach xx Million by 2033.
Tank Protection Market Market Structure & Innovation Trends
The Tank Protection Market exhibits a moderately concentrated structure, with key players holding significant market share. However, the market also features several smaller, specialized companies offering niche solutions. Innovation in the sector is primarily driven by the need for enhanced corrosion resistance, improved thermal efficiency, and sustainable materials. Stringent environmental regulations, particularly concerning hazardous waste disposal, are shaping product development. Product substitutes, such as advanced coatings and linings, pose a competitive threat. End-user demographics span diverse sectors including transportation, storage, and various industrial applications.
Key Metrics & Observations:
- Market share of top 5 players: xx% (2025)
- Recent M&A activity has witnessed xx Million in deal value (2022). This includes the notable acquisition of Rockwool India by Saint Gobain.
- Regulatory compliance drives innovation in environmentally friendly materials.
- Product substitution is a growing trend, impacting market dynamics.
Tank Protection Market Market Dynamics & Trends
The Tank Protection Market is experiencing robust growth, driven by factors such as increasing demand from the oil & gas, chemical, and food & beverage industries. Technological advancements in materials science, particularly in the development of high-performance polymers and composites, are significantly impacting market trends. Consumer preference for energy-efficient and environmentally sustainable solutions is driving the demand for insulation materials. Competitive dynamics are shaped by technological innovation, pricing strategies, and the growing emphasis on sustainable practices.
Key Metrics & Observations:
- CAGR (2025-2033): xx%
- Market penetration of PU (Polyurethane) materials: xx% (2025)
- Growing adoption of sustainable materials and technologies
- Intensifying competition among major players
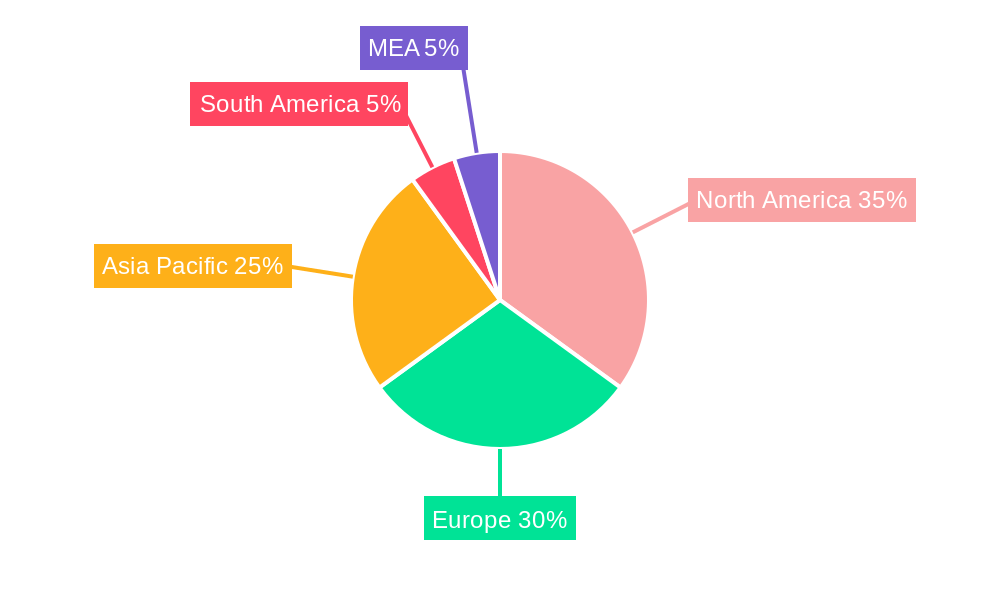
Dominant Regions & Segments in Tank Protection Market
The report identifies [Region Name] as the leading region in the Tank Protection Market, driven by robust infrastructure development and strong industrial growth. Within the material segments, PU (Polyurethane) holds a significant market share due to its versatility and cost-effectiveness. In terms of application, the storage sector dominates owing to its large-scale requirements for corrosion and insulation solutions.
Key Drivers for Leading Segments:
- [Region Name]: Robust industrialization, government investments in infrastructure projects, favorable economic policies.
- PU (Polyurethane): Cost-effectiveness, ease of application, excellent insulation properties.
- Storage Application: Large-scale demand, stringent safety & regulatory requirements.
Dominance Analysis:
The dominance of [Region Name], PU (Polyurethane), and the Storage sector is expected to continue during the forecast period, although other regions and material types are projected to experience substantial growth. This is primarily due to growing industrialization in other regions, expanding applications in transportation and other sectors, and the adoption of newer materials like cellular glass with enhanced properties.
Tank Protection Market Product Innovations
Recent innovations in the Tank Protection Market focus on enhancing durability, thermal efficiency, and environmental sustainability. New materials, such as advanced polymers and composites with improved corrosion resistance and thermal insulation properties, are gaining traction. The focus on lightweight yet durable materials is also influencing product development, particularly in the transportation sector. These innovations aim to meet growing demand while complying with evolving environmental standards.
Report Scope & Segmentation Analysis
This report segments the Tank Protection Market based on material type (PU (Polyurethane), Rockwool, Fiberglass, Cellular Glass, Other Materials) and application (Transportation, Storage). Each segment is analyzed based on its growth potential, market size, competitive dynamics, and key influencing factors.
Material Segmentation:
- PU (Polyurethane): Expected to maintain significant growth due to its versatility and cost-effectiveness.
- Rockwool: Growth driven by its fire-resistant and thermal insulation properties.
- Fiberglass: A cost-effective option, but facing challenges from newer materials with improved performance characteristics.
- Cellular Glass: Growing popularity due to its superior thermal insulation and corrosion resistance properties.
- Other Materials: Includes a variety of specialized materials addressing niche applications.
Application Segmentation:
- Transportation: Growing demand for lightweight and durable tank protection solutions.
- Storage: Dominant segment, driven by large-scale applications in various industries.
Key Drivers of Tank Protection Market Growth
The Tank Protection Market is propelled by several key factors, including:
- Stringent environmental regulations: Driving the demand for environmentally friendly solutions.
- Rising demand from various industries: particularly oil & gas, chemical, and food & beverage.
- Advancements in materials science: leading to the development of high-performance, durable materials.
- Increased investments in infrastructure projects: creating opportunities for expansion.
Challenges in the Tank Protection Market Sector
The Tank Protection Market faces challenges including:
- Fluctuations in raw material prices: Affecting production costs and profitability.
- Stringent regulatory compliance: requiring investment in research and development.
- Intense competition: requiring companies to innovate and optimize their product offerings.
- Supply chain disruptions: occasionally impacting production and availability.
Emerging Opportunities in Tank Protection Market
Emerging opportunities in the Tank Protection Market include:
- Growing demand for sustainable and eco-friendly materials: creating potential for new product development.
- Expansion into new geographic markets: especially in developing economies with growing industrialization.
- Technological advancements: such as smart sensors and remote monitoring systems.
- Increased focus on lifecycle cost optimization: driving demand for higher-performance, longer-lasting solutions.
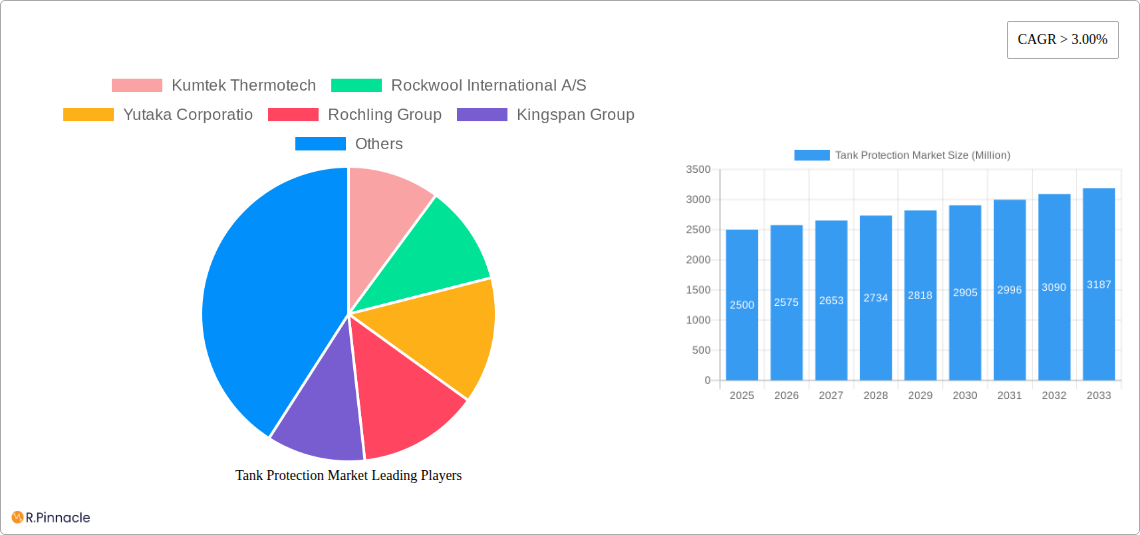
Leading Players in the Tank Protection Market Market
- Kumtek Thermotech
- Rockwool International A/S
- Yutaka Corporatio
- Rochling Group
- Kingspan Group
- Owens Corning
- Archtech Building Systems (Nova Guard)
- Saint Gobain
- Armacell International SA
Key Developments in Tank Protection Market Industry
- February 2022: Saint Gobain acquired Rockwool India from the Alghanim Group, expanding its insulation solutions portfolio.
- September 2022: Northern Technologies International Corporation secured a contract with BP Exploration Limited p.l.c. for chemical corrosion protection services for 12 storage tanks until the end of 2025.
Future Outlook for Tank Protection Market Market
The Tank Protection Market is poised for continued growth, driven by increasing industrialization, infrastructure development, and the growing adoption of sustainable solutions. Strategic partnerships, technological innovation, and expanding into new markets will be key to success in this dynamic market. The focus on improved materials with longer lifespans, reduced maintenance needs, and enhanced environmental performance will shape future market trends.
Tank Protection Market Segmentation
-
1. Material
- 1.1. PU (Polyurethane)
- 1.2. Rockwool
- 1.3. Fiberglass
- 1.4. Cellular Glass
- 1.5. Other Materials
-
2. Application
- 2.1. Transportation
- 2.2. Storage
Tank Protection Market Segmentation By Geography
-
1. North America
- 1.1. United States
- 1.2. Canada
- 1.3. Mexico
- 1.4. Rest of North America
-
2. South America
- 2.1. Brazil
- 2.2. Venezuela
- 2.3. Rest of South America
-
3. Europe
- 3.1. Norway
- 3.2. United Kingdom
- 3.3. Russian Federation
- 3.4. Rest of Europe
-
4. Middle East and Africa
- 4.1. Saudi Arabia
- 4.2. United Arab Emirates
- 4.3. Qatar
- 4.4. Iran
- 4.5. Nigeria
- 4.6. Algeria
- 4.7. Rest of Middle East and Africa
-
5. Asia Pacific
- 5.1. China
- 5.2. India
- 5.3. Japan
- 5.4. Australia
- 5.5. Rest of Asia Pacific
Tank Protection Market REPORT HIGHLIGHTS
| Aspects | Details |
|---|---|
| Study Period | 2019-2033 |
| Base Year | 2024 |
| Estimated Year | 2025 |
| Forecast Period | 2025-2033 |
| Historical Period | 2019-2024 |
| Growth Rate | CAGR of > 3.00% from 2019-2033 |
| Segmentation |
|
Table of Contents
- 1. Introduction
- 1.1. Research Scope
- 1.2. Market Segmentation
- 1.3. Research Methodology
- 1.4. Definitions and Assumptions
- 2. Executive Summary
- 2.1. Introduction
- 3. Market Dynamics
- 3.1. Introduction
- 3.2. Market Drivers
- 3.2.1. 4.; Increasing Demand for Backup Applications in Data Centers4.; Rising Power Outages to Increase the Demand for UPS
- 3.3. Market Restrains
- 3.3.1. 4.; High Capital Cost and Operation Expenditure of UPS Systems
- 3.4. Market Trends
- 3.4.1. Polyurethane Expected to Witness Significant Growth
- 4. Market Factor Analysis
- 4.1. Porters Five Forces
- 4.2. Supply/Value Chain
- 4.3. PESTEL analysis
- 4.4. Market Entropy
- 4.5. Patent/Trademark Analysis
- 5. Global Tank Protection Market Analysis, Insights and Forecast, 2019-2031
- 5.1. Market Analysis, Insights and Forecast - by Material
- 5.1.1. PU (Polyurethane)
- 5.1.2. Rockwool
- 5.1.3. Fiberglass
- 5.1.4. Cellular Glass
- 5.1.5. Other Materials
- 5.2. Market Analysis, Insights and Forecast - by Application
- 5.2.1. Transportation
- 5.2.2. Storage
- 5.3. Market Analysis, Insights and Forecast - by Region
- 5.3.1. North America
- 5.3.2. South America
- 5.3.3. Europe
- 5.3.4. Middle East and Africa
- 5.3.5. Asia Pacific
- 5.1. Market Analysis, Insights and Forecast - by Material
- 6. North America Tank Protection Market Analysis, Insights and Forecast, 2019-2031
- 6.1. Market Analysis, Insights and Forecast - by Material
- 6.1.1. PU (Polyurethane)
- 6.1.2. Rockwool
- 6.1.3. Fiberglass
- 6.1.4. Cellular Glass
- 6.1.5. Other Materials
- 6.2. Market Analysis, Insights and Forecast - by Application
- 6.2.1. Transportation
- 6.2.2. Storage
- 6.1. Market Analysis, Insights and Forecast - by Material
- 7. South America Tank Protection Market Analysis, Insights and Forecast, 2019-2031
- 7.1. Market Analysis, Insights and Forecast - by Material
- 7.1.1. PU (Polyurethane)
- 7.1.2. Rockwool
- 7.1.3. Fiberglass
- 7.1.4. Cellular Glass
- 7.1.5. Other Materials
- 7.2. Market Analysis, Insights and Forecast - by Application
- 7.2.1. Transportation
- 7.2.2. Storage
- 7.1. Market Analysis, Insights and Forecast - by Material
- 8. Europe Tank Protection Market Analysis, Insights and Forecast, 2019-2031
- 8.1. Market Analysis, Insights and Forecast - by Material
- 8.1.1. PU (Polyurethane)
- 8.1.2. Rockwool
- 8.1.3. Fiberglass
- 8.1.4. Cellular Glass
- 8.1.5. Other Materials
- 8.2. Market Analysis, Insights and Forecast - by Application
- 8.2.1. Transportation
- 8.2.2. Storage
- 8.1. Market Analysis, Insights and Forecast - by Material
- 9. Middle East and Africa Tank Protection Market Analysis, Insights and Forecast, 2019-2031
- 9.1. Market Analysis, Insights and Forecast - by Material
- 9.1.1. PU (Polyurethane)
- 9.1.2. Rockwool
- 9.1.3. Fiberglass
- 9.1.4. Cellular Glass
- 9.1.5. Other Materials
- 9.2. Market Analysis, Insights and Forecast - by Application
- 9.2.1. Transportation
- 9.2.2. Storage
- 9.1. Market Analysis, Insights and Forecast - by Material
- 10. Asia Pacific Tank Protection Market Analysis, Insights and Forecast, 2019-2031
- 10.1. Market Analysis, Insights and Forecast - by Material
- 10.1.1. PU (Polyurethane)
- 10.1.2. Rockwool
- 10.1.3. Fiberglass
- 10.1.4. Cellular Glass
- 10.1.5. Other Materials
- 10.2. Market Analysis, Insights and Forecast - by Application
- 10.2.1. Transportation
- 10.2.2. Storage
- 10.1. Market Analysis, Insights and Forecast - by Material
- 11. North America Tank Protection Market Analysis, Insights and Forecast, 2019-2031
- 11.1. Market Analysis, Insights and Forecast - By Country/Sub-region
- 11.1.1 United States
- 11.1.2 Canada
- 11.1.3 Mexico
- 12. Europe Tank Protection Market Analysis, Insights and Forecast, 2019-2031
- 12.1. Market Analysis, Insights and Forecast - By Country/Sub-region
- 12.1.1 Germany
- 12.1.2 United Kingdom
- 12.1.3 France
- 12.1.4 Spain
- 12.1.5 Italy
- 12.1.6 Spain
- 12.1.7 Belgium
- 12.1.8 Netherland
- 12.1.9 Nordics
- 12.1.10 Rest of Europe
- 13. Asia Pacific Tank Protection Market Analysis, Insights and Forecast, 2019-2031
- 13.1. Market Analysis, Insights and Forecast - By Country/Sub-region
- 13.1.1 China
- 13.1.2 Japan
- 13.1.3 India
- 13.1.4 South Korea
- 13.1.5 Southeast Asia
- 13.1.6 Australia
- 13.1.7 Indonesia
- 13.1.8 Phillipes
- 13.1.9 Singapore
- 13.1.10 Thailandc
- 13.1.11 Rest of Asia Pacific
- 14. South America Tank Protection Market Analysis, Insights and Forecast, 2019-2031
- 14.1. Market Analysis, Insights and Forecast - By Country/Sub-region
- 14.1.1 Brazil
- 14.1.2 Argentina
- 14.1.3 Peru
- 14.1.4 Chile
- 14.1.5 Colombia
- 14.1.6 Ecuador
- 14.1.7 Venezuela
- 14.1.8 Rest of South America
- 15. MEA Tank Protection Market Analysis, Insights and Forecast, 2019-2031
- 15.1. Market Analysis, Insights and Forecast - By Country/Sub-region
- 15.1.1 United Arab Emirates
- 15.1.2 Saudi Arabia
- 15.1.3 South Africa
- 15.1.4 Rest of Middle East and Africa
- 16. Competitive Analysis
- 16.1. Global Market Share Analysis 2024
- 16.2. Company Profiles
- 16.2.1 Kumtek Thermotech
- 16.2.1.1. Overview
- 16.2.1.2. Products
- 16.2.1.3. SWOT Analysis
- 16.2.1.4. Recent Developments
- 16.2.1.5. Financials (Based on Availability)
- 16.2.2 Rockwool International A/S
- 16.2.2.1. Overview
- 16.2.2.2. Products
- 16.2.2.3. SWOT Analysis
- 16.2.2.4. Recent Developments
- 16.2.2.5. Financials (Based on Availability)
- 16.2.3 Yutaka Corporatio
- 16.2.3.1. Overview
- 16.2.3.2. Products
- 16.2.3.3. SWOT Analysis
- 16.2.3.4. Recent Developments
- 16.2.3.5. Financials (Based on Availability)
- 16.2.4 Rochling Group
- 16.2.4.1. Overview
- 16.2.4.2. Products
- 16.2.4.3. SWOT Analysis
- 16.2.4.4. Recent Developments
- 16.2.4.5. Financials (Based on Availability)
- 16.2.5 Kingspan Group
- 16.2.5.1. Overview
- 16.2.5.2. Products
- 16.2.5.3. SWOT Analysis
- 16.2.5.4. Recent Developments
- 16.2.5.5. Financials (Based on Availability)
- 16.2.6 Owens Corning
- 16.2.6.1. Overview
- 16.2.6.2. Products
- 16.2.6.3. SWOT Analysis
- 16.2.6.4. Recent Developments
- 16.2.6.5. Financials (Based on Availability)
- 16.2.7 Archtech Building Systems (Nova Guard)
- 16.2.7.1. Overview
- 16.2.7.2. Products
- 16.2.7.3. SWOT Analysis
- 16.2.7.4. Recent Developments
- 16.2.7.5. Financials (Based on Availability)
- 16.2.8 Saint Gobain
- 16.2.8.1. Overview
- 16.2.8.2. Products
- 16.2.8.3. SWOT Analysis
- 16.2.8.4. Recent Developments
- 16.2.8.5. Financials (Based on Availability)
- 16.2.9 Armacell International SA
- 16.2.9.1. Overview
- 16.2.9.2. Products
- 16.2.9.3. SWOT Analysis
- 16.2.9.4. Recent Developments
- 16.2.9.5. Financials (Based on Availability)
- 16.2.1 Kumtek Thermotech
List of Figures
- Figure 1: Global Tank Protection Market Revenue Breakdown (Million, %) by Region 2024 & 2032
- Figure 2: North America Tank Protection Market Revenue (Million), by Country 2024 & 2032
- Figure 3: North America Tank Protection Market Revenue Share (%), by Country 2024 & 2032
- Figure 4: Europe Tank Protection Market Revenue (Million), by Country 2024 & 2032
- Figure 5: Europe Tank Protection Market Revenue Share (%), by Country 2024 & 2032
- Figure 6: Asia Pacific Tank Protection Market Revenue (Million), by Country 2024 & 2032
- Figure 7: Asia Pacific Tank Protection Market Revenue Share (%), by Country 2024 & 2032
- Figure 8: South America Tank Protection Market Revenue (Million), by Country 2024 & 2032
- Figure 9: South America Tank Protection Market Revenue Share (%), by Country 2024 & 2032
- Figure 10: MEA Tank Protection Market Revenue (Million), by Country 2024 & 2032
- Figure 11: MEA Tank Protection Market Revenue Share (%), by Country 2024 & 2032
- Figure 12: North America Tank Protection Market Revenue (Million), by Material 2024 & 2032
- Figure 13: North America Tank Protection Market Revenue Share (%), by Material 2024 & 2032
- Figure 14: North America Tank Protection Market Revenue (Million), by Application 2024 & 2032
- Figure 15: North America Tank Protection Market Revenue Share (%), by Application 2024 & 2032
- Figure 16: North America Tank Protection Market Revenue (Million), by Country 2024 & 2032
- Figure 17: North America Tank Protection Market Revenue Share (%), by Country 2024 & 2032
- Figure 18: South America Tank Protection Market Revenue (Million), by Material 2024 & 2032
- Figure 19: South America Tank Protection Market Revenue Share (%), by Material 2024 & 2032
- Figure 20: South America Tank Protection Market Revenue (Million), by Application 2024 & 2032
- Figure 21: South America Tank Protection Market Revenue Share (%), by Application 2024 & 2032
- Figure 22: South America Tank Protection Market Revenue (Million), by Country 2024 & 2032
- Figure 23: South America Tank Protection Market Revenue Share (%), by Country 2024 & 2032
- Figure 24: Europe Tank Protection Market Revenue (Million), by Material 2024 & 2032
- Figure 25: Europe Tank Protection Market Revenue Share (%), by Material 2024 & 2032
- Figure 26: Europe Tank Protection Market Revenue (Million), by Application 2024 & 2032
- Figure 27: Europe Tank Protection Market Revenue Share (%), by Application 2024 & 2032
- Figure 28: Europe Tank Protection Market Revenue (Million), by Country 2024 & 2032
- Figure 29: Europe Tank Protection Market Revenue Share (%), by Country 2024 & 2032
- Figure 30: Middle East and Africa Tank Protection Market Revenue (Million), by Material 2024 & 2032
- Figure 31: Middle East and Africa Tank Protection Market Revenue Share (%), by Material 2024 & 2032
- Figure 32: Middle East and Africa Tank Protection Market Revenue (Million), by Application 2024 & 2032
- Figure 33: Middle East and Africa Tank Protection Market Revenue Share (%), by Application 2024 & 2032
- Figure 34: Middle East and Africa Tank Protection Market Revenue (Million), by Country 2024 & 2032
- Figure 35: Middle East and Africa Tank Protection Market Revenue Share (%), by Country 2024 & 2032
- Figure 36: Asia Pacific Tank Protection Market Revenue (Million), by Material 2024 & 2032
- Figure 37: Asia Pacific Tank Protection Market Revenue Share (%), by Material 2024 & 2032
- Figure 38: Asia Pacific Tank Protection Market Revenue (Million), by Application 2024 & 2032
- Figure 39: Asia Pacific Tank Protection Market Revenue Share (%), by Application 2024 & 2032
- Figure 40: Asia Pacific Tank Protection Market Revenue (Million), by Country 2024 & 2032
- Figure 41: Asia Pacific Tank Protection Market Revenue Share (%), by Country 2024 & 2032
List of Tables
- Table 1: Global Tank Protection Market Revenue Million Forecast, by Region 2019 & 2032
- Table 2: Global Tank Protection Market Revenue Million Forecast, by Material 2019 & 2032
- Table 3: Global Tank Protection Market Revenue Million Forecast, by Application 2019 & 2032
- Table 4: Global Tank Protection Market Revenue Million Forecast, by Region 2019 & 2032
- Table 5: Global Tank Protection Market Revenue Million Forecast, by Country 2019 & 2032
- Table 6: United States Tank Protection Market Revenue (Million) Forecast, by Application 2019 & 2032
- Table 7: Canada Tank Protection Market Revenue (Million) Forecast, by Application 2019 & 2032
- Table 8: Mexico Tank Protection Market Revenue (Million) Forecast, by Application 2019 & 2032
- Table 9: Global Tank Protection Market Revenue Million Forecast, by Country 2019 & 2032
- Table 10: Germany Tank Protection Market Revenue (Million) Forecast, by Application 2019 & 2032
- Table 11: United Kingdom Tank Protection Market Revenue (Million) Forecast, by Application 2019 & 2032
- Table 12: France Tank Protection Market Revenue (Million) Forecast, by Application 2019 & 2032
- Table 13: Spain Tank Protection Market Revenue (Million) Forecast, by Application 2019 & 2032
- Table 14: Italy Tank Protection Market Revenue (Million) Forecast, by Application 2019 & 2032
- Table 15: Spain Tank Protection Market Revenue (Million) Forecast, by Application 2019 & 2032
- Table 16: Belgium Tank Protection Market Revenue (Million) Forecast, by Application 2019 & 2032
- Table 17: Netherland Tank Protection Market Revenue (Million) Forecast, by Application 2019 & 2032
- Table 18: Nordics Tank Protection Market Revenue (Million) Forecast, by Application 2019 & 2032
- Table 19: Rest of Europe Tank Protection Market Revenue (Million) Forecast, by Application 2019 & 2032
- Table 20: Global Tank Protection Market Revenue Million Forecast, by Country 2019 & 2032
- Table 21: China Tank Protection Market Revenue (Million) Forecast, by Application 2019 & 2032
- Table 22: Japan Tank Protection Market Revenue (Million) Forecast, by Application 2019 & 2032
- Table 23: India Tank Protection Market Revenue (Million) Forecast, by Application 2019 & 2032
- Table 24: South Korea Tank Protection Market Revenue (Million) Forecast, by Application 2019 & 2032
- Table 25: Southeast Asia Tank Protection Market Revenue (Million) Forecast, by Application 2019 & 2032
- Table 26: Australia Tank Protection Market Revenue (Million) Forecast, by Application 2019 & 2032
- Table 27: Indonesia Tank Protection Market Revenue (Million) Forecast, by Application 2019 & 2032
- Table 28: Phillipes Tank Protection Market Revenue (Million) Forecast, by Application 2019 & 2032
- Table 29: Singapore Tank Protection Market Revenue (Million) Forecast, by Application 2019 & 2032
- Table 30: Thailandc Tank Protection Market Revenue (Million) Forecast, by Application 2019 & 2032
- Table 31: Rest of Asia Pacific Tank Protection Market Revenue (Million) Forecast, by Application 2019 & 2032
- Table 32: Global Tank Protection Market Revenue Million Forecast, by Country 2019 & 2032
- Table 33: Brazil Tank Protection Market Revenue (Million) Forecast, by Application 2019 & 2032
- Table 34: Argentina Tank Protection Market Revenue (Million) Forecast, by Application 2019 & 2032
- Table 35: Peru Tank Protection Market Revenue (Million) Forecast, by Application 2019 & 2032
- Table 36: Chile Tank Protection Market Revenue (Million) Forecast, by Application 2019 & 2032
- Table 37: Colombia Tank Protection Market Revenue (Million) Forecast, by Application 2019 & 2032
- Table 38: Ecuador Tank Protection Market Revenue (Million) Forecast, by Application 2019 & 2032
- Table 39: Venezuela Tank Protection Market Revenue (Million) Forecast, by Application 2019 & 2032
- Table 40: Rest of South America Tank Protection Market Revenue (Million) Forecast, by Application 2019 & 2032
- Table 41: Global Tank Protection Market Revenue Million Forecast, by Country 2019 & 2032
- Table 42: United Arab Emirates Tank Protection Market Revenue (Million) Forecast, by Application 2019 & 2032
- Table 43: Saudi Arabia Tank Protection Market Revenue (Million) Forecast, by Application 2019 & 2032
- Table 44: South Africa Tank Protection Market Revenue (Million) Forecast, by Application 2019 & 2032
- Table 45: Rest of Middle East and Africa Tank Protection Market Revenue (Million) Forecast, by Application 2019 & 2032
- Table 46: Global Tank Protection Market Revenue Million Forecast, by Material 2019 & 2032
- Table 47: Global Tank Protection Market Revenue Million Forecast, by Application 2019 & 2032
- Table 48: Global Tank Protection Market Revenue Million Forecast, by Country 2019 & 2032
- Table 49: United States Tank Protection Market Revenue (Million) Forecast, by Application 2019 & 2032
- Table 50: Canada Tank Protection Market Revenue (Million) Forecast, by Application 2019 & 2032
- Table 51: Mexico Tank Protection Market Revenue (Million) Forecast, by Application 2019 & 2032
- Table 52: Rest of North America Tank Protection Market Revenue (Million) Forecast, by Application 2019 & 2032
- Table 53: Global Tank Protection Market Revenue Million Forecast, by Material 2019 & 2032
- Table 54: Global Tank Protection Market Revenue Million Forecast, by Application 2019 & 2032
- Table 55: Global Tank Protection Market Revenue Million Forecast, by Country 2019 & 2032
- Table 56: Brazil Tank Protection Market Revenue (Million) Forecast, by Application 2019 & 2032
- Table 57: Venezuela Tank Protection Market Revenue (Million) Forecast, by Application 2019 & 2032
- Table 58: Rest of South America Tank Protection Market Revenue (Million) Forecast, by Application 2019 & 2032
- Table 59: Global Tank Protection Market Revenue Million Forecast, by Material 2019 & 2032
- Table 60: Global Tank Protection Market Revenue Million Forecast, by Application 2019 & 2032
- Table 61: Global Tank Protection Market Revenue Million Forecast, by Country 2019 & 2032
- Table 62: Norway Tank Protection Market Revenue (Million) Forecast, by Application 2019 & 2032
- Table 63: United Kingdom Tank Protection Market Revenue (Million) Forecast, by Application 2019 & 2032
- Table 64: Russian Federation Tank Protection Market Revenue (Million) Forecast, by Application 2019 & 2032
- Table 65: Rest of Europe Tank Protection Market Revenue (Million) Forecast, by Application 2019 & 2032
- Table 66: Global Tank Protection Market Revenue Million Forecast, by Material 2019 & 2032
- Table 67: Global Tank Protection Market Revenue Million Forecast, by Application 2019 & 2032
- Table 68: Global Tank Protection Market Revenue Million Forecast, by Country 2019 & 2032
- Table 69: Saudi Arabia Tank Protection Market Revenue (Million) Forecast, by Application 2019 & 2032
- Table 70: United Arab Emirates Tank Protection Market Revenue (Million) Forecast, by Application 2019 & 2032
- Table 71: Qatar Tank Protection Market Revenue (Million) Forecast, by Application 2019 & 2032
- Table 72: Iran Tank Protection Market Revenue (Million) Forecast, by Application 2019 & 2032
- Table 73: Nigeria Tank Protection Market Revenue (Million) Forecast, by Application 2019 & 2032
- Table 74: Algeria Tank Protection Market Revenue (Million) Forecast, by Application 2019 & 2032
- Table 75: Rest of Middle East and Africa Tank Protection Market Revenue (Million) Forecast, by Application 2019 & 2032
- Table 76: Global Tank Protection Market Revenue Million Forecast, by Material 2019 & 2032
- Table 77: Global Tank Protection Market Revenue Million Forecast, by Application 2019 & 2032
- Table 78: Global Tank Protection Market Revenue Million Forecast, by Country 2019 & 2032
- Table 79: China Tank Protection Market Revenue (Million) Forecast, by Application 2019 & 2032
- Table 80: India Tank Protection Market Revenue (Million) Forecast, by Application 2019 & 2032
- Table 81: Japan Tank Protection Market Revenue (Million) Forecast, by Application 2019 & 2032
- Table 82: Australia Tank Protection Market Revenue (Million) Forecast, by Application 2019 & 2032
- Table 83: Rest of Asia Pacific Tank Protection Market Revenue (Million) Forecast, by Application 2019 & 2032
Frequently Asked Questions
1. What is the projected Compound Annual Growth Rate (CAGR) of the Tank Protection Market?
The projected CAGR is approximately > 3.00%.
2. Which companies are prominent players in the Tank Protection Market?
Key companies in the market include Kumtek Thermotech, Rockwool International A/S, Yutaka Corporatio, Rochling Group, Kingspan Group, Owens Corning, Archtech Building Systems (Nova Guard), Saint Gobain, Armacell International SA.
3. What are the main segments of the Tank Protection Market?
The market segments include Material, Application.
4. Can you provide details about the market size?
The market size is estimated to be USD XX Million as of 2022.
5. What are some drivers contributing to market growth?
4.; Increasing Demand for Backup Applications in Data Centers4.; Rising Power Outages to Increase the Demand for UPS.
6. What are the notable trends driving market growth?
Polyurethane Expected to Witness Significant Growth.
7. Are there any restraints impacting market growth?
4.; High Capital Cost and Operation Expenditure of UPS Systems.
8. Can you provide examples of recent developments in the market?
September 2022: Northern Technologies International Corporation signed an initial contract with BP Exploration Limited p.l.c. to supply chemical corrosion protection services for 12 storage tanks till the end of 2025.
9. What pricing options are available for accessing the report?
Pricing options include single-user, multi-user, and enterprise licenses priced at USD 4750, USD 5250, and USD 8750 respectively.
10. Is the market size provided in terms of value or volume?
The market size is provided in terms of value, measured in Million.
11. Are there any specific market keywords associated with the report?
Yes, the market keyword associated with the report is "Tank Protection Market," which aids in identifying and referencing the specific market segment covered.
12. How do I determine which pricing option suits my needs best?
The pricing options vary based on user requirements and access needs. Individual users may opt for single-user licenses, while businesses requiring broader access may choose multi-user or enterprise licenses for cost-effective access to the report.
13. Are there any additional resources or data provided in the Tank Protection Market report?
While the report offers comprehensive insights, it's advisable to review the specific contents or supplementary materials provided to ascertain if additional resources or data are available.
14. How can I stay updated on further developments or reports in the Tank Protection Market?
To stay informed about further developments, trends, and reports in the Tank Protection Market, consider subscribing to industry newsletters, following relevant companies and organizations, or regularly checking reputable industry news sources and publications.
Methodology
Step 1 - Identification of Relevant Samples Size from Population Database


Step 2 - Approaches for Defining Global Market Size (Value, Volume* & Price*)

Note*: In applicable scenarios
Step 3 - Data Sources
Primary Research
- Web Analytics
- Survey Reports
- Research Institute
- Latest Research Reports
- Opinion Leaders
Secondary Research
- Annual Reports
- White Paper
- Latest Press Release
- Industry Association
- Paid Database
- Investor Presentations

Step 4 - Data Triangulation
Involves using different sources of information in order to increase the validity of a study
These sources are likely to be stakeholders in a program - participants, other researchers, program staff, other community members, and so on.
Then we put all data in single framework & apply various statistical tools to find out the dynamic on the market.
During the analysis stage, feedback from the stakeholder groups would be compared to determine areas of agreement as well as areas of divergence


