
Key Insights
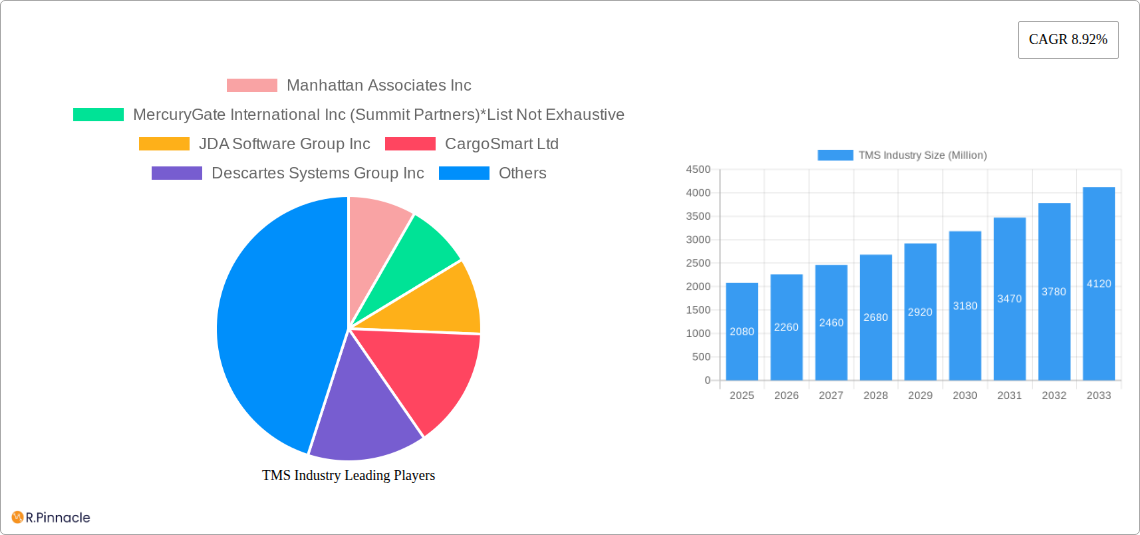
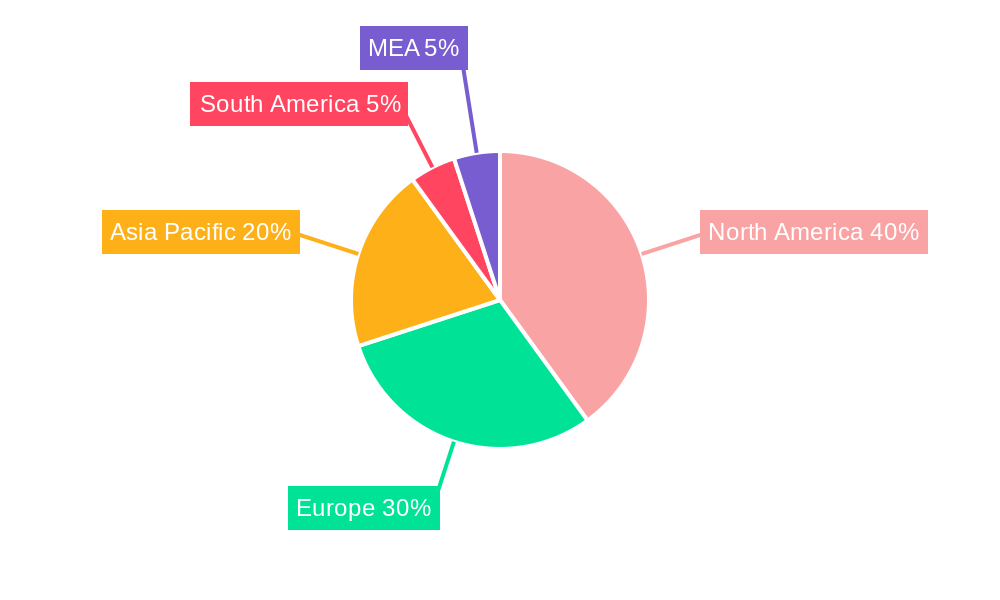
The Transportation Management System (TMS) market is experiencing robust growth, projected to reach $2.08 billion in 2025 and maintain a Compound Annual Growth Rate (CAGR) of 8.92% from 2025 to 2033. This expansion is fueled by several key factors. The increasing complexity of global supply chains, coupled with the need for enhanced visibility and efficiency in logistics operations, is driving widespread TMS adoption across various industries. E-commerce growth, demanding faster and more reliable deliveries, further intensifies this demand. Moreover, the shift towards cloud-based TMS solutions offers scalability, cost-effectiveness, and improved accessibility, accelerating market penetration among Small and Medium-sized Enterprises (SMEs). Technological advancements, including artificial intelligence (AI) and machine learning (ML) integration within TMS platforms, are optimizing route planning, predictive analytics, and overall supply chain management, enhancing ROI for businesses. The integration of these technologies facilitates better inventory management, reduced transportation costs, and improved customer satisfaction. North America currently holds a significant market share, driven by early adoption of advanced technologies and a well-established logistics infrastructure. However, the Asia-Pacific region is poised for significant growth, fueled by rapid industrialization and e-commerce expansion in countries like China and India.
Competition within the TMS market is intense, with established players like Manhattan Associates, Oracle, and SAP competing alongside specialized providers such as MercuryGate and Descartes Systems Group. The market is characterized by continuous innovation, with vendors focusing on developing integrated solutions that cater to diverse industry needs. The ongoing integration of TMS with other enterprise resource planning (ERP) systems and warehouse management systems (WMS) is expected to streamline operations further, resulting in significant cost savings and efficiency gains. While regulatory compliance and data security remain key challenges, the inherent benefits of improved visibility, cost optimization, and enhanced supply chain resilience outweigh these concerns, driving sustained market expansion in the coming years. The continued development of sophisticated features, such as real-time tracking and predictive analytics, will propel further market growth and solidify the TMS industry's role in modern supply chain management.
This in-depth report provides a comprehensive analysis of the Transportation Management System (TMS) industry, offering invaluable insights for industry professionals, investors, and strategists. With a detailed examination spanning the period 2019-2033, including a forecast period from 2025-2033 and a base year of 2025, this report unveils crucial market dynamics, growth drivers, and emerging opportunities within this rapidly evolving sector. The market size is projected to reach xx Million by 2033, showcasing substantial growth potential.
TMS Industry Market Structure & Innovation Trends
This section analyzes the competitive landscape, innovation drivers, and regulatory influences shaping the TMS market. The industry exhibits moderate concentration, with key players like Manhattan Associates Inc, MercuryGate International Inc, JDA Software Group Inc, CargoSmart Ltd, Descartes Systems Group Inc, Oracle Corporation, Precision Software Inc (QAD Inc), 3Gtms Inc, SAP SE holding significant market share. However, the market also accommodates numerous smaller, specialized providers.
- Market Concentration: The top 5 players account for approximately xx% of the market share in 2025, indicating a moderately concentrated market.
- Innovation Drivers: The primary drivers of innovation include advancements in cloud computing, AI, and IoT, leading to the development of more efficient and integrated TMS solutions.
- Regulatory Frameworks: Compliance with evolving transportation regulations (e.g., emissions standards, data privacy) significantly influences TMS adoption and feature development.
- Product Substitutes: While dedicated TMS solutions are preferred, businesses may leverage ERP systems with integrated logistics modules as an alternative, though with reduced functionality.
- End-User Demographics: The primary end-users include large enterprises in logistics, manufacturing, retail, and e-commerce, with growing adoption among SMEs.
- M&A Activities: The TMS industry has witnessed significant M&A activity in recent years, with deals totaling over xx Million in the period 2019-2024. Key acquisitions reflect strategic efforts to expand functionalities, geographical reach, and enhance technological capabilities. For instance, Summit Partners' acquisition of MercuryGate bolstered their position in the market.
TMS Industry Market Dynamics & Trends
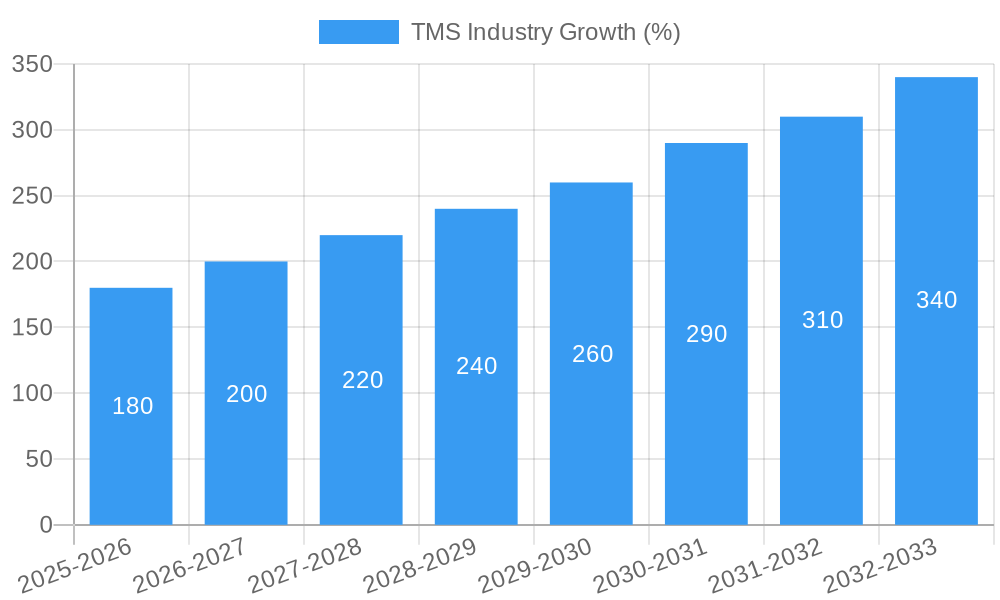
The TMS market is characterized by robust growth, driven by the increasing complexity of global supply chains, the need for enhanced visibility and efficiency, and the rising adoption of digital technologies. The Compound Annual Growth Rate (CAGR) is estimated at xx% during the forecast period (2025-2033).
- Market Growth Drivers: E-commerce expansion, globalization, and the demand for real-time supply chain visibility are major growth catalysts.
- Technological Disruptions: The integration of AI, machine learning, and blockchain technologies is transforming TMS functionalities, enabling predictive analytics, optimized routing, and enhanced security.
- Consumer Preferences: Consumers demand faster delivery and increased transparency, forcing businesses to optimize their logistics operations, driving TMS adoption.
- Competitive Dynamics: The market is witnessing intense competition among established players and emerging technology providers, resulting in continuous innovation and price pressure. Market penetration of cloud-based TMS solutions is experiencing rapid growth, anticipated to exceed xx% by 2033.
Dominant Regions & Segments in TMS Industry
The North American region currently holds the largest market share in the TMS industry, driven by robust e-commerce growth and advanced technological infrastructure. However, the Asia-Pacific region is expected to exhibit the highest growth rate during the forecast period due to rapid industrialization and expanding e-commerce markets.
By Mode of Transportation: Roadways segment dominates due to its extensive reach and cost-effectiveness. However, the Airways segment is experiencing significant growth fueled by the increasing demand for faster delivery of time-sensitive goods.
By Deployment: Cloud-based deployments are gaining significant traction over on-premise solutions due to their scalability, cost-effectiveness, and ease of access. The shift towards cloud deployment is expected to accelerate in the forecast period.
By Size of Enterprise: Large enterprises currently account for the majority of TMS adoption, although the SME segment is witnessing significant growth, driven by the availability of cost-effective cloud-based solutions.
Key Drivers:
- North America: Strong e-commerce presence, advanced technological infrastructure, and well-established logistics networks.
- Asia-Pacific: Rapid industrialization, rising e-commerce penetration, and supportive government policies.
- Europe: Focus on sustainable logistics, stringent regulations, and a mature logistics sector.
TMS Industry Product Innovations
Recent product innovations in the TMS space focus on integrating advanced analytics, AI-powered optimization tools, and improved real-time visibility. This allows businesses to enhance route planning, optimize resource allocation, predict potential disruptions, and ultimately improve operational efficiency and customer satisfaction. The market is also witnessing a surge in the development of cloud-based and mobile-accessible TMS solutions, promoting greater flexibility and accessibility.
Report Scope & Segmentation Analysis
This report covers the TMS market across various segments, including by mode of transportation (roadways, railways, airways), deployment (on-premise, cloud), and enterprise size (SMEs, large enterprises). Each segment's growth projections, market size, and competitive dynamics are analyzed individually. For example, the cloud-based TMS segment is projected to exhibit the highest CAGR, while the roadways segment maintains the largest market share in terms of revenue. Similarly, Large Enterprises are expected to drive growth in the short term, but SMEs demonstrate the highest growth potential for future years.
Key Drivers of TMS Industry Growth
The TMS industry's growth is propelled by several key factors:
- Technological advancements: AI, machine learning, and IoT-enabled solutions are driving efficiency and improving decision-making.
- E-commerce boom: The rapid growth of e-commerce necessitates efficient logistics and supply chain management.
- Globalization: Managing increasingly complex global supply chains demands advanced TMS solutions.
- Regulatory compliance: Stricter regulations necessitate robust TMS solutions to ensure compliance.
Challenges in the TMS Industry Sector
The TMS industry faces several challenges:
- Integration complexities: Integrating TMS with existing ERP and other systems can be complex and costly.
- Data security and privacy: Protecting sensitive data within the TMS is crucial given the vast amount of data handled.
- High implementation costs: The initial investment required for TMS implementation can be substantial, especially for SMEs.
- Lack of skilled workforce: Finding and retaining professionals with expertise in TMS technologies and implementation poses a challenge.
Emerging Opportunities in TMS Industry
The TMS market presents several lucrative opportunities:
- Expansion in emerging markets: Untapped potential exists in developing economies with rapidly expanding logistics sectors.
- Development of specialized TMS solutions: Focusing on niche industries, such as healthcare or perishable goods, presents significant opportunities.
- Integration with emerging technologies: Leveraging blockchain, AI, and IoT for enhanced security, transparency, and optimization is a key growth area.
Leading Players in the TMS Industry Market
- Manhattan Associates Inc
- MercuryGate International Inc
- JDA Software Group Inc
- CargoSmart Ltd
- Descartes Systems Group Inc
- Oracle Corporation
- Precision Software Inc (QAD Inc)
- 3Gtms Inc
- SAP SE
Key Developments in TMS Industry
- February 2022: RHI Magnesita implemented Oracle Fusion Cloud Transportation Management, resulting in cost reductions and improved service standards.
- March 2022: Snowflake and Blue Yonder partnered to enhance supply chain management data access and address disruptions.
Future Outlook for TMS Industry Market
The TMS industry is poised for sustained growth, driven by continued technological innovation, expanding e-commerce, and the increasing complexity of global supply chains. Strategic partnerships, investments in advanced technologies, and expansion into new markets will be key success factors for industry players. The market's focus on improved visibility, predictive analytics, and automation will continue to drive its evolution and expansion.
TMS Industry Segmentation
-
1. Mode of Transportation
- 1.1. Roadways
- 1.2. Railways
- 1.3. Airways
-
2. Deployment
- 2.1. On-premise
- 2.2. Cloud
-
3. Size of Enterprise
- 3.1. SMEs
- 3.2. Large Enterprises
TMS Industry Segmentation By Geography
- 1. North America
- 2. Europe
- 3. Asia Pacific
- 4. Latin America
- 5. Middle East and Africa
TMS Industry REPORT HIGHLIGHTS
| Aspects | Details |
|---|---|
| Study Period | 2019-2033 |
| Base Year | 2024 |
| Estimated Year | 2025 |
| Forecast Period | 2025-2033 |
| Historical Period | 2019-2024 |
| Growth Rate | CAGR of 8.92% from 2019-2033 |
| Segmentation |
|
Table of Contents
- 1. Introduction
- 1.1. Research Scope
- 1.2. Market Segmentation
- 1.3. Research Methodology
- 1.4. Definitions and Assumptions
- 2. Executive Summary
- 2.1. Introduction
- 3. Market Dynamics
- 3.1. Introduction
- 3.2. Market Drivers
- 3.2.1. Integration of RFID Technologies for Managing Supply Chain Activities; Increasing Use of Cloud Computing Technologies in Supply Chain Management
- 3.3. Market Restrains
- 3.3.1. Lack of Awareness Regarding Transport Management System among Consumers
- 3.4. Market Trends
- 3.4.1. Increasing Use of Cloud and Artificial Intelligence in Supply Chain Management
- 4. Market Factor Analysis
- 4.1. Porters Five Forces
- 4.2. Supply/Value Chain
- 4.3. PESTEL analysis
- 4.4. Market Entropy
- 4.5. Patent/Trademark Analysis
- 5. Global TMS Industry Analysis, Insights and Forecast, 2019-2031
- 5.1. Market Analysis, Insights and Forecast - by Mode of Transportation
- 5.1.1. Roadways
- 5.1.2. Railways
- 5.1.3. Airways
- 5.2. Market Analysis, Insights and Forecast - by Deployment
- 5.2.1. On-premise
- 5.2.2. Cloud
- 5.3. Market Analysis, Insights and Forecast - by Size of Enterprise
- 5.3.1. SMEs
- 5.3.2. Large Enterprises
- 5.4. Market Analysis, Insights and Forecast - by Region
- 5.4.1. North America
- 5.4.2. Europe
- 5.4.3. Asia Pacific
- 5.4.4. Latin America
- 5.4.5. Middle East and Africa
- 5.1. Market Analysis, Insights and Forecast - by Mode of Transportation
- 6. North America TMS Industry Analysis, Insights and Forecast, 2019-2031
- 6.1. Market Analysis, Insights and Forecast - by Mode of Transportation
- 6.1.1. Roadways
- 6.1.2. Railways
- 6.1.3. Airways
- 6.2. Market Analysis, Insights and Forecast - by Deployment
- 6.2.1. On-premise
- 6.2.2. Cloud
- 6.3. Market Analysis, Insights and Forecast - by Size of Enterprise
- 6.3.1. SMEs
- 6.3.2. Large Enterprises
- 6.1. Market Analysis, Insights and Forecast - by Mode of Transportation
- 7. Europe TMS Industry Analysis, Insights and Forecast, 2019-2031
- 7.1. Market Analysis, Insights and Forecast - by Mode of Transportation
- 7.1.1. Roadways
- 7.1.2. Railways
- 7.1.3. Airways
- 7.2. Market Analysis, Insights and Forecast - by Deployment
- 7.2.1. On-premise
- 7.2.2. Cloud
- 7.3. Market Analysis, Insights and Forecast - by Size of Enterprise
- 7.3.1. SMEs
- 7.3.2. Large Enterprises
- 7.1. Market Analysis, Insights and Forecast - by Mode of Transportation
- 8. Asia Pacific TMS Industry Analysis, Insights and Forecast, 2019-2031
- 8.1. Market Analysis, Insights and Forecast - by Mode of Transportation
- 8.1.1. Roadways
- 8.1.2. Railways
- 8.1.3. Airways
- 8.2. Market Analysis, Insights and Forecast - by Deployment
- 8.2.1. On-premise
- 8.2.2. Cloud
- 8.3. Market Analysis, Insights and Forecast - by Size of Enterprise
- 8.3.1. SMEs
- 8.3.2. Large Enterprises
- 8.1. Market Analysis, Insights and Forecast - by Mode of Transportation
- 9. Latin America TMS Industry Analysis, Insights and Forecast, 2019-2031
- 9.1. Market Analysis, Insights and Forecast - by Mode of Transportation
- 9.1.1. Roadways
- 9.1.2. Railways
- 9.1.3. Airways
- 9.2. Market Analysis, Insights and Forecast - by Deployment
- 9.2.1. On-premise
- 9.2.2. Cloud
- 9.3. Market Analysis, Insights and Forecast - by Size of Enterprise
- 9.3.1. SMEs
- 9.3.2. Large Enterprises
- 9.1. Market Analysis, Insights and Forecast - by Mode of Transportation
- 10. Middle East and Africa TMS Industry Analysis, Insights and Forecast, 2019-2031
- 10.1. Market Analysis, Insights and Forecast - by Mode of Transportation
- 10.1.1. Roadways
- 10.1.2. Railways
- 10.1.3. Airways
- 10.2. Market Analysis, Insights and Forecast - by Deployment
- 10.2.1. On-premise
- 10.2.2. Cloud
- 10.3. Market Analysis, Insights and Forecast - by Size of Enterprise
- 10.3.1. SMEs
- 10.3.2. Large Enterprises
- 10.1. Market Analysis, Insights and Forecast - by Mode of Transportation
- 11. North America TMS Industry Analysis, Insights and Forecast, 2019-2031
- 11.1. Market Analysis, Insights and Forecast - By Country/Sub-region
- 11.1.1 United States
- 11.1.2 Canada
- 11.1.3 Mexico
- 12. Europe TMS Industry Analysis, Insights and Forecast, 2019-2031
- 12.1. Market Analysis, Insights and Forecast - By Country/Sub-region
- 12.1.1 Germany
- 12.1.2 United Kingdom
- 12.1.3 France
- 12.1.4 Spain
- 12.1.5 Italy
- 12.1.6 Spain
- 12.1.7 Belgium
- 12.1.8 Netherland
- 12.1.9 Nordics
- 12.1.10 Rest of Europe
- 13. Asia Pacific TMS Industry Analysis, Insights and Forecast, 2019-2031
- 13.1. Market Analysis, Insights and Forecast - By Country/Sub-region
- 13.1.1 China
- 13.1.2 Japan
- 13.1.3 India
- 13.1.4 South Korea
- 13.1.5 Southeast Asia
- 13.1.6 Australia
- 13.1.7 Indonesia
- 13.1.8 Phillipes
- 13.1.9 Singapore
- 13.1.10 Thailandc
- 13.1.11 Rest of Asia Pacific
- 14. South America TMS Industry Analysis, Insights and Forecast, 2019-2031
- 14.1. Market Analysis, Insights and Forecast - By Country/Sub-region
- 14.1.1 Brazil
- 14.1.2 Argentina
- 14.1.3 Peru
- 14.1.4 Chile
- 14.1.5 Colombia
- 14.1.6 Ecuador
- 14.1.7 Venezuela
- 14.1.8 Rest of South America
- 15. North America TMS Industry Analysis, Insights and Forecast, 2019-2031
- 15.1. Market Analysis, Insights and Forecast - By Country/Sub-region
- 15.1.1 United States
- 15.1.2 Canada
- 15.1.3 Mexico
- 16. MEA TMS Industry Analysis, Insights and Forecast, 2019-2031
- 16.1. Market Analysis, Insights and Forecast - By Country/Sub-region
- 16.1.1 United Arab Emirates
- 16.1.2 Saudi Arabia
- 16.1.3 South Africa
- 16.1.4 Rest of Middle East and Africa
- 17. Competitive Analysis
- 17.1. Global Market Share Analysis 2024
- 17.2. Company Profiles
- 17.2.1 Manhattan Associates Inc
- 17.2.1.1. Overview
- 17.2.1.2. Products
- 17.2.1.3. SWOT Analysis
- 17.2.1.4. Recent Developments
- 17.2.1.5. Financials (Based on Availability)
- 17.2.2 MercuryGate International Inc (Summit Partners)*List Not Exhaustive
- 17.2.2.1. Overview
- 17.2.2.2. Products
- 17.2.2.3. SWOT Analysis
- 17.2.2.4. Recent Developments
- 17.2.2.5. Financials (Based on Availability)
- 17.2.3 JDA Software Group Inc
- 17.2.3.1. Overview
- 17.2.3.2. Products
- 17.2.3.3. SWOT Analysis
- 17.2.3.4. Recent Developments
- 17.2.3.5. Financials (Based on Availability)
- 17.2.4 CargoSmart Ltd
- 17.2.4.1. Overview
- 17.2.4.2. Products
- 17.2.4.3. SWOT Analysis
- 17.2.4.4. Recent Developments
- 17.2.4.5. Financials (Based on Availability)
- 17.2.5 Descartes Systems Group Inc
- 17.2.5.1. Overview
- 17.2.5.2. Products
- 17.2.5.3. SWOT Analysis
- 17.2.5.4. Recent Developments
- 17.2.5.5. Financials (Based on Availability)
- 17.2.6 Oracle Corporation
- 17.2.6.1. Overview
- 17.2.6.2. Products
- 17.2.6.3. SWOT Analysis
- 17.2.6.4. Recent Developments
- 17.2.6.5. Financials (Based on Availability)
- 17.2.7 Precision Software Inc (QAD Inc)
- 17.2.7.1. Overview
- 17.2.7.2. Products
- 17.2.7.3. SWOT Analysis
- 17.2.7.4. Recent Developments
- 17.2.7.5. Financials (Based on Availability)
- 17.2.8 3Gtms Inc (Sumeru Equity Partners)
- 17.2.8.1. Overview
- 17.2.8.2. Products
- 17.2.8.3. SWOT Analysis
- 17.2.8.4. Recent Developments
- 17.2.8.5. Financials (Based on Availability)
- 17.2.9 SAP SE
- 17.2.9.1. Overview
- 17.2.9.2. Products
- 17.2.9.3. SWOT Analysis
- 17.2.9.4. Recent Developments
- 17.2.9.5. Financials (Based on Availability)
- 17.2.1 Manhattan Associates Inc
List of Figures
- Figure 1: Global TMS Industry Revenue Breakdown (Million, %) by Region 2024 & 2032
- Figure 2: North America TMS Industry Revenue (Million), by Country 2024 & 2032
- Figure 3: North America TMS Industry Revenue Share (%), by Country 2024 & 2032
- Figure 4: Europe TMS Industry Revenue (Million), by Country 2024 & 2032
- Figure 5: Europe TMS Industry Revenue Share (%), by Country 2024 & 2032
- Figure 6: Asia Pacific TMS Industry Revenue (Million), by Country 2024 & 2032
- Figure 7: Asia Pacific TMS Industry Revenue Share (%), by Country 2024 & 2032
- Figure 8: South America TMS Industry Revenue (Million), by Country 2024 & 2032
- Figure 9: South America TMS Industry Revenue Share (%), by Country 2024 & 2032
- Figure 10: North America TMS Industry Revenue (Million), by Country 2024 & 2032
- Figure 11: North America TMS Industry Revenue Share (%), by Country 2024 & 2032
- Figure 12: MEA TMS Industry Revenue (Million), by Country 2024 & 2032
- Figure 13: MEA TMS Industry Revenue Share (%), by Country 2024 & 2032
- Figure 14: North America TMS Industry Revenue (Million), by Mode of Transportation 2024 & 2032
- Figure 15: North America TMS Industry Revenue Share (%), by Mode of Transportation 2024 & 2032
- Figure 16: North America TMS Industry Revenue (Million), by Deployment 2024 & 2032
- Figure 17: North America TMS Industry Revenue Share (%), by Deployment 2024 & 2032
- Figure 18: North America TMS Industry Revenue (Million), by Size of Enterprise 2024 & 2032
- Figure 19: North America TMS Industry Revenue Share (%), by Size of Enterprise 2024 & 2032
- Figure 20: North America TMS Industry Revenue (Million), by Country 2024 & 2032
- Figure 21: North America TMS Industry Revenue Share (%), by Country 2024 & 2032
- Figure 22: Europe TMS Industry Revenue (Million), by Mode of Transportation 2024 & 2032
- Figure 23: Europe TMS Industry Revenue Share (%), by Mode of Transportation 2024 & 2032
- Figure 24: Europe TMS Industry Revenue (Million), by Deployment 2024 & 2032
- Figure 25: Europe TMS Industry Revenue Share (%), by Deployment 2024 & 2032
- Figure 26: Europe TMS Industry Revenue (Million), by Size of Enterprise 2024 & 2032
- Figure 27: Europe TMS Industry Revenue Share (%), by Size of Enterprise 2024 & 2032
- Figure 28: Europe TMS Industry Revenue (Million), by Country 2024 & 2032
- Figure 29: Europe TMS Industry Revenue Share (%), by Country 2024 & 2032
- Figure 30: Asia Pacific TMS Industry Revenue (Million), by Mode of Transportation 2024 & 2032
- Figure 31: Asia Pacific TMS Industry Revenue Share (%), by Mode of Transportation 2024 & 2032
- Figure 32: Asia Pacific TMS Industry Revenue (Million), by Deployment 2024 & 2032
- Figure 33: Asia Pacific TMS Industry Revenue Share (%), by Deployment 2024 & 2032
- Figure 34: Asia Pacific TMS Industry Revenue (Million), by Size of Enterprise 2024 & 2032
- Figure 35: Asia Pacific TMS Industry Revenue Share (%), by Size of Enterprise 2024 & 2032
- Figure 36: Asia Pacific TMS Industry Revenue (Million), by Country 2024 & 2032
- Figure 37: Asia Pacific TMS Industry Revenue Share (%), by Country 2024 & 2032
- Figure 38: Latin America TMS Industry Revenue (Million), by Mode of Transportation 2024 & 2032
- Figure 39: Latin America TMS Industry Revenue Share (%), by Mode of Transportation 2024 & 2032
- Figure 40: Latin America TMS Industry Revenue (Million), by Deployment 2024 & 2032
- Figure 41: Latin America TMS Industry Revenue Share (%), by Deployment 2024 & 2032
- Figure 42: Latin America TMS Industry Revenue (Million), by Size of Enterprise 2024 & 2032
- Figure 43: Latin America TMS Industry Revenue Share (%), by Size of Enterprise 2024 & 2032
- Figure 44: Latin America TMS Industry Revenue (Million), by Country 2024 & 2032
- Figure 45: Latin America TMS Industry Revenue Share (%), by Country 2024 & 2032
- Figure 46: Middle East and Africa TMS Industry Revenue (Million), by Mode of Transportation 2024 & 2032
- Figure 47: Middle East and Africa TMS Industry Revenue Share (%), by Mode of Transportation 2024 & 2032
- Figure 48: Middle East and Africa TMS Industry Revenue (Million), by Deployment 2024 & 2032
- Figure 49: Middle East and Africa TMS Industry Revenue Share (%), by Deployment 2024 & 2032
- Figure 50: Middle East and Africa TMS Industry Revenue (Million), by Size of Enterprise 2024 & 2032
- Figure 51: Middle East and Africa TMS Industry Revenue Share (%), by Size of Enterprise 2024 & 2032
- Figure 52: Middle East and Africa TMS Industry Revenue (Million), by Country 2024 & 2032
- Figure 53: Middle East and Africa TMS Industry Revenue Share (%), by Country 2024 & 2032
List of Tables
- Table 1: Global TMS Industry Revenue Million Forecast, by Region 2019 & 2032
- Table 2: Global TMS Industry Revenue Million Forecast, by Mode of Transportation 2019 & 2032
- Table 3: Global TMS Industry Revenue Million Forecast, by Deployment 2019 & 2032
- Table 4: Global TMS Industry Revenue Million Forecast, by Size of Enterprise 2019 & 2032
- Table 5: Global TMS Industry Revenue Million Forecast, by Region 2019 & 2032
- Table 6: Global TMS Industry Revenue Million Forecast, by Country 2019 & 2032
- Table 7: United States TMS Industry Revenue (Million) Forecast, by Application 2019 & 2032
- Table 8: Canada TMS Industry Revenue (Million) Forecast, by Application 2019 & 2032
- Table 9: Mexico TMS Industry Revenue (Million) Forecast, by Application 2019 & 2032
- Table 10: Global TMS Industry Revenue Million Forecast, by Country 2019 & 2032
- Table 11: Germany TMS Industry Revenue (Million) Forecast, by Application 2019 & 2032
- Table 12: United Kingdom TMS Industry Revenue (Million) Forecast, by Application 2019 & 2032
- Table 13: France TMS Industry Revenue (Million) Forecast, by Application 2019 & 2032
- Table 14: Spain TMS Industry Revenue (Million) Forecast, by Application 2019 & 2032
- Table 15: Italy TMS Industry Revenue (Million) Forecast, by Application 2019 & 2032
- Table 16: Spain TMS Industry Revenue (Million) Forecast, by Application 2019 & 2032
- Table 17: Belgium TMS Industry Revenue (Million) Forecast, by Application 2019 & 2032
- Table 18: Netherland TMS Industry Revenue (Million) Forecast, by Application 2019 & 2032
- Table 19: Nordics TMS Industry Revenue (Million) Forecast, by Application 2019 & 2032
- Table 20: Rest of Europe TMS Industry Revenue (Million) Forecast, by Application 2019 & 2032
- Table 21: Global TMS Industry Revenue Million Forecast, by Country 2019 & 2032
- Table 22: China TMS Industry Revenue (Million) Forecast, by Application 2019 & 2032
- Table 23: Japan TMS Industry Revenue (Million) Forecast, by Application 2019 & 2032
- Table 24: India TMS Industry Revenue (Million) Forecast, by Application 2019 & 2032
- Table 25: South Korea TMS Industry Revenue (Million) Forecast, by Application 2019 & 2032
- Table 26: Southeast Asia TMS Industry Revenue (Million) Forecast, by Application 2019 & 2032
- Table 27: Australia TMS Industry Revenue (Million) Forecast, by Application 2019 & 2032
- Table 28: Indonesia TMS Industry Revenue (Million) Forecast, by Application 2019 & 2032
- Table 29: Phillipes TMS Industry Revenue (Million) Forecast, by Application 2019 & 2032
- Table 30: Singapore TMS Industry Revenue (Million) Forecast, by Application 2019 & 2032
- Table 31: Thailandc TMS Industry Revenue (Million) Forecast, by Application 2019 & 2032
- Table 32: Rest of Asia Pacific TMS Industry Revenue (Million) Forecast, by Application 2019 & 2032
- Table 33: Global TMS Industry Revenue Million Forecast, by Country 2019 & 2032
- Table 34: Brazil TMS Industry Revenue (Million) Forecast, by Application 2019 & 2032
- Table 35: Argentina TMS Industry Revenue (Million) Forecast, by Application 2019 & 2032
- Table 36: Peru TMS Industry Revenue (Million) Forecast, by Application 2019 & 2032
- Table 37: Chile TMS Industry Revenue (Million) Forecast, by Application 2019 & 2032
- Table 38: Colombia TMS Industry Revenue (Million) Forecast, by Application 2019 & 2032
- Table 39: Ecuador TMS Industry Revenue (Million) Forecast, by Application 2019 & 2032
- Table 40: Venezuela TMS Industry Revenue (Million) Forecast, by Application 2019 & 2032
- Table 41: Rest of South America TMS Industry Revenue (Million) Forecast, by Application 2019 & 2032
- Table 42: Global TMS Industry Revenue Million Forecast, by Country 2019 & 2032
- Table 43: United States TMS Industry Revenue (Million) Forecast, by Application 2019 & 2032
- Table 44: Canada TMS Industry Revenue (Million) Forecast, by Application 2019 & 2032
- Table 45: Mexico TMS Industry Revenue (Million) Forecast, by Application 2019 & 2032
- Table 46: Global TMS Industry Revenue Million Forecast, by Country 2019 & 2032
- Table 47: United Arab Emirates TMS Industry Revenue (Million) Forecast, by Application 2019 & 2032
- Table 48: Saudi Arabia TMS Industry Revenue (Million) Forecast, by Application 2019 & 2032
- Table 49: South Africa TMS Industry Revenue (Million) Forecast, by Application 2019 & 2032
- Table 50: Rest of Middle East and Africa TMS Industry Revenue (Million) Forecast, by Application 2019 & 2032
- Table 51: Global TMS Industry Revenue Million Forecast, by Mode of Transportation 2019 & 2032
- Table 52: Global TMS Industry Revenue Million Forecast, by Deployment 2019 & 2032
- Table 53: Global TMS Industry Revenue Million Forecast, by Size of Enterprise 2019 & 2032
- Table 54: Global TMS Industry Revenue Million Forecast, by Country 2019 & 2032
- Table 55: Global TMS Industry Revenue Million Forecast, by Mode of Transportation 2019 & 2032
- Table 56: Global TMS Industry Revenue Million Forecast, by Deployment 2019 & 2032
- Table 57: Global TMS Industry Revenue Million Forecast, by Size of Enterprise 2019 & 2032
- Table 58: Global TMS Industry Revenue Million Forecast, by Country 2019 & 2032
- Table 59: Global TMS Industry Revenue Million Forecast, by Mode of Transportation 2019 & 2032
- Table 60: Global TMS Industry Revenue Million Forecast, by Deployment 2019 & 2032
- Table 61: Global TMS Industry Revenue Million Forecast, by Size of Enterprise 2019 & 2032
- Table 62: Global TMS Industry Revenue Million Forecast, by Country 2019 & 2032
- Table 63: Global TMS Industry Revenue Million Forecast, by Mode of Transportation 2019 & 2032
- Table 64: Global TMS Industry Revenue Million Forecast, by Deployment 2019 & 2032
- Table 65: Global TMS Industry Revenue Million Forecast, by Size of Enterprise 2019 & 2032
- Table 66: Global TMS Industry Revenue Million Forecast, by Country 2019 & 2032
- Table 67: Global TMS Industry Revenue Million Forecast, by Mode of Transportation 2019 & 2032
- Table 68: Global TMS Industry Revenue Million Forecast, by Deployment 2019 & 2032
- Table 69: Global TMS Industry Revenue Million Forecast, by Size of Enterprise 2019 & 2032
- Table 70: Global TMS Industry Revenue Million Forecast, by Country 2019 & 2032
Frequently Asked Questions
1. What is the projected Compound Annual Growth Rate (CAGR) of the TMS Industry?
The projected CAGR is approximately 8.92%.
2. Which companies are prominent players in the TMS Industry?
Key companies in the market include Manhattan Associates Inc, MercuryGate International Inc (Summit Partners)*List Not Exhaustive, JDA Software Group Inc, CargoSmart Ltd, Descartes Systems Group Inc, Oracle Corporation, Precision Software Inc (QAD Inc), 3Gtms Inc (Sumeru Equity Partners), SAP SE.
3. What are the main segments of the TMS Industry?
The market segments include Mode of Transportation, Deployment, Size of Enterprise.
4. Can you provide details about the market size?
The market size is estimated to be USD 2.08 Million as of 2022.
5. What are some drivers contributing to market growth?
Integration of RFID Technologies for Managing Supply Chain Activities; Increasing Use of Cloud Computing Technologies in Supply Chain Management.
6. What are the notable trends driving market growth?
Increasing Use of Cloud and Artificial Intelligence in Supply Chain Management.
7. Are there any restraints impacting market growth?
Lack of Awareness Regarding Transport Management System among Consumers.
8. Can you provide examples of recent developments in the market?
March 2022: The data cloud firm Snowflake and the provider of digital supply chain and omnichannel commerce fulfillment Blue Yonder announced a partnership to transform supply chain management's access to heterogeneous data sources. Retailers, manufacturers, and third-party logistics providers (3PLs) can all benefit from Blue Yonder's Luminate Platform, powered by Snowflake, an end-to-end supply chain solution that helps them better predict, prevent, and address disruptions across their entire business to reduce risks and address the expanding supply chain challenges.
9. What pricing options are available for accessing the report?
Pricing options include single-user, multi-user, and enterprise licenses priced at USD 4750, USD 5250, and USD 8750 respectively.
10. Is the market size provided in terms of value or volume?
The market size is provided in terms of value, measured in Million.
11. Are there any specific market keywords associated with the report?
Yes, the market keyword associated with the report is "TMS Industry," which aids in identifying and referencing the specific market segment covered.
12. How do I determine which pricing option suits my needs best?
The pricing options vary based on user requirements and access needs. Individual users may opt for single-user licenses, while businesses requiring broader access may choose multi-user or enterprise licenses for cost-effective access to the report.
13. Are there any additional resources or data provided in the TMS Industry report?
While the report offers comprehensive insights, it's advisable to review the specific contents or supplementary materials provided to ascertain if additional resources or data are available.
14. How can I stay updated on further developments or reports in the TMS Industry?
To stay informed about further developments, trends, and reports in the TMS Industry, consider subscribing to industry newsletters, following relevant companies and organizations, or regularly checking reputable industry news sources and publications.
Methodology
Step 1 - Identification of Relevant Samples Size from Population Database


Step 2 - Approaches for Defining Global Market Size (Value, Volume* & Price*)

Note*: In applicable scenarios
Step 3 - Data Sources
Primary Research
- Web Analytics
- Survey Reports
- Research Institute
- Latest Research Reports
- Opinion Leaders
Secondary Research
- Annual Reports
- White Paper
- Latest Press Release
- Industry Association
- Paid Database
- Investor Presentations

Step 4 - Data Triangulation
Involves using different sources of information in order to increase the validity of a study
These sources are likely to be stakeholders in a program - participants, other researchers, program staff, other community members, and so on.
Then we put all data in single framework & apply various statistical tools to find out the dynamic on the market.
During the analysis stage, feedback from the stakeholder groups would be compared to determine areas of agreement as well as areas of divergence


