
Key Insights
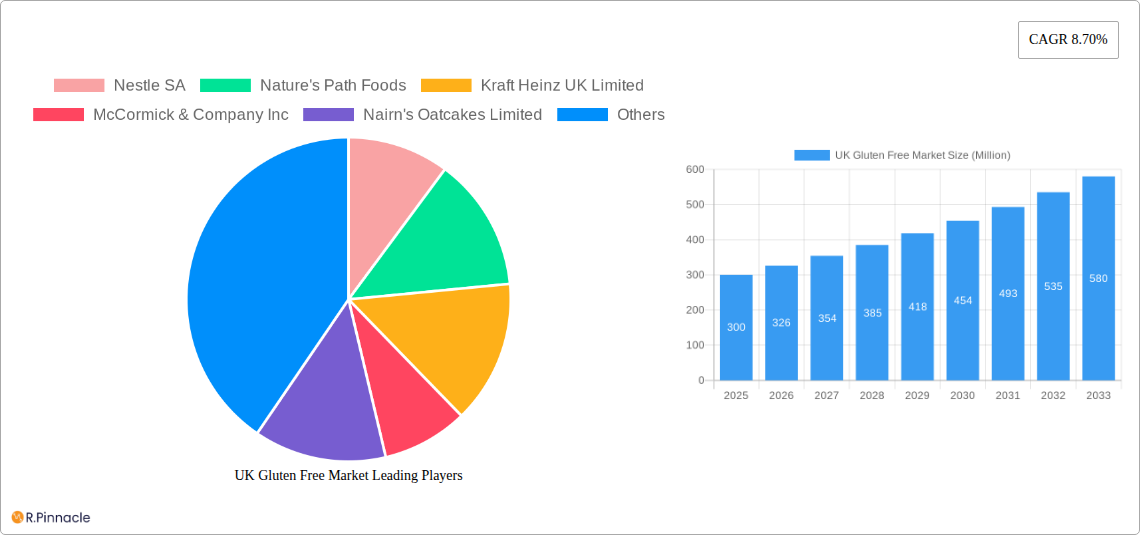
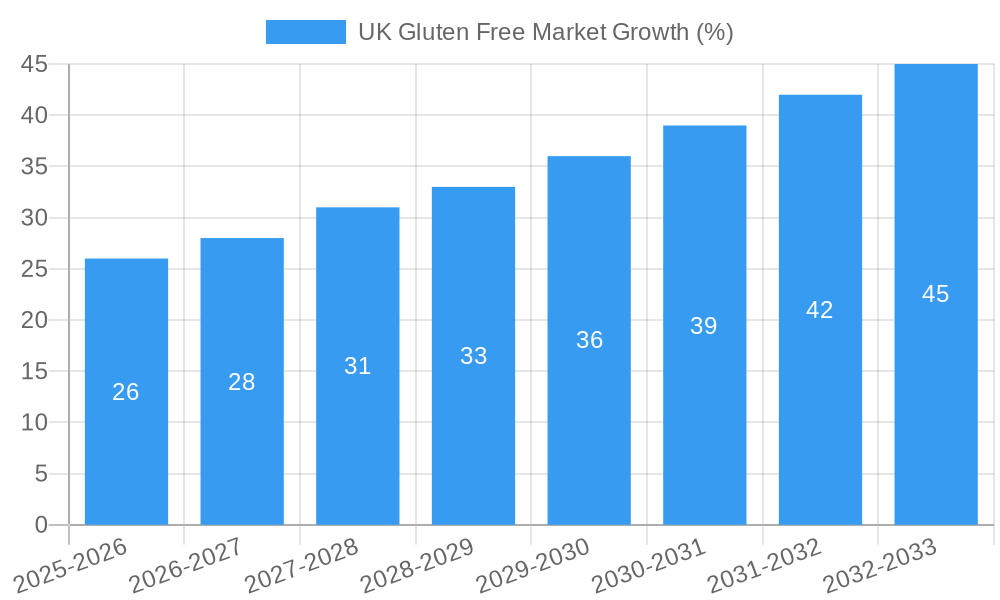
The UK gluten-free market, valued at approximately £300 million in 2025, is experiencing robust growth, projected to maintain a compound annual growth rate (CAGR) of 8.70% from 2025 to 2033. This expansion is driven by several key factors. The rising prevalence of coeliac disease and non-celiac gluten sensitivity is a primary driver, leading to increased demand for gluten-free alternatives across various food categories. Changing consumer preferences towards healthier and more specialized diets, coupled with increased awareness of the benefits of gluten-free products, further fuels market growth. The growing availability of convenient and palatable gluten-free options in supermarkets, online retailers, and specialty stores also contributes significantly. While challenges exist, such as potential price premiums associated with gluten-free products and the need for continuous innovation to improve taste and texture, the market's overall trajectory remains positive. Major players like Nestle SA, Kraft Heinz, and McCormick & Company are actively investing in research and development to broaden their gluten-free product portfolios, reflecting the market’s significant potential.
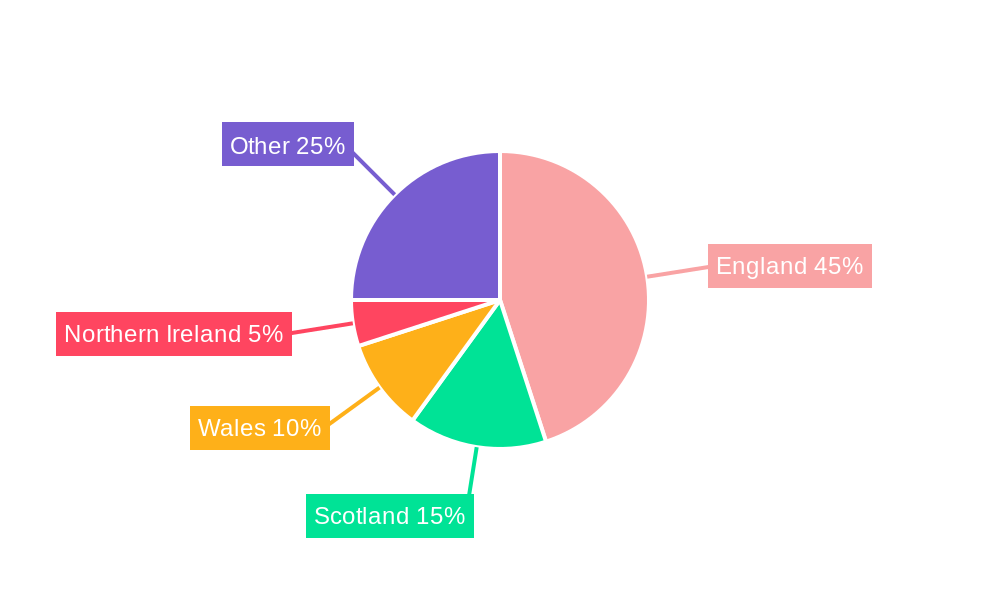
The market segmentation reveals strong performance across various food categories. Beverages, bakery and confectionery, and dairy/dairy substitutes represent significant segments. The distribution channel analysis highlights the importance of supermarkets/hypermarkets and online retail, indicating a shift towards convenient purchasing options. Geographical analysis within the UK shows consistent demand across England, Wales, Scotland, and Northern Ireland, suggesting a nationwide acceptance and demand for gluten-free products. Looking ahead, the UK gluten-free market is poised for continued expansion, driven by ongoing consumer demand, product innovation, and increased distribution accessibility. The focus will likely be on developing products that meet evolving consumer preferences for both taste and health benefits, further driving growth within the forecast period.
This comprehensive report provides a detailed analysis of the UK gluten-free market, offering invaluable insights for industry professionals, investors, and stakeholders. The report covers the period 2019-2033, with a focus on the estimated year 2025 and a forecast period of 2025-2033. Expect in-depth analysis of market size (reaching xx Million by 2033), growth drivers, competitive landscape, and emerging trends, empowering you to make informed strategic decisions.
UK Gluten Free Market Market Structure & Innovation Trends
The UK gluten-free market exhibits a moderately concentrated structure, with key players like Nestle SA, Kraft Heinz UK Limited, and McCormick & Company Inc. holding significant market share. However, smaller, specialized brands are also making inroads, particularly in niche segments. Innovation is driven by increasing consumer demand for healthier, more convenient, and diverse gluten-free options. Regulatory frameworks, such as labeling requirements, play a crucial role in shaping the market. Product substitutes, including naturally gluten-free products, are influencing market dynamics. End-user demographics show a rising prevalence of gluten intolerance and celiac disease, fueling market growth. M&A activity in the sector has been moderate, with deal values averaging approximately xx Million in recent years. Some key observations include:
- Market Concentration: The top 5 players account for approximately xx% of the market.
- Innovation Drivers: Growing awareness of gluten-related health issues, increased demand for convenience foods, and rising consumer interest in ethical and sustainable products.
- Regulatory Landscape: Stringent labeling regulations and food safety standards influence product development and marketing strategies.
- M&A Activity: Consolidation is anticipated in the coming years, with larger players potentially acquiring smaller, specialized companies to expand their product portfolios and market reach. Recent deals have focused on expanding product lines and geographic reach.
UK Gluten Free Market Market Dynamics & Trends
The UK gluten-free market is experiencing robust growth, driven by several key factors. The increasing prevalence of celiac disease and gluten intolerance is a primary driver, along with the rising awareness of the health benefits of a gluten-free diet amongst the wider population. Technological advancements in gluten-free food processing and ingredient development are further propelling market expansion. Consumer preferences are shifting towards healthier, more natural, and ethically sourced gluten-free products. Competitive dynamics are intense, with both established food companies and smaller, specialized brands vying for market share. The market is projected to achieve a CAGR of xx% during the forecast period (2025-2033), with market penetration expected to reach xx% by 2033.
Dominant Regions & Segments in UK Gluten Free Market
The UK gluten-free market exhibits strong regional variations. London and the South East are currently the dominant regions, driven by higher disposable incomes and greater awareness of gluten-free diets. However, growth is expected across all regions as awareness increases. Within product segments, Bakery and Confectionery holds the largest market share, followed by Dairy/Dairy Substitutes. Supermarkets/Hypermarkets dominate the distribution channel, while online retail stores are experiencing rapid growth.
Key Drivers:
- Economic Factors: Rising disposable incomes and increased spending on premium and organic food products are driving market expansion.
- Infrastructure: Well-established retail infrastructure facilitates efficient distribution of gluten-free products.
Dominance Analysis:
The substantial market share of Bakery and Confectionery is attributed to the widespread availability of gluten-free bread, cakes, and snacks. The growth of the Dairy/Dairy Substitutes segment reflects the increasing popularity of gluten-free milk alternatives and yogurt. Supermarkets/Hypermarkets dominate due to their extensive reach and established distribution networks, offering a convenient purchasing experience for consumers.
UK Gluten Free Market Product Innovations
Recent product innovations have focused on enhancing taste, texture, and nutritional value of gluten-free products. Technological advancements such as improved gluten-free flours and baking techniques are enabling the production of superior-quality products. Companies are increasingly emphasizing natural and organic ingredients to cater to health-conscious consumers. The market is also witnessing the launch of innovative product formats, such as ready-to-eat meals and convenient snacks. These innovations aim to address consumer demand for better tasting and more convenient gluten-free options, thus boosting market growth.
Report Scope & Segmentation Analysis
This report segments the UK gluten-free market by product type (Beverages, Bakery and Confectionery, Condiments, Seasonings, and Spreads, Dairy/Dairy Substitutes, Meat/Meat Substitutes, Other Types) and distribution channel (Supermarkets/Hypermarkets, Convenience Stores, Specialty Stores, Online Retail Stores, Other Distribution Channels). Each segment’s growth trajectory, market size, and competitive landscape are thoroughly analyzed, providing a comprehensive overview of the market's structure and dynamics. For example, the Bakery and Confectionery segment is projected to experience significant growth, while online retail channels are expected to gain substantial market share.
Key Drivers of UK Gluten Free Market Growth
The UK gluten-free market is propelled by several key factors, including: The rising prevalence of celiac disease and gluten intolerance; increasing consumer awareness of the health benefits of a gluten-free diet; growing demand for convenient and ready-to-eat gluten-free options; and the expansion of retail channels offering gluten-free products. Technological advancements in gluten-free food processing are further accelerating market growth. Government initiatives supporting the development of gluten-free food products contribute to market expansion.
Challenges in the UK Gluten Free Market Sector
Challenges facing the UK gluten-free market include maintaining consistent product quality and taste; managing the higher production costs associated with gluten-free ingredients; ensuring product availability across all retail channels; and navigating the complexities of gluten-free labeling and certification. Supply chain disruptions and increasing competition from both domestic and international players also pose significant challenges. These factors can impact profitability and market penetration.
Emerging Opportunities in UK Gluten Free Market
Emerging opportunities in the UK gluten-free market include expanding into new product categories; developing innovative gluten-free formulations and technologies; and focusing on niche consumer segments with specific dietary needs. Leveraging online retail channels for direct-to-consumer sales and building strong brand loyalty through marketing campaigns focused on health, wellness, and ethical sourcing represent significant growth opportunities.
Leading Players in the UK Gluten Free Market Market
- Nestle SA
- Nature's Path Foods
- Kraft Heinz UK Limited
- McCormick & Company Inc
- Nairn's Oatcakes Limited
- Ulrick and Short Limited
- Amy's Kitchen UK Ltd
- Co-operative Group Limited
- Fria Brod AB
- SA Damm
Key Developments in UK Gluten Free Market Industry
- May 2022: Lindt Lindor launched its gluten-free chocolates in various recipes and flavors. This significantly expanded the premium gluten-free confectionery segment.
- Feb 2022: White Rabbit launched a gluten-free, vegan calzone, marking a significant innovation in the ready-to-eat gluten-free market.
- Apr 2021: Signature Brew added a gluten-free IPA, broadening the gluten-free beverage options available.
Future Outlook for UK Gluten Free Market Market
The UK gluten-free market is poised for continued growth, driven by sustained demand, technological advancements, and expanding distribution channels. Strategic opportunities exist for companies to innovate, expand product portfolios, and target niche consumer segments. The market's future is bright, with considerable potential for both established players and new entrants to capitalize on the growing demand for high-quality, convenient, and diverse gluten-free products.
UK Gluten Free Market Segmentation
-
1. Type
- 1.1. Beverages
- 1.2. Bakery and Confectionery
- 1.3. Condiments, Seasonings, and Spreads
- 1.4. Dairy/Dairy Substitutes
- 1.5. Meat/Meat Substitutes
- 1.6. Other Types
-
2. Distribution Channel
- 2.1. Supermarkets/Hypermarkets
- 2.2. Convenience Stores
- 2.3. Specialty Stores
- 2.4. Online Retail Stores
- 2.5. Other Distribution Channels
UK Gluten Free Market Segmentation By Geography
-
1. North America
- 1.1. United States
- 1.2. Canada
- 1.3. Mexico
-
2. South America
- 2.1. Brazil
- 2.2. Argentina
- 2.3. Rest of South America
-
3. Europe
- 3.1. United Kingdom
- 3.2. Germany
- 3.3. France
- 3.4. Italy
- 3.5. Spain
- 3.6. Russia
- 3.7. Benelux
- 3.8. Nordics
- 3.9. Rest of Europe
-
4. Middle East & Africa
- 4.1. Turkey
- 4.2. Israel
- 4.3. GCC
- 4.4. North Africa
- 4.5. South Africa
- 4.6. Rest of Middle East & Africa
-
5. Asia Pacific
- 5.1. China
- 5.2. India
- 5.3. Japan
- 5.4. South Korea
- 5.5. ASEAN
- 5.6. Oceania
- 5.7. Rest of Asia Pacific
UK Gluten Free Market REPORT HIGHLIGHTS
| Aspects | Details |
|---|---|
| Study Period | 2019-2033 |
| Base Year | 2024 |
| Estimated Year | 2025 |
| Forecast Period | 2025-2033 |
| Historical Period | 2019-2024 |
| Growth Rate | CAGR of 8.70% from 2019-2033 |
| Segmentation |
|
Table of Contents
- 1. Introduction
- 1.1. Research Scope
- 1.2. Market Segmentation
- 1.3. Research Methodology
- 1.4. Definitions and Assumptions
- 2. Executive Summary
- 2.1. Introduction
- 3. Market Dynamics
- 3.1. Introduction
- 3.2. Market Drivers
- 3.2.1. Increasing Sports Participation; Increasing Awareness about Health and Fitness
- 3.3. Market Restrains
- 3.3.1. Adverse Effects of Overconsumption of Products
- 3.4. Market Trends
- 3.4.1. Increasing Demand for Dietary Food
- 4. Market Factor Analysis
- 4.1. Porters Five Forces
- 4.2. Supply/Value Chain
- 4.3. PESTEL analysis
- 4.4. Market Entropy
- 4.5. Patent/Trademark Analysis
- 5. Global UK Gluten Free Market Analysis, Insights and Forecast, 2019-2031
- 5.1. Market Analysis, Insights and Forecast - by Type
- 5.1.1. Beverages
- 5.1.2. Bakery and Confectionery
- 5.1.3. Condiments, Seasonings, and Spreads
- 5.1.4. Dairy/Dairy Substitutes
- 5.1.5. Meat/Meat Substitutes
- 5.1.6. Other Types
- 5.2. Market Analysis, Insights and Forecast - by Distribution Channel
- 5.2.1. Supermarkets/Hypermarkets
- 5.2.2. Convenience Stores
- 5.2.3. Specialty Stores
- 5.2.4. Online Retail Stores
- 5.2.5. Other Distribution Channels
- 5.3. Market Analysis, Insights and Forecast - by Region
- 5.3.1. North America
- 5.3.2. South America
- 5.3.3. Europe
- 5.3.4. Middle East & Africa
- 5.3.5. Asia Pacific
- 5.1. Market Analysis, Insights and Forecast - by Type
- 6. North America UK Gluten Free Market Analysis, Insights and Forecast, 2019-2031
- 6.1. Market Analysis, Insights and Forecast - by Type
- 6.1.1. Beverages
- 6.1.2. Bakery and Confectionery
- 6.1.3. Condiments, Seasonings, and Spreads
- 6.1.4. Dairy/Dairy Substitutes
- 6.1.5. Meat/Meat Substitutes
- 6.1.6. Other Types
- 6.2. Market Analysis, Insights and Forecast - by Distribution Channel
- 6.2.1. Supermarkets/Hypermarkets
- 6.2.2. Convenience Stores
- 6.2.3. Specialty Stores
- 6.2.4. Online Retail Stores
- 6.2.5. Other Distribution Channels
- 6.1. Market Analysis, Insights and Forecast - by Type
- 7. South America UK Gluten Free Market Analysis, Insights and Forecast, 2019-2031
- 7.1. Market Analysis, Insights and Forecast - by Type
- 7.1.1. Beverages
- 7.1.2. Bakery and Confectionery
- 7.1.3. Condiments, Seasonings, and Spreads
- 7.1.4. Dairy/Dairy Substitutes
- 7.1.5. Meat/Meat Substitutes
- 7.1.6. Other Types
- 7.2. Market Analysis, Insights and Forecast - by Distribution Channel
- 7.2.1. Supermarkets/Hypermarkets
- 7.2.2. Convenience Stores
- 7.2.3. Specialty Stores
- 7.2.4. Online Retail Stores
- 7.2.5. Other Distribution Channels
- 7.1. Market Analysis, Insights and Forecast - by Type
- 8. Europe UK Gluten Free Market Analysis, Insights and Forecast, 2019-2031
- 8.1. Market Analysis, Insights and Forecast - by Type
- 8.1.1. Beverages
- 8.1.2. Bakery and Confectionery
- 8.1.3. Condiments, Seasonings, and Spreads
- 8.1.4. Dairy/Dairy Substitutes
- 8.1.5. Meat/Meat Substitutes
- 8.1.6. Other Types
- 8.2. Market Analysis, Insights and Forecast - by Distribution Channel
- 8.2.1. Supermarkets/Hypermarkets
- 8.2.2. Convenience Stores
- 8.2.3. Specialty Stores
- 8.2.4. Online Retail Stores
- 8.2.5. Other Distribution Channels
- 8.1. Market Analysis, Insights and Forecast - by Type
- 9. Middle East & Africa UK Gluten Free Market Analysis, Insights and Forecast, 2019-2031
- 9.1. Market Analysis, Insights and Forecast - by Type
- 9.1.1. Beverages
- 9.1.2. Bakery and Confectionery
- 9.1.3. Condiments, Seasonings, and Spreads
- 9.1.4. Dairy/Dairy Substitutes
- 9.1.5. Meat/Meat Substitutes
- 9.1.6. Other Types
- 9.2. Market Analysis, Insights and Forecast - by Distribution Channel
- 9.2.1. Supermarkets/Hypermarkets
- 9.2.2. Convenience Stores
- 9.2.3. Specialty Stores
- 9.2.4. Online Retail Stores
- 9.2.5. Other Distribution Channels
- 9.1. Market Analysis, Insights and Forecast - by Type
- 10. Asia Pacific UK Gluten Free Market Analysis, Insights and Forecast, 2019-2031
- 10.1. Market Analysis, Insights and Forecast - by Type
- 10.1.1. Beverages
- 10.1.2. Bakery and Confectionery
- 10.1.3. Condiments, Seasonings, and Spreads
- 10.1.4. Dairy/Dairy Substitutes
- 10.1.5. Meat/Meat Substitutes
- 10.1.6. Other Types
- 10.2. Market Analysis, Insights and Forecast - by Distribution Channel
- 10.2.1. Supermarkets/Hypermarkets
- 10.2.2. Convenience Stores
- 10.2.3. Specialty Stores
- 10.2.4. Online Retail Stores
- 10.2.5. Other Distribution Channels
- 10.1. Market Analysis, Insights and Forecast - by Type
- 11. England UK Gluten Free Market Analysis, Insights and Forecast, 2019-2031
- 12. Wales UK Gluten Free Market Analysis, Insights and Forecast, 2019-2031
- 13. Scotland UK Gluten Free Market Analysis, Insights and Forecast, 2019-2031
- 14. Northern UK Gluten Free Market Analysis, Insights and Forecast, 2019-2031
- 15. Ireland UK Gluten Free Market Analysis, Insights and Forecast, 2019-2031
- 16. Competitive Analysis
- 16.1. Global Market Share Analysis 2024
- 16.2. Company Profiles
- 16.2.1 Nestle SA
- 16.2.1.1. Overview
- 16.2.1.2. Products
- 16.2.1.3. SWOT Analysis
- 16.2.1.4. Recent Developments
- 16.2.1.5. Financials (Based on Availability)
- 16.2.2 Nature's Path Foods
- 16.2.2.1. Overview
- 16.2.2.2. Products
- 16.2.2.3. SWOT Analysis
- 16.2.2.4. Recent Developments
- 16.2.2.5. Financials (Based on Availability)
- 16.2.3 Kraft Heinz UK Limited
- 16.2.3.1. Overview
- 16.2.3.2. Products
- 16.2.3.3. SWOT Analysis
- 16.2.3.4. Recent Developments
- 16.2.3.5. Financials (Based on Availability)
- 16.2.4 McCormick & Company Inc
- 16.2.4.1. Overview
- 16.2.4.2. Products
- 16.2.4.3. SWOT Analysis
- 16.2.4.4. Recent Developments
- 16.2.4.5. Financials (Based on Availability)
- 16.2.5 Nairn's Oatcakes Limited
- 16.2.5.1. Overview
- 16.2.5.2. Products
- 16.2.5.3. SWOT Analysis
- 16.2.5.4. Recent Developments
- 16.2.5.5. Financials (Based on Availability)
- 16.2.6 Ulrick and Short Limited
- 16.2.6.1. Overview
- 16.2.6.2. Products
- 16.2.6.3. SWOT Analysis
- 16.2.6.4. Recent Developments
- 16.2.6.5. Financials (Based on Availability)
- 16.2.7 Amy's Kitchen UK Ltd
- 16.2.7.1. Overview
- 16.2.7.2. Products
- 16.2.7.3. SWOT Analysis
- 16.2.7.4. Recent Developments
- 16.2.7.5. Financials (Based on Availability)
- 16.2.8 Co-operative Group Limited
- 16.2.8.1. Overview
- 16.2.8.2. Products
- 16.2.8.3. SWOT Analysis
- 16.2.8.4. Recent Developments
- 16.2.8.5. Financials (Based on Availability)
- 16.2.9 Fria Brod AB
- 16.2.9.1. Overview
- 16.2.9.2. Products
- 16.2.9.3. SWOT Analysis
- 16.2.9.4. Recent Developments
- 16.2.9.5. Financials (Based on Availability)
- 16.2.10 SA Damm
- 16.2.10.1. Overview
- 16.2.10.2. Products
- 16.2.10.3. SWOT Analysis
- 16.2.10.4. Recent Developments
- 16.2.10.5. Financials (Based on Availability)
- 16.2.1 Nestle SA
List of Figures
- Figure 1: Global UK Gluten Free Market Revenue Breakdown (Million, %) by Region 2024 & 2032
- Figure 2: Global UK Gluten Free Market Volume Breakdown (K Ton, %) by Region 2024 & 2032
- Figure 3: United kingdom Region UK Gluten Free Market Revenue (Million), by Country 2024 & 2032
- Figure 4: United kingdom Region UK Gluten Free Market Volume (K Ton), by Country 2024 & 2032
- Figure 5: United kingdom Region UK Gluten Free Market Revenue Share (%), by Country 2024 & 2032
- Figure 6: United kingdom Region UK Gluten Free Market Volume Share (%), by Country 2024 & 2032
- Figure 7: North America UK Gluten Free Market Revenue (Million), by Type 2024 & 2032
- Figure 8: North America UK Gluten Free Market Volume (K Ton), by Type 2024 & 2032
- Figure 9: North America UK Gluten Free Market Revenue Share (%), by Type 2024 & 2032
- Figure 10: North America UK Gluten Free Market Volume Share (%), by Type 2024 & 2032
- Figure 11: North America UK Gluten Free Market Revenue (Million), by Distribution Channel 2024 & 2032
- Figure 12: North America UK Gluten Free Market Volume (K Ton), by Distribution Channel 2024 & 2032
- Figure 13: North America UK Gluten Free Market Revenue Share (%), by Distribution Channel 2024 & 2032
- Figure 14: North America UK Gluten Free Market Volume Share (%), by Distribution Channel 2024 & 2032
- Figure 15: North America UK Gluten Free Market Revenue (Million), by Country 2024 & 2032
- Figure 16: North America UK Gluten Free Market Volume (K Ton), by Country 2024 & 2032
- Figure 17: North America UK Gluten Free Market Revenue Share (%), by Country 2024 & 2032
- Figure 18: North America UK Gluten Free Market Volume Share (%), by Country 2024 & 2032
- Figure 19: South America UK Gluten Free Market Revenue (Million), by Type 2024 & 2032
- Figure 20: South America UK Gluten Free Market Volume (K Ton), by Type 2024 & 2032
- Figure 21: South America UK Gluten Free Market Revenue Share (%), by Type 2024 & 2032
- Figure 22: South America UK Gluten Free Market Volume Share (%), by Type 2024 & 2032
- Figure 23: South America UK Gluten Free Market Revenue (Million), by Distribution Channel 2024 & 2032
- Figure 24: South America UK Gluten Free Market Volume (K Ton), by Distribution Channel 2024 & 2032
- Figure 25: South America UK Gluten Free Market Revenue Share (%), by Distribution Channel 2024 & 2032
- Figure 26: South America UK Gluten Free Market Volume Share (%), by Distribution Channel 2024 & 2032
- Figure 27: South America UK Gluten Free Market Revenue (Million), by Country 2024 & 2032
- Figure 28: South America UK Gluten Free Market Volume (K Ton), by Country 2024 & 2032
- Figure 29: South America UK Gluten Free Market Revenue Share (%), by Country 2024 & 2032
- Figure 30: South America UK Gluten Free Market Volume Share (%), by Country 2024 & 2032
- Figure 31: Europe UK Gluten Free Market Revenue (Million), by Type 2024 & 2032
- Figure 32: Europe UK Gluten Free Market Volume (K Ton), by Type 2024 & 2032
- Figure 33: Europe UK Gluten Free Market Revenue Share (%), by Type 2024 & 2032
- Figure 34: Europe UK Gluten Free Market Volume Share (%), by Type 2024 & 2032
- Figure 35: Europe UK Gluten Free Market Revenue (Million), by Distribution Channel 2024 & 2032
- Figure 36: Europe UK Gluten Free Market Volume (K Ton), by Distribution Channel 2024 & 2032
- Figure 37: Europe UK Gluten Free Market Revenue Share (%), by Distribution Channel 2024 & 2032
- Figure 38: Europe UK Gluten Free Market Volume Share (%), by Distribution Channel 2024 & 2032
- Figure 39: Europe UK Gluten Free Market Revenue (Million), by Country 2024 & 2032
- Figure 40: Europe UK Gluten Free Market Volume (K Ton), by Country 2024 & 2032
- Figure 41: Europe UK Gluten Free Market Revenue Share (%), by Country 2024 & 2032
- Figure 42: Europe UK Gluten Free Market Volume Share (%), by Country 2024 & 2032
- Figure 43: Middle East & Africa UK Gluten Free Market Revenue (Million), by Type 2024 & 2032
- Figure 44: Middle East & Africa UK Gluten Free Market Volume (K Ton), by Type 2024 & 2032
- Figure 45: Middle East & Africa UK Gluten Free Market Revenue Share (%), by Type 2024 & 2032
- Figure 46: Middle East & Africa UK Gluten Free Market Volume Share (%), by Type 2024 & 2032
- Figure 47: Middle East & Africa UK Gluten Free Market Revenue (Million), by Distribution Channel 2024 & 2032
- Figure 48: Middle East & Africa UK Gluten Free Market Volume (K Ton), by Distribution Channel 2024 & 2032
- Figure 49: Middle East & Africa UK Gluten Free Market Revenue Share (%), by Distribution Channel 2024 & 2032
- Figure 50: Middle East & Africa UK Gluten Free Market Volume Share (%), by Distribution Channel 2024 & 2032
- Figure 51: Middle East & Africa UK Gluten Free Market Revenue (Million), by Country 2024 & 2032
- Figure 52: Middle East & Africa UK Gluten Free Market Volume (K Ton), by Country 2024 & 2032
- Figure 53: Middle East & Africa UK Gluten Free Market Revenue Share (%), by Country 2024 & 2032
- Figure 54: Middle East & Africa UK Gluten Free Market Volume Share (%), by Country 2024 & 2032
- Figure 55: Asia Pacific UK Gluten Free Market Revenue (Million), by Type 2024 & 2032
- Figure 56: Asia Pacific UK Gluten Free Market Volume (K Ton), by Type 2024 & 2032
- Figure 57: Asia Pacific UK Gluten Free Market Revenue Share (%), by Type 2024 & 2032
- Figure 58: Asia Pacific UK Gluten Free Market Volume Share (%), by Type 2024 & 2032
- Figure 59: Asia Pacific UK Gluten Free Market Revenue (Million), by Distribution Channel 2024 & 2032
- Figure 60: Asia Pacific UK Gluten Free Market Volume (K Ton), by Distribution Channel 2024 & 2032
- Figure 61: Asia Pacific UK Gluten Free Market Revenue Share (%), by Distribution Channel 2024 & 2032
- Figure 62: Asia Pacific UK Gluten Free Market Volume Share (%), by Distribution Channel 2024 & 2032
- Figure 63: Asia Pacific UK Gluten Free Market Revenue (Million), by Country 2024 & 2032
- Figure 64: Asia Pacific UK Gluten Free Market Volume (K Ton), by Country 2024 & 2032
- Figure 65: Asia Pacific UK Gluten Free Market Revenue Share (%), by Country 2024 & 2032
- Figure 66: Asia Pacific UK Gluten Free Market Volume Share (%), by Country 2024 & 2032
List of Tables
- Table 1: Global UK Gluten Free Market Revenue Million Forecast, by Region 2019 & 2032
- Table 2: Global UK Gluten Free Market Volume K Ton Forecast, by Region 2019 & 2032
- Table 3: Global UK Gluten Free Market Revenue Million Forecast, by Type 2019 & 2032
- Table 4: Global UK Gluten Free Market Volume K Ton Forecast, by Type 2019 & 2032
- Table 5: Global UK Gluten Free Market Revenue Million Forecast, by Distribution Channel 2019 & 2032
- Table 6: Global UK Gluten Free Market Volume K Ton Forecast, by Distribution Channel 2019 & 2032
- Table 7: Global UK Gluten Free Market Revenue Million Forecast, by Region 2019 & 2032
- Table 8: Global UK Gluten Free Market Volume K Ton Forecast, by Region 2019 & 2032
- Table 9: Global UK Gluten Free Market Revenue Million Forecast, by Country 2019 & 2032
- Table 10: Global UK Gluten Free Market Volume K Ton Forecast, by Country 2019 & 2032
- Table 11: England UK Gluten Free Market Revenue (Million) Forecast, by Application 2019 & 2032
- Table 12: England UK Gluten Free Market Volume (K Ton) Forecast, by Application 2019 & 2032
- Table 13: Wales UK Gluten Free Market Revenue (Million) Forecast, by Application 2019 & 2032
- Table 14: Wales UK Gluten Free Market Volume (K Ton) Forecast, by Application 2019 & 2032
- Table 15: Scotland UK Gluten Free Market Revenue (Million) Forecast, by Application 2019 & 2032
- Table 16: Scotland UK Gluten Free Market Volume (K Ton) Forecast, by Application 2019 & 2032
- Table 17: Northern UK Gluten Free Market Revenue (Million) Forecast, by Application 2019 & 2032
- Table 18: Northern UK Gluten Free Market Volume (K Ton) Forecast, by Application 2019 & 2032
- Table 19: Ireland UK Gluten Free Market Revenue (Million) Forecast, by Application 2019 & 2032
- Table 20: Ireland UK Gluten Free Market Volume (K Ton) Forecast, by Application 2019 & 2032
- Table 21: Global UK Gluten Free Market Revenue Million Forecast, by Type 2019 & 2032
- Table 22: Global UK Gluten Free Market Volume K Ton Forecast, by Type 2019 & 2032
- Table 23: Global UK Gluten Free Market Revenue Million Forecast, by Distribution Channel 2019 & 2032
- Table 24: Global UK Gluten Free Market Volume K Ton Forecast, by Distribution Channel 2019 & 2032
- Table 25: Global UK Gluten Free Market Revenue Million Forecast, by Country 2019 & 2032
- Table 26: Global UK Gluten Free Market Volume K Ton Forecast, by Country 2019 & 2032
- Table 27: United States UK Gluten Free Market Revenue (Million) Forecast, by Application 2019 & 2032
- Table 28: United States UK Gluten Free Market Volume (K Ton) Forecast, by Application 2019 & 2032
- Table 29: Canada UK Gluten Free Market Revenue (Million) Forecast, by Application 2019 & 2032
- Table 30: Canada UK Gluten Free Market Volume (K Ton) Forecast, by Application 2019 & 2032
- Table 31: Mexico UK Gluten Free Market Revenue (Million) Forecast, by Application 2019 & 2032
- Table 32: Mexico UK Gluten Free Market Volume (K Ton) Forecast, by Application 2019 & 2032
- Table 33: Global UK Gluten Free Market Revenue Million Forecast, by Type 2019 & 2032
- Table 34: Global UK Gluten Free Market Volume K Ton Forecast, by Type 2019 & 2032
- Table 35: Global UK Gluten Free Market Revenue Million Forecast, by Distribution Channel 2019 & 2032
- Table 36: Global UK Gluten Free Market Volume K Ton Forecast, by Distribution Channel 2019 & 2032
- Table 37: Global UK Gluten Free Market Revenue Million Forecast, by Country 2019 & 2032
- Table 38: Global UK Gluten Free Market Volume K Ton Forecast, by Country 2019 & 2032
- Table 39: Brazil UK Gluten Free Market Revenue (Million) Forecast, by Application 2019 & 2032
- Table 40: Brazil UK Gluten Free Market Volume (K Ton) Forecast, by Application 2019 & 2032
- Table 41: Argentina UK Gluten Free Market Revenue (Million) Forecast, by Application 2019 & 2032
- Table 42: Argentina UK Gluten Free Market Volume (K Ton) Forecast, by Application 2019 & 2032
- Table 43: Rest of South America UK Gluten Free Market Revenue (Million) Forecast, by Application 2019 & 2032
- Table 44: Rest of South America UK Gluten Free Market Volume (K Ton) Forecast, by Application 2019 & 2032
- Table 45: Global UK Gluten Free Market Revenue Million Forecast, by Type 2019 & 2032
- Table 46: Global UK Gluten Free Market Volume K Ton Forecast, by Type 2019 & 2032
- Table 47: Global UK Gluten Free Market Revenue Million Forecast, by Distribution Channel 2019 & 2032
- Table 48: Global UK Gluten Free Market Volume K Ton Forecast, by Distribution Channel 2019 & 2032
- Table 49: Global UK Gluten Free Market Revenue Million Forecast, by Country 2019 & 2032
- Table 50: Global UK Gluten Free Market Volume K Ton Forecast, by Country 2019 & 2032
- Table 51: United Kingdom UK Gluten Free Market Revenue (Million) Forecast, by Application 2019 & 2032
- Table 52: United Kingdom UK Gluten Free Market Volume (K Ton) Forecast, by Application 2019 & 2032
- Table 53: Germany UK Gluten Free Market Revenue (Million) Forecast, by Application 2019 & 2032
- Table 54: Germany UK Gluten Free Market Volume (K Ton) Forecast, by Application 2019 & 2032
- Table 55: France UK Gluten Free Market Revenue (Million) Forecast, by Application 2019 & 2032
- Table 56: France UK Gluten Free Market Volume (K Ton) Forecast, by Application 2019 & 2032
- Table 57: Italy UK Gluten Free Market Revenue (Million) Forecast, by Application 2019 & 2032
- Table 58: Italy UK Gluten Free Market Volume (K Ton) Forecast, by Application 2019 & 2032
- Table 59: Spain UK Gluten Free Market Revenue (Million) Forecast, by Application 2019 & 2032
- Table 60: Spain UK Gluten Free Market Volume (K Ton) Forecast, by Application 2019 & 2032
- Table 61: Russia UK Gluten Free Market Revenue (Million) Forecast, by Application 2019 & 2032
- Table 62: Russia UK Gluten Free Market Volume (K Ton) Forecast, by Application 2019 & 2032
- Table 63: Benelux UK Gluten Free Market Revenue (Million) Forecast, by Application 2019 & 2032
- Table 64: Benelux UK Gluten Free Market Volume (K Ton) Forecast, by Application 2019 & 2032
- Table 65: Nordics UK Gluten Free Market Revenue (Million) Forecast, by Application 2019 & 2032
- Table 66: Nordics UK Gluten Free Market Volume (K Ton) Forecast, by Application 2019 & 2032
- Table 67: Rest of Europe UK Gluten Free Market Revenue (Million) Forecast, by Application 2019 & 2032
- Table 68: Rest of Europe UK Gluten Free Market Volume (K Ton) Forecast, by Application 2019 & 2032
- Table 69: Global UK Gluten Free Market Revenue Million Forecast, by Type 2019 & 2032
- Table 70: Global UK Gluten Free Market Volume K Ton Forecast, by Type 2019 & 2032
- Table 71: Global UK Gluten Free Market Revenue Million Forecast, by Distribution Channel 2019 & 2032
- Table 72: Global UK Gluten Free Market Volume K Ton Forecast, by Distribution Channel 2019 & 2032
- Table 73: Global UK Gluten Free Market Revenue Million Forecast, by Country 2019 & 2032
- Table 74: Global UK Gluten Free Market Volume K Ton Forecast, by Country 2019 & 2032
- Table 75: Turkey UK Gluten Free Market Revenue (Million) Forecast, by Application 2019 & 2032
- Table 76: Turkey UK Gluten Free Market Volume (K Ton) Forecast, by Application 2019 & 2032
- Table 77: Israel UK Gluten Free Market Revenue (Million) Forecast, by Application 2019 & 2032
- Table 78: Israel UK Gluten Free Market Volume (K Ton) Forecast, by Application 2019 & 2032
- Table 79: GCC UK Gluten Free Market Revenue (Million) Forecast, by Application 2019 & 2032
- Table 80: GCC UK Gluten Free Market Volume (K Ton) Forecast, by Application 2019 & 2032
- Table 81: North Africa UK Gluten Free Market Revenue (Million) Forecast, by Application 2019 & 2032
- Table 82: North Africa UK Gluten Free Market Volume (K Ton) Forecast, by Application 2019 & 2032
- Table 83: South Africa UK Gluten Free Market Revenue (Million) Forecast, by Application 2019 & 2032
- Table 84: South Africa UK Gluten Free Market Volume (K Ton) Forecast, by Application 2019 & 2032
- Table 85: Rest of Middle East & Africa UK Gluten Free Market Revenue (Million) Forecast, by Application 2019 & 2032
- Table 86: Rest of Middle East & Africa UK Gluten Free Market Volume (K Ton) Forecast, by Application 2019 & 2032
- Table 87: Global UK Gluten Free Market Revenue Million Forecast, by Type 2019 & 2032
- Table 88: Global UK Gluten Free Market Volume K Ton Forecast, by Type 2019 & 2032
- Table 89: Global UK Gluten Free Market Revenue Million Forecast, by Distribution Channel 2019 & 2032
- Table 90: Global UK Gluten Free Market Volume K Ton Forecast, by Distribution Channel 2019 & 2032
- Table 91: Global UK Gluten Free Market Revenue Million Forecast, by Country 2019 & 2032
- Table 92: Global UK Gluten Free Market Volume K Ton Forecast, by Country 2019 & 2032
- Table 93: China UK Gluten Free Market Revenue (Million) Forecast, by Application 2019 & 2032
- Table 94: China UK Gluten Free Market Volume (K Ton) Forecast, by Application 2019 & 2032
- Table 95: India UK Gluten Free Market Revenue (Million) Forecast, by Application 2019 & 2032
- Table 96: India UK Gluten Free Market Volume (K Ton) Forecast, by Application 2019 & 2032
- Table 97: Japan UK Gluten Free Market Revenue (Million) Forecast, by Application 2019 & 2032
- Table 98: Japan UK Gluten Free Market Volume (K Ton) Forecast, by Application 2019 & 2032
- Table 99: South Korea UK Gluten Free Market Revenue (Million) Forecast, by Application 2019 & 2032
- Table 100: South Korea UK Gluten Free Market Volume (K Ton) Forecast, by Application 2019 & 2032
- Table 101: ASEAN UK Gluten Free Market Revenue (Million) Forecast, by Application 2019 & 2032
- Table 102: ASEAN UK Gluten Free Market Volume (K Ton) Forecast, by Application 2019 & 2032
- Table 103: Oceania UK Gluten Free Market Revenue (Million) Forecast, by Application 2019 & 2032
- Table 104: Oceania UK Gluten Free Market Volume (K Ton) Forecast, by Application 2019 & 2032
- Table 105: Rest of Asia Pacific UK Gluten Free Market Revenue (Million) Forecast, by Application 2019 & 2032
- Table 106: Rest of Asia Pacific UK Gluten Free Market Volume (K Ton) Forecast, by Application 2019 & 2032
Frequently Asked Questions
1. What is the projected Compound Annual Growth Rate (CAGR) of the UK Gluten Free Market?
The projected CAGR is approximately 8.70%.
2. Which companies are prominent players in the UK Gluten Free Market?
Key companies in the market include Nestle SA, Nature's Path Foods, Kraft Heinz UK Limited, McCormick & Company Inc, Nairn's Oatcakes Limited, Ulrick and Short Limited, Amy's Kitchen UK Ltd, Co-operative Group Limited, Fria Brod AB, SA Damm.
3. What are the main segments of the UK Gluten Free Market?
The market segments include Type, Distribution Channel.
4. Can you provide details about the market size?
The market size is estimated to be USD XX Million as of 2022.
5. What are some drivers contributing to market growth?
Increasing Sports Participation; Increasing Awareness about Health and Fitness.
6. What are the notable trends driving market growth?
Increasing Demand for Dietary Food.
7. Are there any restraints impacting market growth?
Adverse Effects of Overconsumption of Products.
8. Can you provide examples of recent developments in the market?
MAY 2022: Lindt Lindor launched its gluten-free chocolates in different recipes and flavors, including orange and almond, hazelnut, caramel and sea salt, and many more.
9. What pricing options are available for accessing the report?
Pricing options include single-user, multi-user, and enterprise licenses priced at USD 3800, USD 4500, and USD 5800 respectively.
10. Is the market size provided in terms of value or volume?
The market size is provided in terms of value, measured in Million and volume, measured in K Ton.
11. Are there any specific market keywords associated with the report?
Yes, the market keyword associated with the report is "UK Gluten Free Market," which aids in identifying and referencing the specific market segment covered.
12. How do I determine which pricing option suits my needs best?
The pricing options vary based on user requirements and access needs. Individual users may opt for single-user licenses, while businesses requiring broader access may choose multi-user or enterprise licenses for cost-effective access to the report.
13. Are there any additional resources or data provided in the UK Gluten Free Market report?
While the report offers comprehensive insights, it's advisable to review the specific contents or supplementary materials provided to ascertain if additional resources or data are available.
14. How can I stay updated on further developments or reports in the UK Gluten Free Market?
To stay informed about further developments, trends, and reports in the UK Gluten Free Market, consider subscribing to industry newsletters, following relevant companies and organizations, or regularly checking reputable industry news sources and publications.
Methodology
Step 1 - Identification of Relevant Samples Size from Population Database


Step 2 - Approaches for Defining Global Market Size (Value, Volume* & Price*)

Note*: In applicable scenarios
Step 3 - Data Sources
Primary Research
- Web Analytics
- Survey Reports
- Research Institute
- Latest Research Reports
- Opinion Leaders
Secondary Research
- Annual Reports
- White Paper
- Latest Press Release
- Industry Association
- Paid Database
- Investor Presentations

Step 4 - Data Triangulation
Involves using different sources of information in order to increase the validity of a study
These sources are likely to be stakeholders in a program - participants, other researchers, program staff, other community members, and so on.
Then we put all data in single framework & apply various statistical tools to find out the dynamic on the market.
During the analysis stage, feedback from the stakeholder groups would be compared to determine areas of agreement as well as areas of divergence


