
Key Insights
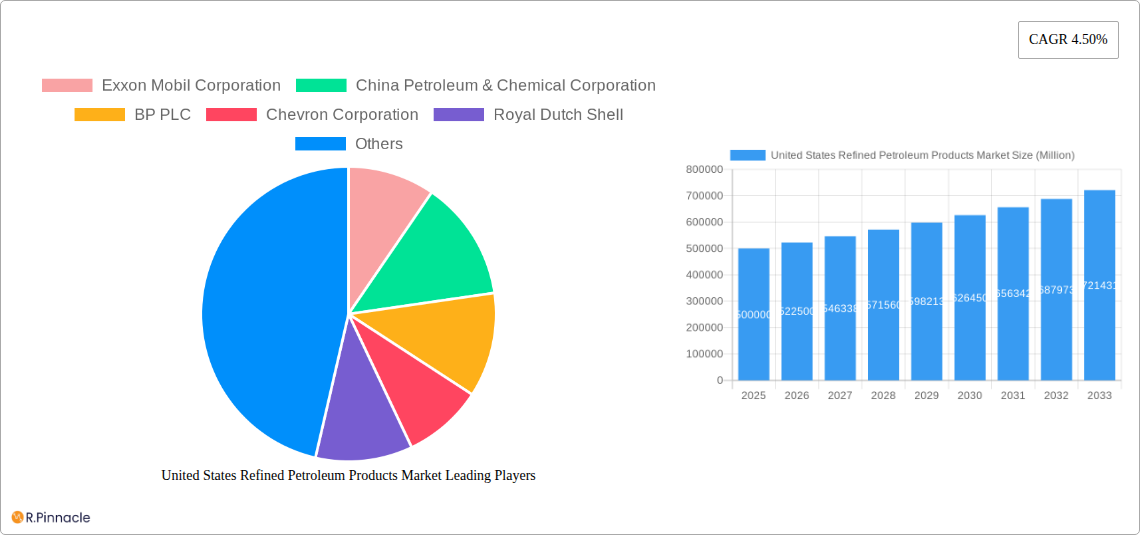
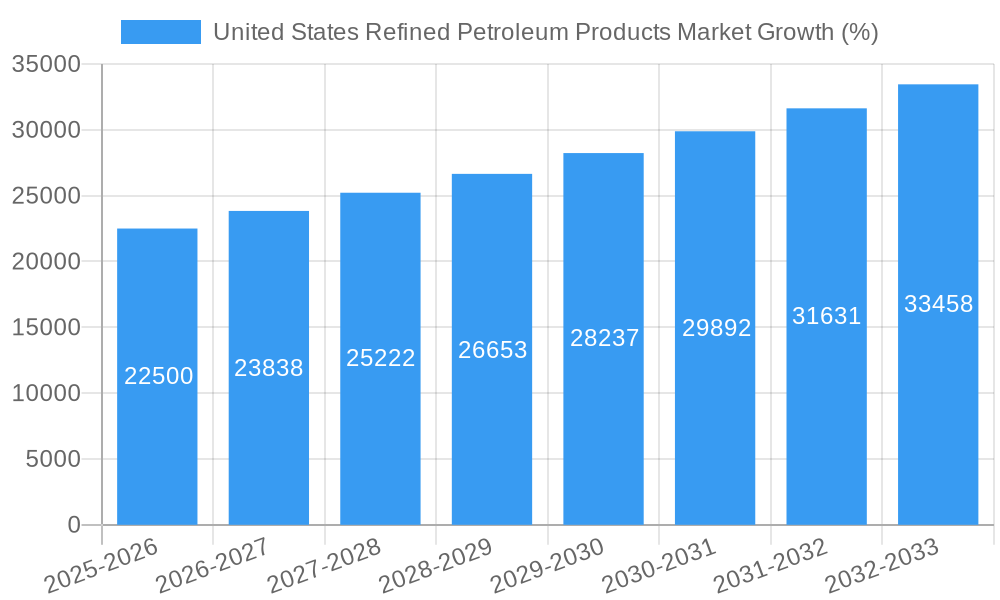
The United States Refined Petroleum Products market, valued at approximately $500 billion in 2025, is projected to experience steady growth, driven primarily by robust demand from the transportation sector, particularly automotive fuels. A compound annual growth rate (CAGR) of 4.5% from 2025 to 2033 indicates a significant market expansion, reaching an estimated value exceeding $750 billion by 2033. This growth is fueled by the continued reliance on gasoline and diesel for personal and commercial vehicles, despite increasing adoption of electric vehicles. Further growth drivers include the sustained demand for aviation fuels, linked to air travel growth, and marine fuels, underpinned by global maritime trade. However, the market faces constraints such as increasing environmental regulations promoting cleaner energy sources and fluctuating crude oil prices, which impact refining margins. The segmental breakdown reveals automotive fuels hold the largest market share, followed by marine fuels and aviation fuels. Competition within this market is intense, with major players like Exxon Mobil, Chevron, and BP vying for market dominance through strategic investments in refining capacity, technological advancements, and diversification into alternative fuel options.
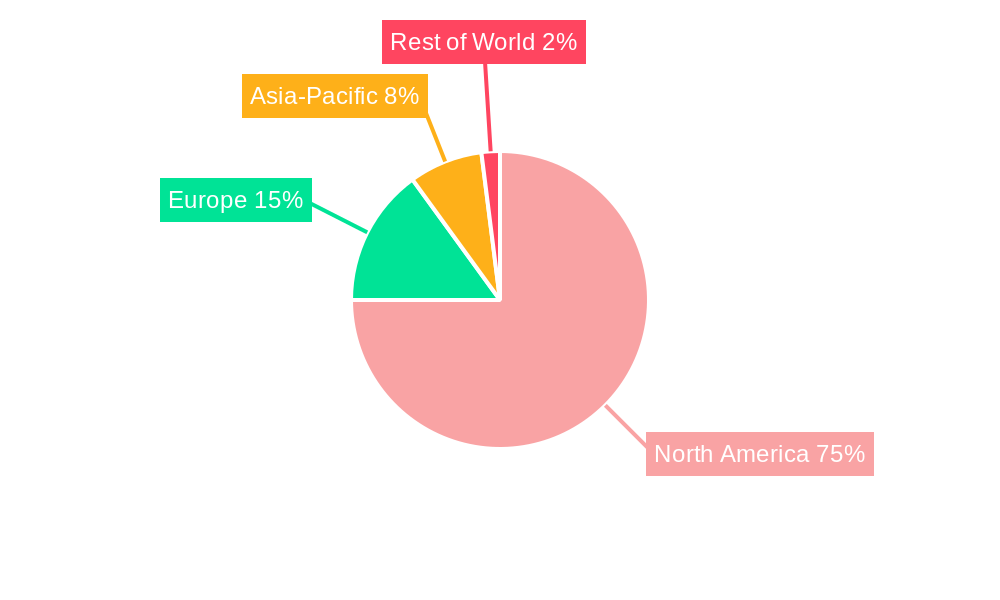
The North American market, dominated by the United States, presents the largest regional opportunity within the refined petroleum products sector. While the increasing adoption of renewable energy sources and stringent emission regulations pose challenges, the continued expansion of the transportation sector and the inherent demand for petroleum-based products suggest the market will remain substantial throughout the forecast period. Growth strategies for market participants include investing in advanced refining technologies to produce cleaner fuels, exploring biofuel integration, and focusing on logistics and supply chain efficiency. Moreover, geopolitical factors and global energy dynamics could significantly influence the future trajectory of this market. Therefore, continuous monitoring of these elements is crucial for businesses operating within this dynamic landscape.
United States Refined Petroleum Products Market: A Comprehensive Report (2019-2033)
This in-depth report provides a comprehensive analysis of the United States Refined Petroleum Products Market, offering crucial insights for industry professionals, investors, and strategic planners. The study covers the period 2019-2033, with a focus on the forecast period 2025-2033, utilizing 2025 as the base and estimated year. The report unveils market dynamics, key players, growth drivers, and emerging opportunities, equipping readers with actionable intelligence to navigate this dynamic sector.
United States Refined Petroleum Products Market Structure & Innovation Trends
This section analyzes the competitive landscape, innovation drivers, and regulatory environment shaping the U.S. refined petroleum products market. The market is characterized by a high degree of concentration, with major players such as Exxon Mobil Corporation, China Petroleum & Chemical Corporation, BP PLC, Chevron Corporation, and Royal Dutch Shell holding significant market share. The exact market share distribution for 2025 is currently under calculation and will be included in the final report; however, initial estimates suggest Exxon Mobil Corporation holds approximately xx% of the market.
- Market Concentration: High, with top 5 players controlling approximately xx% of the market in 2025.
- Innovation Drivers: Demand for cleaner fuels, stricter emission regulations, and advancements in refining technologies are key innovation drivers.
- Regulatory Framework: EPA regulations concerning fuel quality and emission standards significantly influence market dynamics.
- Product Substitutes: Growing adoption of electric vehicles and alternative energy sources poses a long-term challenge to market growth.
- M&A Activities: The market has witnessed several mergers and acquisitions in recent years, with deals valued at approximately USD xx Million in 2024. These activities are primarily driven by the need for consolidation, expansion of market share, and access to new technologies. For example, Contango Oil & Gas's acquisition of assets from ConocoPhillips illustrates this trend. The total M&A deal value for the period 2019-2024 is estimated at USD xx Million.
- End-User Demographics: The market is primarily driven by transportation, industrial, and residential sectors, with automotive fuels dominating the demand landscape.
United States Refined Petroleum Products Market Dynamics & Trends
The U.S. refined petroleum products market is experiencing a complex interplay of factors driving its growth and evolution. Growth is primarily driven by increasing energy consumption across various sectors, coupled with robust economic activity. Technological advancements in refining processes enhance efficiency and produce cleaner fuels, while the increasing adoption of electric vehicles and stricter emissions regulations represent significant challenges. Consumer preferences are increasingly shifting towards cleaner and more sustainable fuel options. The competitive dynamics are intense, with major players focusing on operational efficiency, product innovation, and strategic partnerships to maintain their market positions. The CAGR for the period 2025-2033 is projected to be xx%, with a market penetration of xx% in specific segments. This figure reflects the evolving energy landscape and the gradual shift towards cleaner energy sources. Further analysis of consumer behavior, technological breakthroughs, and their influence on market share will provide greater insight into this dynamic sector.
Dominant Regions & Segments in United States Refined Petroleum Products Market
The analysis reveals that the automotive fuels segment dominates the U.S. refined petroleum products market, driven by the high prevalence of gasoline and diesel-powered vehicles. Specific regions within the United States demonstrate varying levels of dominance across segments. The South Central and Gulf Coast regions, benefiting from extensive refining capacity and proximity to major crude oil sources, exhibit high dominance in multiple segments.
Automotive Fuels: This segment's dominance stems from the substantial demand for gasoline and diesel fuel in the transportation sector, with key drivers including the vast number of vehicles on the road and the prevalent use of internal combustion engines.
Marine Fuels: This segment, while smaller than automotive fuels, is influenced by factors like maritime trade activity and regulations related to emission standards for shipping vessels.
Aviation Fuels: The aviation fuel segment is strongly tied to air travel patterns, economic activity, and the overall health of the airline industry.
Liquefied Petroleum Gas (LPG): This segment shows growth due to its use in residential heating and industrial applications.
Other Fuel Types: This category includes specialty fuels and other petroleum products, with their growth impacted by specific industrial needs and technological advancements.
Key drivers for regional dominance include access to crude oil resources, existing refining infrastructure, and favorable economic conditions. Furthermore, the development of specific refining facilities and the implementation of government policies significantly impact the dominance of certain regions.
United States Refined Petroleum Products Market Product Innovations
Recent product innovations in the U.S. refined petroleum products market focus on improving fuel efficiency, reducing emissions, and enhancing performance. Advancements in blending technology lead to cleaner-burning fuels that meet stringent environmental regulations. The development of biofuels and alternative fuel blends reflects a growing commitment to sustainability. These innovations are crucial for maintaining market relevance in a landscape increasingly concerned with environmental protection and the transition towards sustainable energy sources. The market fit of these innovations is heavily influenced by government policies, consumer demand, and the overall trajectory of the energy sector.
Report Scope & Segmentation Analysis
This report offers a granular segmentation analysis of the U.S. refined petroleum products market. The segmentation covers five key product types: Automotive Fuels, Marine Fuels, Aviation Fuels, Liquefied Petroleum Gas (LPG), and Other Fuel Types. Each segment is analyzed in terms of its market size, growth projections, and competitive dynamics. The Automotive Fuels segment holds the largest market share, followed by the LPG segment. The report explores the specific factors affecting growth within each segment.
- Automotive Fuels: Projected to maintain the largest market share, driven by consistent demand from the transportation sector.
- Marine Fuels: Experiencing moderate growth, contingent upon global shipping trends and environmental regulations.
- Aviation Fuels: Growth closely correlated with air travel volume and economic activity.
- Liquefied Petroleum Gas (LPG): Steady growth expected due to industrial and residential applications.
- Other Fuel Types: Market size and growth rate varies significantly based on specific product types within the segment.
Key Drivers of United States Refined Petroleum Products Market Growth
Several factors drive growth within the U.S. refined petroleum products market. Strong economic activity increases energy demand across all sectors, bolstering the need for petroleum products. Growth in the transportation sector, particularly the trucking and aviation industries, directly impacts fuel consumption. The continuous development and adoption of more efficient refining processes enhance output and reduce costs. Government policies related to infrastructure development and energy security further influence market dynamics.
Challenges in the United States Refined Petroleum Products Market Sector
The U.S. refined petroleum products market faces numerous challenges. Stringent environmental regulations, aimed at reducing emissions, add to production costs and impact market profitability. Fluctuations in crude oil prices create uncertainty, affecting the overall market stability. The increasing adoption of electric vehicles and alternative fuels poses a potential threat to long-term demand. Supply chain disruptions can also impact availability and pricing. The overall impact of these challenges will be reflected in reduced growth rates in some segments over the forecast period.
Emerging Opportunities in United States Refined Petroleum Products Market
Despite challenges, several emerging opportunities exist. The development and adoption of biofuels and renewable fuel blends offer significant growth potential. Advancements in fuel efficiency technologies and cleaner combustion processes meet stringent environmental regulations and consumer preferences. Government initiatives to improve infrastructure, particularly pipelines and transportation networks, support market expansion.
Leading Players in the United States Refined Petroleum Products Market Market
- Exxon Mobil Corporation
- China Petroleum & Chemical Corporation
- BP PLC
- Chevron Corporation
- Royal Dutch Shell
Key Developments in United States Refined Petroleum Products Market Industry
- July 2021: Contango Oil & Gas acquired low-decline, conventional gas assets in Wyoming from ConocoPhillips for USD 67 Million. This acquisition demonstrates ongoing consolidation within the industry and a focus on securing reliable gas reserves.
Future Outlook for United States Refined Petroleum Products Market Market
The future of the U.S. refined petroleum products market is shaped by a complex interplay of factors. While the long-term transition towards cleaner energy sources presents challenges, the demand for petroleum products remains significant in the near to mid-term. Strategic investments in refining technologies, focus on sustainable fuel development, and adaptation to evolving government regulations will be key to success in this dynamic market. Growth will likely be moderate, driven by the ongoing demands of traditional sectors and evolving consumer preferences.
United States Refined Petroleum Products Market Segmentation
-
1. Type
- 1.1. Automotive Fuels
- 1.2. Marine Fuels
- 1.3. Aviation Fuels
- 1.4. Liquefied Petroleum Gas (LPG)
- 1.5. Other Fuel Types
- 2. Geography
United States Refined Petroleum Products Market Segmentation By Geography
- 1. United States
United States Refined Petroleum Products Market REPORT HIGHLIGHTS
| Aspects | Details |
|---|---|
| Study Period | 2019-2033 |
| Base Year | 2024 |
| Estimated Year | 2025 |
| Forecast Period | 2025-2033 |
| Historical Period | 2019-2024 |
| Growth Rate | CAGR of 4.50% from 2019-2033 |
| Segmentation |
|
Table of Contents
- 1. Introduction
- 1.1. Research Scope
- 1.2. Market Segmentation
- 1.3. Research Methodology
- 1.4. Definitions and Assumptions
- 2. Executive Summary
- 2.1. Introduction
- 3. Market Dynamics
- 3.1. Introduction
- 3.2. Market Drivers
- 3.2.1. 4.; Growing Demand for Renewable Energy4.; Upcoming Investments in the Energy Sector and Supportive Renewable Energy Policies
- 3.3. Market Restrains
- 3.3.1. 4.; High Initial Investment Cost and Long Investment Return Period on Projects
- 3.4. Market Trends
- 3.4.1. Aviation Fuel Usage to Grow Significantly
- 4. Market Factor Analysis
- 4.1. Porters Five Forces
- 4.2. Supply/Value Chain
- 4.3. PESTEL analysis
- 4.4. Market Entropy
- 4.5. Patent/Trademark Analysis
- 5. United States Refined Petroleum Products Market Analysis, Insights and Forecast, 2019-2031
- 5.1. Market Analysis, Insights and Forecast - by Type
- 5.1.1. Automotive Fuels
- 5.1.2. Marine Fuels
- 5.1.3. Aviation Fuels
- 5.1.4. Liquefied Petroleum Gas (LPG)
- 5.1.5. Other Fuel Types
- 5.2. Market Analysis, Insights and Forecast - by Geography
- 5.3. Market Analysis, Insights and Forecast - by Region
- 5.3.1. United States
- 5.1. Market Analysis, Insights and Forecast - by Type
- 6. United States United States Refined Petroleum Products Market Analysis, Insights and Forecast, 2019-2031
- 7. Canada United States Refined Petroleum Products Market Analysis, Insights and Forecast, 2019-2031
- 8. Rest of North America United States Refined Petroleum Products Market Analysis, Insights and Forecast, 2019-2031
- 9. Competitive Analysis
- 9.1. Market Share Analysis 2024
- 9.2. Company Profiles
- 9.2.1 Exxon Mobil Corporation
- 9.2.1.1. Overview
- 9.2.1.2. Products
- 9.2.1.3. SWOT Analysis
- 9.2.1.4. Recent Developments
- 9.2.1.5. Financials (Based on Availability)
- 9.2.2 China Petroleum & Chemical Corporation
- 9.2.2.1. Overview
- 9.2.2.2. Products
- 9.2.2.3. SWOT Analysis
- 9.2.2.4. Recent Developments
- 9.2.2.5. Financials (Based on Availability)
- 9.2.3 BP PLC
- 9.2.3.1. Overview
- 9.2.3.2. Products
- 9.2.3.3. SWOT Analysis
- 9.2.3.4. Recent Developments
- 9.2.3.5. Financials (Based on Availability)
- 9.2.4 Chevron Corporation
- 9.2.4.1. Overview
- 9.2.4.2. Products
- 9.2.4.3. SWOT Analysis
- 9.2.4.4. Recent Developments
- 9.2.4.5. Financials (Based on Availability)
- 9.2.5 Royal Dutch Shell
- 9.2.5.1. Overview
- 9.2.5.2. Products
- 9.2.5.3. SWOT Analysis
- 9.2.5.4. Recent Developments
- 9.2.5.5. Financials (Based on Availability)
- 9.2.1 Exxon Mobil Corporation
List of Figures
- Figure 1: United States Refined Petroleum Products Market Revenue Breakdown (Million, %) by Product 2024 & 2032
- Figure 2: United States Refined Petroleum Products Market Share (%) by Company 2024
List of Tables
- Table 1: United States Refined Petroleum Products Market Revenue Million Forecast, by Region 2019 & 2032
- Table 2: United States Refined Petroleum Products Market Volume Litre Forecast, by Region 2019 & 2032
- Table 3: United States Refined Petroleum Products Market Revenue Million Forecast, by Type 2019 & 2032
- Table 4: United States Refined Petroleum Products Market Volume Litre Forecast, by Type 2019 & 2032
- Table 5: United States Refined Petroleum Products Market Revenue Million Forecast, by Geography 2019 & 2032
- Table 6: United States Refined Petroleum Products Market Volume Litre Forecast, by Geography 2019 & 2032
- Table 7: United States Refined Petroleum Products Market Revenue Million Forecast, by Region 2019 & 2032
- Table 8: United States Refined Petroleum Products Market Volume Litre Forecast, by Region 2019 & 2032
- Table 9: United States Refined Petroleum Products Market Revenue Million Forecast, by Country 2019 & 2032
- Table 10: United States Refined Petroleum Products Market Volume Litre Forecast, by Country 2019 & 2032
- Table 11: United States United States Refined Petroleum Products Market Revenue (Million) Forecast, by Application 2019 & 2032
- Table 12: United States United States Refined Petroleum Products Market Volume (Litre) Forecast, by Application 2019 & 2032
- Table 13: Canada United States Refined Petroleum Products Market Revenue (Million) Forecast, by Application 2019 & 2032
- Table 14: Canada United States Refined Petroleum Products Market Volume (Litre) Forecast, by Application 2019 & 2032
- Table 15: Rest of North America United States Refined Petroleum Products Market Revenue (Million) Forecast, by Application 2019 & 2032
- Table 16: Rest of North America United States Refined Petroleum Products Market Volume (Litre) Forecast, by Application 2019 & 2032
- Table 17: United States Refined Petroleum Products Market Revenue Million Forecast, by Type 2019 & 2032
- Table 18: United States Refined Petroleum Products Market Volume Litre Forecast, by Type 2019 & 2032
- Table 19: United States Refined Petroleum Products Market Revenue Million Forecast, by Geography 2019 & 2032
- Table 20: United States Refined Petroleum Products Market Volume Litre Forecast, by Geography 2019 & 2032
- Table 21: United States Refined Petroleum Products Market Revenue Million Forecast, by Country 2019 & 2032
- Table 22: United States Refined Petroleum Products Market Volume Litre Forecast, by Country 2019 & 2032
Frequently Asked Questions
1. What is the projected Compound Annual Growth Rate (CAGR) of the United States Refined Petroleum Products Market?
The projected CAGR is approximately 4.50%.
2. Which companies are prominent players in the United States Refined Petroleum Products Market?
Key companies in the market include Exxon Mobil Corporation, China Petroleum & Chemical Corporation, BP PLC, Chevron Corporation, Royal Dutch Shell.
3. What are the main segments of the United States Refined Petroleum Products Market?
The market segments include Type, Geography.
4. Can you provide details about the market size?
The market size is estimated to be USD XX Million as of 2022.
5. What are some drivers contributing to market growth?
4.; Growing Demand for Renewable Energy4.; Upcoming Investments in the Energy Sector and Supportive Renewable Energy Policies.
6. What are the notable trends driving market growth?
Aviation Fuel Usage to Grow Significantly.
7. Are there any restraints impacting market growth?
4.; High Initial Investment Cost and Long Investment Return Period on Projects.
8. Can you provide examples of recent developments in the market?
July 2021: Contango Oil & Gas agreed to acquire low-decline, conventional gas assets in the Wind River Basin of Wyoming, United States, from ConocoPhillips in a USD 67 million cash deal.
9. What pricing options are available for accessing the report?
Pricing options include single-user, multi-user, and enterprise licenses priced at USD 3800, USD 4500, and USD 5800 respectively.
10. Is the market size provided in terms of value or volume?
The market size is provided in terms of value, measured in Million and volume, measured in Litre.
11. Are there any specific market keywords associated with the report?
Yes, the market keyword associated with the report is "United States Refined Petroleum Products Market," which aids in identifying and referencing the specific market segment covered.
12. How do I determine which pricing option suits my needs best?
The pricing options vary based on user requirements and access needs. Individual users may opt for single-user licenses, while businesses requiring broader access may choose multi-user or enterprise licenses for cost-effective access to the report.
13. Are there any additional resources or data provided in the United States Refined Petroleum Products Market report?
While the report offers comprehensive insights, it's advisable to review the specific contents or supplementary materials provided to ascertain if additional resources or data are available.
14. How can I stay updated on further developments or reports in the United States Refined Petroleum Products Market?
To stay informed about further developments, trends, and reports in the United States Refined Petroleum Products Market, consider subscribing to industry newsletters, following relevant companies and organizations, or regularly checking reputable industry news sources and publications.
Methodology
Step 1 - Identification of Relevant Samples Size from Population Database


Step 2 - Approaches for Defining Global Market Size (Value, Volume* & Price*)

Note*: In applicable scenarios
Step 3 - Data Sources
Primary Research
- Web Analytics
- Survey Reports
- Research Institute
- Latest Research Reports
- Opinion Leaders
Secondary Research
- Annual Reports
- White Paper
- Latest Press Release
- Industry Association
- Paid Database
- Investor Presentations

Step 4 - Data Triangulation
Involves using different sources of information in order to increase the validity of a study
These sources are likely to be stakeholders in a program - participants, other researchers, program staff, other community members, and so on.
Then we put all data in single framework & apply various statistical tools to find out the dynamic on the market.
During the analysis stage, feedback from the stakeholder groups would be compared to determine areas of agreement as well as areas of divergence


