
Key Insights
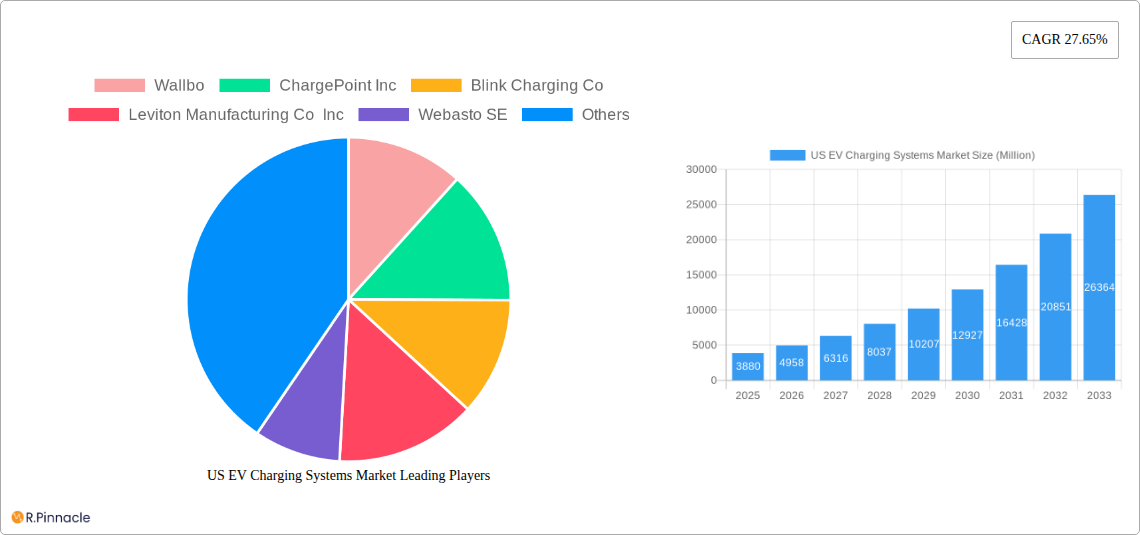
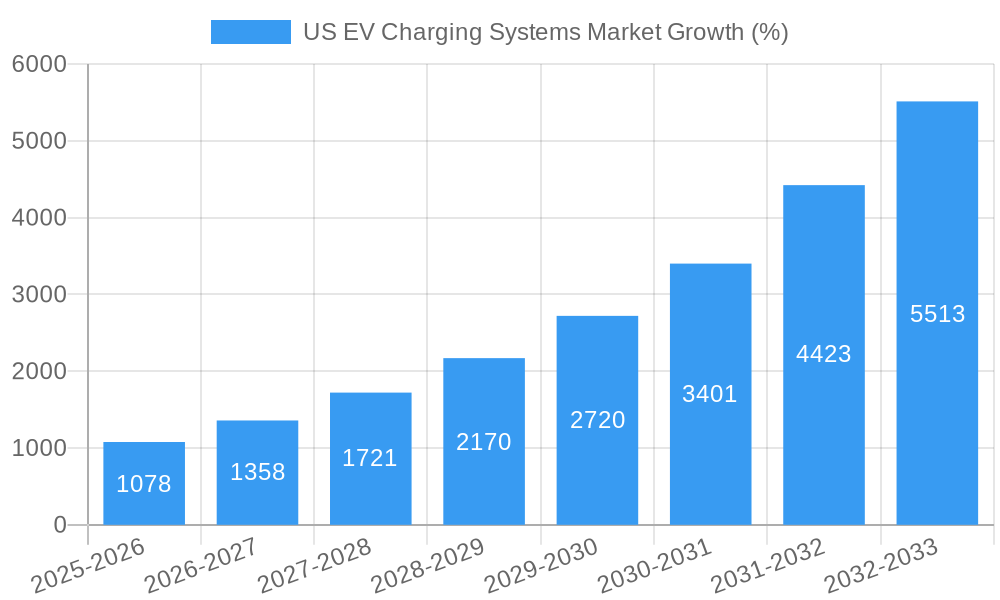
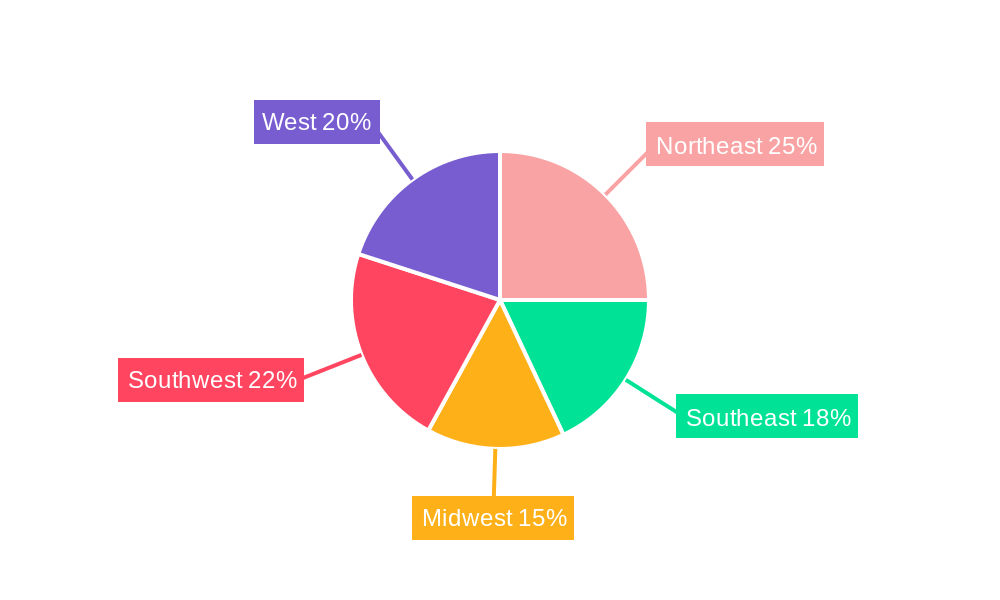
The US EV charging systems market is experiencing robust growth, driven by the increasing adoption of electric vehicles (EVs) and supportive government policies aimed at reducing carbon emissions. The market, valued at approximately $3.88 billion in 2025, is projected to expand significantly over the forecast period (2025-2033), with a compound annual growth rate (CAGR) of 27.65%. This substantial growth is fueled by several key factors. Firstly, the expanding EV fleet necessitates a parallel increase in charging infrastructure. Secondly, technological advancements are leading to more efficient and faster charging solutions, including the proliferation of rapid charging stations catering to the needs of long-distance travel. Furthermore, government incentives, such as tax credits and subsidies for both EV purchases and charging station installations, are accelerating market expansion. The market is segmented by application type (public, private residential, and private commercial), equipment type (pillar/charging station/dock, inverter, charger, DC charger, and other accessories), vehicle type (passenger cars and commercial vehicles), and charging system type (slow, fast, and rapid charging systems). Competition is intense, with established players like ChargePoint, Blink Charging, and Tesla alongside emerging companies vying for market share. Geographic variations exist within the US, with regions like the Northeast and West Coast potentially showing higher adoption rates due to existing EV infrastructure and environmentally conscious consumer bases. Challenges remain, however, including the high initial investment costs associated with installing charging infrastructure, the need for grid modernization to support the increased electricity demand, and the varying levels of charging infrastructure across different states.
The continued expansion of the US EV charging systems market is anticipated to be influenced by several factors in the coming years. The increasing affordability of EVs and the growing range of models available will further drive demand for charging solutions. Moreover, technological innovation, such as the development of wireless charging and vehicle-to-grid (V2G) technology, is poised to revolutionize the EV charging landscape. However, concerns regarding charging infrastructure availability and reliability, especially in rural areas, need to be addressed to ensure equitable access. Furthermore, the market will likely witness increasing focus on smart charging solutions to optimize energy consumption and grid stability. The integration of renewable energy sources into the charging infrastructure will be crucial in minimizing the environmental impact of EV charging. The ongoing development of standardized charging protocols and interoperability between different charging networks will also play a significant role in shaping the future of the market. Overall, the outlook for the US EV charging systems market remains positive, with considerable opportunities for growth and innovation.
US EV Charging Systems Market: A Comprehensive Report (2019-2033)
This in-depth report provides a comprehensive analysis of the US EV charging systems market, offering invaluable insights for industry professionals, investors, and stakeholders. Covering the period 2019-2033, with a focus on 2025, this report meticulously examines market dynamics, growth drivers, challenges, and future opportunities. The market is segmented by application type, equipment type, vehicle type, and charging system type, providing granular data for strategic decision-making. Projected market values are presented in Millions of USD.
US EV Charging Systems Market Structure & Innovation Trends
The US EV charging systems market is characterized by a moderately concentrated structure, with key players like ChargePoint Inc, Blink Charging Co, and Tesla Inc holding significant market share. However, the market also features a number of smaller, innovative companies such as Wallbox and EVBox Group, contributing to a dynamic competitive landscape. Innovation is driven by advancements in charging technologies (e.g., faster charging speeds, smart charging capabilities), government initiatives promoting EV adoption, and increasing consumer demand for convenient and reliable charging solutions. Regulatory frameworks, such as the National Electric Vehicle Infrastructure (NEVI) program, significantly influence market growth and infrastructure development. Product substitutes, such as gasoline-powered vehicles, are facing declining market share due to increasing environmental concerns and government incentives for EV adoption. End-user demographics are shifting towards a younger, environmentally conscious consumer base, driving demand for accessible and user-friendly charging solutions.
- Market Concentration: Moderately concentrated, with key players holding significant, but not dominant, shares. ChargePoint Inc. estimated at xx% market share in 2025.
- Innovation Drivers: Advancements in charging technologies, government incentives, and consumer demand for convenient charging.
- Regulatory Framework: NEVI program and other state-level initiatives significantly shape market development.
- M&A Activity: Moderate level of M&A activity, with deal values estimated at xx Million USD annually in the forecast period. Deals focus on expanding geographic reach and enhancing technological capabilities.
US EV Charging Systems Market Dynamics & Trends
The US EV charging systems market is experiencing robust growth, fueled by increasing EV adoption rates, supportive government policies, and advancements in charging technologies. The market is projected to witness a CAGR of xx% during the forecast period (2025-2033). Technological disruptions, such as the development of faster charging systems and smart grid integration, are enhancing the efficiency and convenience of EV charging. Consumer preferences are shifting towards faster charging speeds, increased reliability, and convenient locations. Competitive dynamics are characterized by intense competition among established players and the emergence of new entrants, fostering innovation and driving down prices. Market penetration of EV charging stations is rapidly increasing, particularly in urban areas and along major transportation corridors. By 2033, market penetration is projected to reach xx%.
Dominant Regions & Segments in US EV Charging Systems Market
The California and the Northeastern US regions are currently dominating the US EV charging systems market. This dominance is primarily driven by strong government support for EV adoption, higher EV ownership rates, and the presence of well-established charging infrastructure. Within segments:
- By Application Type: The Public segment is currently the largest, driven by government initiatives and the need for widespread public charging availability. The Private (Residential and Commercial) segment is showing strong growth, propelled by increasing EV ownership and the installation of home and workplace charging stations.
- By Equipment Type: Pillar/Charging Station/Dock segment dominates, but DC Charger segment demonstrates significant growth potential due to faster charging capabilities.
- By Vehicle Type: The Passenger Cars segment currently holds the largest market share, but the Commercial Vehicles segment is expected to exhibit high growth in the coming years, driven by increasing fleet electrification.
- By Charging System Type: Fast and Rapid charging systems are gaining traction, driven by consumer demand for quicker charging times.
Key Drivers:
- Strong government support, including financial incentives and infrastructure development programs.
- Growing EV adoption rates driven by environmental concerns and falling battery prices.
- Expanding charging infrastructure networks.
- Technological advancements in charging technology.
US EV Charging Systems Market Product Innovations
Recent product innovations focus on enhanced charging speeds, smart charging capabilities, and improved user experience. Companies are developing advanced charging systems with increased power output, reducing charging times. Smart charging features like remote monitoring, energy management, and payment integration are becoming increasingly common. These innovations aim to address consumer concerns regarding charging speed, convenience, and cost-effectiveness, driving wider EV adoption. For example, Wallbox’s Pulsar Pro and Supernova 180 chargers highlight the trend towards smart and fast-charging solutions.
Report Scope & Segmentation Analysis
This report comprehensively segments the US EV charging systems market across four key aspects:
- By Application Type: Public, Private (Residential and Commercial) – The Public segment is projected to experience substantial growth driven by government initiatives. The Private segment is experiencing significant expansion fueled by increasing EV adoption and home charging installations.
- By Equipment Type: Pillar/Charging Station/Dock, Inverter, Charger, DC Charger, Others (Cord, Port, etc.) - The Pillar/Charging Station/Dock segment dominates, but DC fast chargers are anticipated to witness rapid growth.
- By Vehicle Type: Passenger Cars, Commercial Vehicles - Passenger cars currently drive market demand, but Commercial Vehicles are showing high growth potential.
- By Charging System Type: Slow Charging Systems, Fast Charging Systems, Rapid Charging Systems - Fast and Rapid charging systems are projected to witness the most significant growth due to increasing demand for faster charging times. Each segment's market size, growth projection, and competitive dynamics are thoroughly analyzed within the report.
Key Drivers of US EV Charging Systems Market Growth
The US EV charging systems market is experiencing rapid growth driven by several key factors: increasing EV sales fueled by government incentives, rising environmental concerns, and decreasing battery prices. Government initiatives such as the NEVI program are significantly boosting the development of charging infrastructure. Technological advancements, such as faster charging technologies and smart charging solutions, are improving user experience and promoting wider adoption. Furthermore, the decreasing cost of EV charging infrastructure is making it more accessible to a wider range of consumers and businesses.
Challenges in the US EV Charging Systems Market Sector
The US EV charging systems market faces several challenges. The high initial investment costs for charging infrastructure can hinder widespread deployment, particularly in rural areas. The availability of skilled labor for installation and maintenance of charging systems can be a constraint. Interoperability issues between different charging standards can create user inconvenience. Concerns over grid stability due to increased electricity demand from EV charging are also impacting growth.
Emerging Opportunities in US EV Charging Systems Market
Significant opportunities exist for innovative solutions in the EV charging market. The development of advanced battery technologies enabling faster charging times represents a major opportunity. Integration of renewable energy sources for powering charging stations is another key area. The expanding market for commercial vehicle electrification presents significant growth potential. The development of smart charging management systems that optimize energy use and reduce grid strain is also crucial.
Leading Players in the US EV Charging Systems Market Market
- Wallbox
- ChargePoint Inc
- Blink Charging Co
- Leviton Manufacturing Co Inc
- Webasto SE
- Siemens AG
- Schneider Electric SE
- ABB Group
- Tesla Inc
- EVBox Group
- EvoCharge Inc
- Eaton Corporation
Key Developments in US EV Charging Systems Market Industry
- March 2024: Wallbox announces the delivery of its Pulsar Pro North America smart chargers for residential and commercial use, and launches its Supernova 180 DC fast charger.
- January 2024: The US government announces a USD 623 Million investment to expand EV charging points nationwide, including grants for rapid chargers and hydrogen fuel chargers.
- January 2024: The US Transportation Department announces USD 148.8 Million in funding to replace or repair 4,500 existing EV charging stations across 20 states as part of the USD 5 Billion NEVI program.
Future Outlook for US EV Charging Systems Market Market
The US EV charging systems market is poised for continued robust growth, driven by increasing EV adoption, supportive government policies, and technological advancements. The expansion of charging infrastructure, particularly in rural areas and along major transportation corridors, will be a key driver. The development of smart charging technologies and integration with renewable energy sources will further enhance market growth. Strategic partnerships and collaborations between EV manufacturers, charging infrastructure providers, and energy companies will play a critical role in shaping the future of the market.
US EV Charging Systems Market Segmentation
-
1. Application Type
- 1.1. Public
- 1.2. Private (Residential and Commercial)
-
2. Equipment Type
- 2.1. Pillar/Charging Station/Dock
- 2.2. Inverter
-
2.3. Charger
- 2.3.1. AC Charger
- 2.3.2. DC Charger
- 2.4. Others (Cord, Port, etc.)
-
3. Vehicle Type
- 3.1. Passenger Cars
- 3.2. Commercial Vehicles
-
4. Charging System Type
- 4.1. Slow Charging Systems
- 4.2. Fast Charging Systems
- 4.3. Rapid Charging Systems
US EV Charging Systems Market Segmentation By Geography
-
1. North America
- 1.1. United States
- 1.2. Canada
- 1.3. Mexico
-
2. South America
- 2.1. Brazil
- 2.2. Argentina
- 2.3. Rest of South America
-
3. Europe
- 3.1. United Kingdom
- 3.2. Germany
- 3.3. France
- 3.4. Italy
- 3.5. Spain
- 3.6. Russia
- 3.7. Benelux
- 3.8. Nordics
- 3.9. Rest of Europe
-
4. Middle East & Africa
- 4.1. Turkey
- 4.2. Israel
- 4.3. GCC
- 4.4. North Africa
- 4.5. South Africa
- 4.6. Rest of Middle East & Africa
-
5. Asia Pacific
- 5.1. China
- 5.2. India
- 5.3. Japan
- 5.4. South Korea
- 5.5. ASEAN
- 5.6. Oceania
- 5.7. Rest of Asia Pacific
US EV Charging Systems Market REPORT HIGHLIGHTS
| Aspects | Details |
|---|---|
| Study Period | 2019-2033 |
| Base Year | 2024 |
| Estimated Year | 2025 |
| Forecast Period | 2025-2033 |
| Historical Period | 2019-2024 |
| Growth Rate | CAGR of 27.65% from 2019-2033 |
| Segmentation |
|
Table of Contents
- 1. Introduction
- 1.1. Research Scope
- 1.2. Market Segmentation
- 1.3. Research Methodology
- 1.4. Definitions and Assumptions
- 2. Executive Summary
- 2.1. Introduction
- 3. Market Dynamics
- 3.1. Introduction
- 3.2. Market Drivers
- 3.2.1. Aggressive Government Focus to Promote the Adoption of Electric Vehicles Fosters the Growth of the Market
- 3.3. Market Restrains
- 3.3.1. High Cost of Setting Up EV Charging Stations Hampers the Growth of the Market
- 3.4. Market Trends
- 3.4.1. Passengers Cars Segment to Gain Traction during the Forecast Period
- 4. Market Factor Analysis
- 4.1. Porters Five Forces
- 4.2. Supply/Value Chain
- 4.3. PESTEL analysis
- 4.4. Market Entropy
- 4.5. Patent/Trademark Analysis
- 5. Global US EV Charging Systems Market Analysis, Insights and Forecast, 2019-2031
- 5.1. Market Analysis, Insights and Forecast - by Application Type
- 5.1.1. Public
- 5.1.2. Private (Residential and Commercial)
- 5.2. Market Analysis, Insights and Forecast - by Equipment Type
- 5.2.1. Pillar/Charging Station/Dock
- 5.2.2. Inverter
- 5.2.3. Charger
- 5.2.3.1. AC Charger
- 5.2.3.2. DC Charger
- 5.2.4. Others (Cord, Port, etc.)
- 5.3. Market Analysis, Insights and Forecast - by Vehicle Type
- 5.3.1. Passenger Cars
- 5.3.2. Commercial Vehicles
- 5.4. Market Analysis, Insights and Forecast - by Charging System Type
- 5.4.1. Slow Charging Systems
- 5.4.2. Fast Charging Systems
- 5.4.3. Rapid Charging Systems
- 5.5. Market Analysis, Insights and Forecast - by Region
- 5.5.1. North America
- 5.5.2. South America
- 5.5.3. Europe
- 5.5.4. Middle East & Africa
- 5.5.5. Asia Pacific
- 5.1. Market Analysis, Insights and Forecast - by Application Type
- 6. North America US EV Charging Systems Market Analysis, Insights and Forecast, 2019-2031
- 6.1. Market Analysis, Insights and Forecast - by Application Type
- 6.1.1. Public
- 6.1.2. Private (Residential and Commercial)
- 6.2. Market Analysis, Insights and Forecast - by Equipment Type
- 6.2.1. Pillar/Charging Station/Dock
- 6.2.2. Inverter
- 6.2.3. Charger
- 6.2.3.1. AC Charger
- 6.2.3.2. DC Charger
- 6.2.4. Others (Cord, Port, etc.)
- 6.3. Market Analysis, Insights and Forecast - by Vehicle Type
- 6.3.1. Passenger Cars
- 6.3.2. Commercial Vehicles
- 6.4. Market Analysis, Insights and Forecast - by Charging System Type
- 6.4.1. Slow Charging Systems
- 6.4.2. Fast Charging Systems
- 6.4.3. Rapid Charging Systems
- 6.1. Market Analysis, Insights and Forecast - by Application Type
- 7. South America US EV Charging Systems Market Analysis, Insights and Forecast, 2019-2031
- 7.1. Market Analysis, Insights and Forecast - by Application Type
- 7.1.1. Public
- 7.1.2. Private (Residential and Commercial)
- 7.2. Market Analysis, Insights and Forecast - by Equipment Type
- 7.2.1. Pillar/Charging Station/Dock
- 7.2.2. Inverter
- 7.2.3. Charger
- 7.2.3.1. AC Charger
- 7.2.3.2. DC Charger
- 7.2.4. Others (Cord, Port, etc.)
- 7.3. Market Analysis, Insights and Forecast - by Vehicle Type
- 7.3.1. Passenger Cars
- 7.3.2. Commercial Vehicles
- 7.4. Market Analysis, Insights and Forecast - by Charging System Type
- 7.4.1. Slow Charging Systems
- 7.4.2. Fast Charging Systems
- 7.4.3. Rapid Charging Systems
- 7.1. Market Analysis, Insights and Forecast - by Application Type
- 8. Europe US EV Charging Systems Market Analysis, Insights and Forecast, 2019-2031
- 8.1. Market Analysis, Insights and Forecast - by Application Type
- 8.1.1. Public
- 8.1.2. Private (Residential and Commercial)
- 8.2. Market Analysis, Insights and Forecast - by Equipment Type
- 8.2.1. Pillar/Charging Station/Dock
- 8.2.2. Inverter
- 8.2.3. Charger
- 8.2.3.1. AC Charger
- 8.2.3.2. DC Charger
- 8.2.4. Others (Cord, Port, etc.)
- 8.3. Market Analysis, Insights and Forecast - by Vehicle Type
- 8.3.1. Passenger Cars
- 8.3.2. Commercial Vehicles
- 8.4. Market Analysis, Insights and Forecast - by Charging System Type
- 8.4.1. Slow Charging Systems
- 8.4.2. Fast Charging Systems
- 8.4.3. Rapid Charging Systems
- 8.1. Market Analysis, Insights and Forecast - by Application Type
- 9. Middle East & Africa US EV Charging Systems Market Analysis, Insights and Forecast, 2019-2031
- 9.1. Market Analysis, Insights and Forecast - by Application Type
- 9.1.1. Public
- 9.1.2. Private (Residential and Commercial)
- 9.2. Market Analysis, Insights and Forecast - by Equipment Type
- 9.2.1. Pillar/Charging Station/Dock
- 9.2.2. Inverter
- 9.2.3. Charger
- 9.2.3.1. AC Charger
- 9.2.3.2. DC Charger
- 9.2.4. Others (Cord, Port, etc.)
- 9.3. Market Analysis, Insights and Forecast - by Vehicle Type
- 9.3.1. Passenger Cars
- 9.3.2. Commercial Vehicles
- 9.4. Market Analysis, Insights and Forecast - by Charging System Type
- 9.4.1. Slow Charging Systems
- 9.4.2. Fast Charging Systems
- 9.4.3. Rapid Charging Systems
- 9.1. Market Analysis, Insights and Forecast - by Application Type
- 10. Asia Pacific US EV Charging Systems Market Analysis, Insights and Forecast, 2019-2031
- 10.1. Market Analysis, Insights and Forecast - by Application Type
- 10.1.1. Public
- 10.1.2. Private (Residential and Commercial)
- 10.2. Market Analysis, Insights and Forecast - by Equipment Type
- 10.2.1. Pillar/Charging Station/Dock
- 10.2.2. Inverter
- 10.2.3. Charger
- 10.2.3.1. AC Charger
- 10.2.3.2. DC Charger
- 10.2.4. Others (Cord, Port, etc.)
- 10.3. Market Analysis, Insights and Forecast - by Vehicle Type
- 10.3.1. Passenger Cars
- 10.3.2. Commercial Vehicles
- 10.4. Market Analysis, Insights and Forecast - by Charging System Type
- 10.4.1. Slow Charging Systems
- 10.4.2. Fast Charging Systems
- 10.4.3. Rapid Charging Systems
- 10.1. Market Analysis, Insights and Forecast - by Application Type
- 11. Northeast US EV Charging Systems Market Analysis, Insights and Forecast, 2019-2031
- 12. Southeast US EV Charging Systems Market Analysis, Insights and Forecast, 2019-2031
- 13. Midwest US EV Charging Systems Market Analysis, Insights and Forecast, 2019-2031
- 14. Southwest US EV Charging Systems Market Analysis, Insights and Forecast, 2019-2031
- 15. West US EV Charging Systems Market Analysis, Insights and Forecast, 2019-2031
- 16. Competitive Analysis
- 16.1. Global Market Share Analysis 2024
- 16.2. Company Profiles
- 16.2.1 Wallbo
- 16.2.1.1. Overview
- 16.2.1.2. Products
- 16.2.1.3. SWOT Analysis
- 16.2.1.4. Recent Developments
- 16.2.1.5. Financials (Based on Availability)
- 16.2.2 ChargePoint Inc
- 16.2.2.1. Overview
- 16.2.2.2. Products
- 16.2.2.3. SWOT Analysis
- 16.2.2.4. Recent Developments
- 16.2.2.5. Financials (Based on Availability)
- 16.2.3 Blink Charging Co
- 16.2.3.1. Overview
- 16.2.3.2. Products
- 16.2.3.3. SWOT Analysis
- 16.2.3.4. Recent Developments
- 16.2.3.5. Financials (Based on Availability)
- 16.2.4 Leviton Manufacturing Co Inc
- 16.2.4.1. Overview
- 16.2.4.2. Products
- 16.2.4.3. SWOT Analysis
- 16.2.4.4. Recent Developments
- 16.2.4.5. Financials (Based on Availability)
- 16.2.5 Webasto SE
- 16.2.5.1. Overview
- 16.2.5.2. Products
- 16.2.5.3. SWOT Analysis
- 16.2.5.4. Recent Developments
- 16.2.5.5. Financials (Based on Availability)
- 16.2.6 Siemens AG
- 16.2.6.1. Overview
- 16.2.6.2. Products
- 16.2.6.3. SWOT Analysis
- 16.2.6.4. Recent Developments
- 16.2.6.5. Financials (Based on Availability)
- 16.2.7 Schneider Electric SE
- 16.2.7.1. Overview
- 16.2.7.2. Products
- 16.2.7.3. SWOT Analysis
- 16.2.7.4. Recent Developments
- 16.2.7.5. Financials (Based on Availability)
- 16.2.8 ABB Group
- 16.2.8.1. Overview
- 16.2.8.2. Products
- 16.2.8.3. SWOT Analysis
- 16.2.8.4. Recent Developments
- 16.2.8.5. Financials (Based on Availability)
- 16.2.9 Tesla Inc
- 16.2.9.1. Overview
- 16.2.9.2. Products
- 16.2.9.3. SWOT Analysis
- 16.2.9.4. Recent Developments
- 16.2.9.5. Financials (Based on Availability)
- 16.2.10 EVBox Group
- 16.2.10.1. Overview
- 16.2.10.2. Products
- 16.2.10.3. SWOT Analysis
- 16.2.10.4. Recent Developments
- 16.2.10.5. Financials (Based on Availability)
- 16.2.11 EvoCharge Inc
- 16.2.11.1. Overview
- 16.2.11.2. Products
- 16.2.11.3. SWOT Analysis
- 16.2.11.4. Recent Developments
- 16.2.11.5. Financials (Based on Availability)
- 16.2.12 Eaton Corporation
- 16.2.12.1. Overview
- 16.2.12.2. Products
- 16.2.12.3. SWOT Analysis
- 16.2.12.4. Recent Developments
- 16.2.12.5. Financials (Based on Availability)
- 16.2.1 Wallbo
List of Figures
- Figure 1: Global US EV Charging Systems Market Revenue Breakdown (Million, %) by Region 2024 & 2032
- Figure 2: United states US EV Charging Systems Market Revenue (Million), by Country 2024 & 2032
- Figure 3: United states US EV Charging Systems Market Revenue Share (%), by Country 2024 & 2032
- Figure 4: North America US EV Charging Systems Market Revenue (Million), by Application Type 2024 & 2032
- Figure 5: North America US EV Charging Systems Market Revenue Share (%), by Application Type 2024 & 2032
- Figure 6: North America US EV Charging Systems Market Revenue (Million), by Equipment Type 2024 & 2032
- Figure 7: North America US EV Charging Systems Market Revenue Share (%), by Equipment Type 2024 & 2032
- Figure 8: North America US EV Charging Systems Market Revenue (Million), by Vehicle Type 2024 & 2032
- Figure 9: North America US EV Charging Systems Market Revenue Share (%), by Vehicle Type 2024 & 2032
- Figure 10: North America US EV Charging Systems Market Revenue (Million), by Charging System Type 2024 & 2032
- Figure 11: North America US EV Charging Systems Market Revenue Share (%), by Charging System Type 2024 & 2032
- Figure 12: North America US EV Charging Systems Market Revenue (Million), by Country 2024 & 2032
- Figure 13: North America US EV Charging Systems Market Revenue Share (%), by Country 2024 & 2032
- Figure 14: South America US EV Charging Systems Market Revenue (Million), by Application Type 2024 & 2032
- Figure 15: South America US EV Charging Systems Market Revenue Share (%), by Application Type 2024 & 2032
- Figure 16: South America US EV Charging Systems Market Revenue (Million), by Equipment Type 2024 & 2032
- Figure 17: South America US EV Charging Systems Market Revenue Share (%), by Equipment Type 2024 & 2032
- Figure 18: South America US EV Charging Systems Market Revenue (Million), by Vehicle Type 2024 & 2032
- Figure 19: South America US EV Charging Systems Market Revenue Share (%), by Vehicle Type 2024 & 2032
- Figure 20: South America US EV Charging Systems Market Revenue (Million), by Charging System Type 2024 & 2032
- Figure 21: South America US EV Charging Systems Market Revenue Share (%), by Charging System Type 2024 & 2032
- Figure 22: South America US EV Charging Systems Market Revenue (Million), by Country 2024 & 2032
- Figure 23: South America US EV Charging Systems Market Revenue Share (%), by Country 2024 & 2032
- Figure 24: Europe US EV Charging Systems Market Revenue (Million), by Application Type 2024 & 2032
- Figure 25: Europe US EV Charging Systems Market Revenue Share (%), by Application Type 2024 & 2032
- Figure 26: Europe US EV Charging Systems Market Revenue (Million), by Equipment Type 2024 & 2032
- Figure 27: Europe US EV Charging Systems Market Revenue Share (%), by Equipment Type 2024 & 2032
- Figure 28: Europe US EV Charging Systems Market Revenue (Million), by Vehicle Type 2024 & 2032
- Figure 29: Europe US EV Charging Systems Market Revenue Share (%), by Vehicle Type 2024 & 2032
- Figure 30: Europe US EV Charging Systems Market Revenue (Million), by Charging System Type 2024 & 2032
- Figure 31: Europe US EV Charging Systems Market Revenue Share (%), by Charging System Type 2024 & 2032
- Figure 32: Europe US EV Charging Systems Market Revenue (Million), by Country 2024 & 2032
- Figure 33: Europe US EV Charging Systems Market Revenue Share (%), by Country 2024 & 2032
- Figure 34: Middle East & Africa US EV Charging Systems Market Revenue (Million), by Application Type 2024 & 2032
- Figure 35: Middle East & Africa US EV Charging Systems Market Revenue Share (%), by Application Type 2024 & 2032
- Figure 36: Middle East & Africa US EV Charging Systems Market Revenue (Million), by Equipment Type 2024 & 2032
- Figure 37: Middle East & Africa US EV Charging Systems Market Revenue Share (%), by Equipment Type 2024 & 2032
- Figure 38: Middle East & Africa US EV Charging Systems Market Revenue (Million), by Vehicle Type 2024 & 2032
- Figure 39: Middle East & Africa US EV Charging Systems Market Revenue Share (%), by Vehicle Type 2024 & 2032
- Figure 40: Middle East & Africa US EV Charging Systems Market Revenue (Million), by Charging System Type 2024 & 2032
- Figure 41: Middle East & Africa US EV Charging Systems Market Revenue Share (%), by Charging System Type 2024 & 2032
- Figure 42: Middle East & Africa US EV Charging Systems Market Revenue (Million), by Country 2024 & 2032
- Figure 43: Middle East & Africa US EV Charging Systems Market Revenue Share (%), by Country 2024 & 2032
- Figure 44: Asia Pacific US EV Charging Systems Market Revenue (Million), by Application Type 2024 & 2032
- Figure 45: Asia Pacific US EV Charging Systems Market Revenue Share (%), by Application Type 2024 & 2032
- Figure 46: Asia Pacific US EV Charging Systems Market Revenue (Million), by Equipment Type 2024 & 2032
- Figure 47: Asia Pacific US EV Charging Systems Market Revenue Share (%), by Equipment Type 2024 & 2032
- Figure 48: Asia Pacific US EV Charging Systems Market Revenue (Million), by Vehicle Type 2024 & 2032
- Figure 49: Asia Pacific US EV Charging Systems Market Revenue Share (%), by Vehicle Type 2024 & 2032
- Figure 50: Asia Pacific US EV Charging Systems Market Revenue (Million), by Charging System Type 2024 & 2032
- Figure 51: Asia Pacific US EV Charging Systems Market Revenue Share (%), by Charging System Type 2024 & 2032
- Figure 52: Asia Pacific US EV Charging Systems Market Revenue (Million), by Country 2024 & 2032
- Figure 53: Asia Pacific US EV Charging Systems Market Revenue Share (%), by Country 2024 & 2032
List of Tables
- Table 1: Global US EV Charging Systems Market Revenue Million Forecast, by Region 2019 & 2032
- Table 2: Global US EV Charging Systems Market Revenue Million Forecast, by Application Type 2019 & 2032
- Table 3: Global US EV Charging Systems Market Revenue Million Forecast, by Equipment Type 2019 & 2032
- Table 4: Global US EV Charging Systems Market Revenue Million Forecast, by Vehicle Type 2019 & 2032
- Table 5: Global US EV Charging Systems Market Revenue Million Forecast, by Charging System Type 2019 & 2032
- Table 6: Global US EV Charging Systems Market Revenue Million Forecast, by Region 2019 & 2032
- Table 7: Global US EV Charging Systems Market Revenue Million Forecast, by Country 2019 & 2032
- Table 8: Northeast US EV Charging Systems Market Revenue (Million) Forecast, by Application 2019 & 2032
- Table 9: Southeast US EV Charging Systems Market Revenue (Million) Forecast, by Application 2019 & 2032
- Table 10: Midwest US EV Charging Systems Market Revenue (Million) Forecast, by Application 2019 & 2032
- Table 11: Southwest US EV Charging Systems Market Revenue (Million) Forecast, by Application 2019 & 2032
- Table 12: West US EV Charging Systems Market Revenue (Million) Forecast, by Application 2019 & 2032
- Table 13: Global US EV Charging Systems Market Revenue Million Forecast, by Application Type 2019 & 2032
- Table 14: Global US EV Charging Systems Market Revenue Million Forecast, by Equipment Type 2019 & 2032
- Table 15: Global US EV Charging Systems Market Revenue Million Forecast, by Vehicle Type 2019 & 2032
- Table 16: Global US EV Charging Systems Market Revenue Million Forecast, by Charging System Type 2019 & 2032
- Table 17: Global US EV Charging Systems Market Revenue Million Forecast, by Country 2019 & 2032
- Table 18: United States US EV Charging Systems Market Revenue (Million) Forecast, by Application 2019 & 2032
- Table 19: Canada US EV Charging Systems Market Revenue (Million) Forecast, by Application 2019 & 2032
- Table 20: Mexico US EV Charging Systems Market Revenue (Million) Forecast, by Application 2019 & 2032
- Table 21: Global US EV Charging Systems Market Revenue Million Forecast, by Application Type 2019 & 2032
- Table 22: Global US EV Charging Systems Market Revenue Million Forecast, by Equipment Type 2019 & 2032
- Table 23: Global US EV Charging Systems Market Revenue Million Forecast, by Vehicle Type 2019 & 2032
- Table 24: Global US EV Charging Systems Market Revenue Million Forecast, by Charging System Type 2019 & 2032
- Table 25: Global US EV Charging Systems Market Revenue Million Forecast, by Country 2019 & 2032
- Table 26: Brazil US EV Charging Systems Market Revenue (Million) Forecast, by Application 2019 & 2032
- Table 27: Argentina US EV Charging Systems Market Revenue (Million) Forecast, by Application 2019 & 2032
- Table 28: Rest of South America US EV Charging Systems Market Revenue (Million) Forecast, by Application 2019 & 2032
- Table 29: Global US EV Charging Systems Market Revenue Million Forecast, by Application Type 2019 & 2032
- Table 30: Global US EV Charging Systems Market Revenue Million Forecast, by Equipment Type 2019 & 2032
- Table 31: Global US EV Charging Systems Market Revenue Million Forecast, by Vehicle Type 2019 & 2032
- Table 32: Global US EV Charging Systems Market Revenue Million Forecast, by Charging System Type 2019 & 2032
- Table 33: Global US EV Charging Systems Market Revenue Million Forecast, by Country 2019 & 2032
- Table 34: United Kingdom US EV Charging Systems Market Revenue (Million) Forecast, by Application 2019 & 2032
- Table 35: Germany US EV Charging Systems Market Revenue (Million) Forecast, by Application 2019 & 2032
- Table 36: France US EV Charging Systems Market Revenue (Million) Forecast, by Application 2019 & 2032
- Table 37: Italy US EV Charging Systems Market Revenue (Million) Forecast, by Application 2019 & 2032
- Table 38: Spain US EV Charging Systems Market Revenue (Million) Forecast, by Application 2019 & 2032
- Table 39: Russia US EV Charging Systems Market Revenue (Million) Forecast, by Application 2019 & 2032
- Table 40: Benelux US EV Charging Systems Market Revenue (Million) Forecast, by Application 2019 & 2032
- Table 41: Nordics US EV Charging Systems Market Revenue (Million) Forecast, by Application 2019 & 2032
- Table 42: Rest of Europe US EV Charging Systems Market Revenue (Million) Forecast, by Application 2019 & 2032
- Table 43: Global US EV Charging Systems Market Revenue Million Forecast, by Application Type 2019 & 2032
- Table 44: Global US EV Charging Systems Market Revenue Million Forecast, by Equipment Type 2019 & 2032
- Table 45: Global US EV Charging Systems Market Revenue Million Forecast, by Vehicle Type 2019 & 2032
- Table 46: Global US EV Charging Systems Market Revenue Million Forecast, by Charging System Type 2019 & 2032
- Table 47: Global US EV Charging Systems Market Revenue Million Forecast, by Country 2019 & 2032
- Table 48: Turkey US EV Charging Systems Market Revenue (Million) Forecast, by Application 2019 & 2032
- Table 49: Israel US EV Charging Systems Market Revenue (Million) Forecast, by Application 2019 & 2032
- Table 50: GCC US EV Charging Systems Market Revenue (Million) Forecast, by Application 2019 & 2032
- Table 51: North Africa US EV Charging Systems Market Revenue (Million) Forecast, by Application 2019 & 2032
- Table 52: South Africa US EV Charging Systems Market Revenue (Million) Forecast, by Application 2019 & 2032
- Table 53: Rest of Middle East & Africa US EV Charging Systems Market Revenue (Million) Forecast, by Application 2019 & 2032
- Table 54: Global US EV Charging Systems Market Revenue Million Forecast, by Application Type 2019 & 2032
- Table 55: Global US EV Charging Systems Market Revenue Million Forecast, by Equipment Type 2019 & 2032
- Table 56: Global US EV Charging Systems Market Revenue Million Forecast, by Vehicle Type 2019 & 2032
- Table 57: Global US EV Charging Systems Market Revenue Million Forecast, by Charging System Type 2019 & 2032
- Table 58: Global US EV Charging Systems Market Revenue Million Forecast, by Country 2019 & 2032
- Table 59: China US EV Charging Systems Market Revenue (Million) Forecast, by Application 2019 & 2032
- Table 60: India US EV Charging Systems Market Revenue (Million) Forecast, by Application 2019 & 2032
- Table 61: Japan US EV Charging Systems Market Revenue (Million) Forecast, by Application 2019 & 2032
- Table 62: South Korea US EV Charging Systems Market Revenue (Million) Forecast, by Application 2019 & 2032
- Table 63: ASEAN US EV Charging Systems Market Revenue (Million) Forecast, by Application 2019 & 2032
- Table 64: Oceania US EV Charging Systems Market Revenue (Million) Forecast, by Application 2019 & 2032
- Table 65: Rest of Asia Pacific US EV Charging Systems Market Revenue (Million) Forecast, by Application 2019 & 2032
Frequently Asked Questions
1. What is the projected Compound Annual Growth Rate (CAGR) of the US EV Charging Systems Market?
The projected CAGR is approximately 27.65%.
2. Which companies are prominent players in the US EV Charging Systems Market?
Key companies in the market include Wallbo, ChargePoint Inc, Blink Charging Co, Leviton Manufacturing Co Inc, Webasto SE, Siemens AG, Schneider Electric SE, ABB Group, Tesla Inc, EVBox Group, EvoCharge Inc, Eaton Corporation.
3. What are the main segments of the US EV Charging Systems Market?
The market segments include Application Type, Equipment Type, Vehicle Type, Charging System Type.
4. Can you provide details about the market size?
The market size is estimated to be USD 3.88 Million as of 2022.
5. What are some drivers contributing to market growth?
Aggressive Government Focus to Promote the Adoption of Electric Vehicles Fosters the Growth of the Market.
6. What are the notable trends driving market growth?
Passengers Cars Segment to Gain Traction during the Forecast Period.
7. Are there any restraints impacting market growth?
High Cost of Setting Up EV Charging Stations Hampers the Growth of the Market.
8. Can you provide examples of recent developments in the market?
In March 2024, Wallbox announced the delivery of its smart chargers, Pulsar Pro North America, designed specifically for residential and commercial properties, which will be available to customers from the United States. Apart from the latest innovation, Wallbox also launched Supernova 180, its DC-fast EV charger, to assist in improving the state of the fast charging ecosystem in the United States.
9. What pricing options are available for accessing the report?
Pricing options include single-user, multi-user, and enterprise licenses priced at USD 3800, USD 4500, and USD 5800 respectively.
10. Is the market size provided in terms of value or volume?
The market size is provided in terms of value, measured in Million.
11. Are there any specific market keywords associated with the report?
Yes, the market keyword associated with the report is "US EV Charging Systems Market," which aids in identifying and referencing the specific market segment covered.
12. How do I determine which pricing option suits my needs best?
The pricing options vary based on user requirements and access needs. Individual users may opt for single-user licenses, while businesses requiring broader access may choose multi-user or enterprise licenses for cost-effective access to the report.
13. Are there any additional resources or data provided in the US EV Charging Systems Market report?
While the report offers comprehensive insights, it's advisable to review the specific contents or supplementary materials provided to ascertain if additional resources or data are available.
14. How can I stay updated on further developments or reports in the US EV Charging Systems Market?
To stay informed about further developments, trends, and reports in the US EV Charging Systems Market, consider subscribing to industry newsletters, following relevant companies and organizations, or regularly checking reputable industry news sources and publications.
Methodology
Step 1 - Identification of Relevant Samples Size from Population Database


Step 2 - Approaches for Defining Global Market Size (Value, Volume* & Price*)

Note*: In applicable scenarios
Step 3 - Data Sources
Primary Research
- Web Analytics
- Survey Reports
- Research Institute
- Latest Research Reports
- Opinion Leaders
Secondary Research
- Annual Reports
- White Paper
- Latest Press Release
- Industry Association
- Paid Database
- Investor Presentations

Step 4 - Data Triangulation
Involves using different sources of information in order to increase the validity of a study
These sources are likely to be stakeholders in a program - participants, other researchers, program staff, other community members, and so on.
Then we put all data in single framework & apply various statistical tools to find out the dynamic on the market.
During the analysis stage, feedback from the stakeholder groups would be compared to determine areas of agreement as well as areas of divergence


