
Key Insights
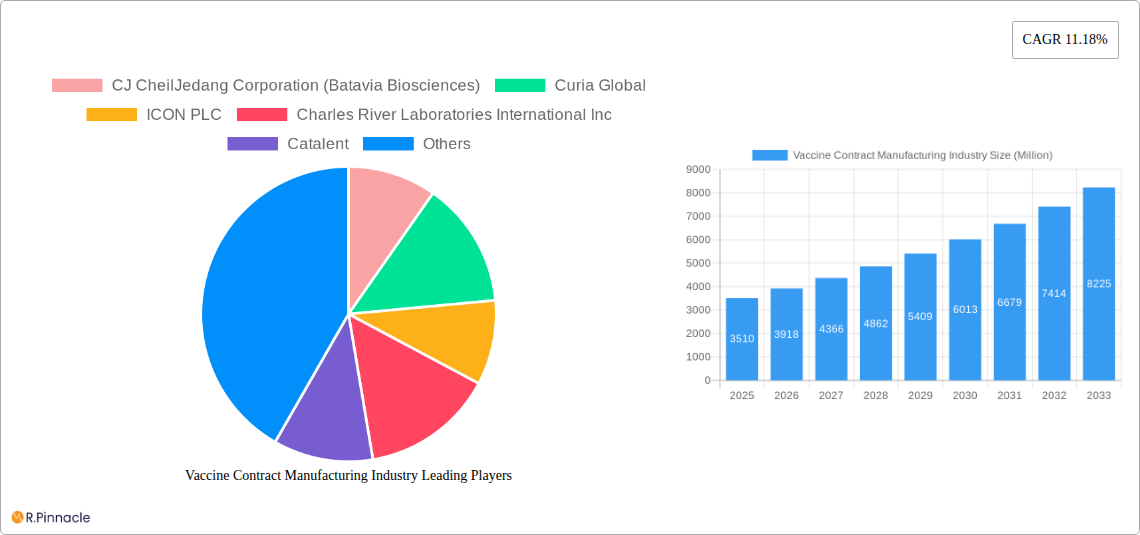
The global vaccine contract manufacturing market, valued at $3.51 billion in 2025, is projected to experience robust growth, driven by increasing demand for vaccines across various therapeutic areas and a rising prevalence of infectious diseases. The Compound Annual Growth Rate (CAGR) of 11.18% from 2025 to 2033 indicates a significant expansion of this market over the forecast period. This growth is fueled by several key factors, including the ongoing need for advanced vaccine technologies like mRNA and other novel platforms, the outsourcing trend among pharmaceutical companies seeking to optimize production efficiency and reduce capital expenditure, and the growing emphasis on pandemic preparedness and rapid vaccine development. The market segmentation reveals significant opportunities across different vaccine types (inactivated, live-attenuated, RNA, subunit, toxoid-based), end-use applications (human and veterinary), and stages of operation (preclinical, clinical, commercial). While challenges such as stringent regulatory requirements and the complexities of handling biologics exist, the market's overall trajectory suggests substantial growth potential.
The market's regional distribution showcases North America and Europe as leading regions due to well-established manufacturing infrastructure and robust regulatory frameworks. However, the Asia-Pacific region is expected to witness rapid growth, driven by increasing healthcare expenditure and a growing prevalence of infectious diseases within these emerging markets. The competitive landscape includes a mix of large multinational contract manufacturing organizations (CMOs) and specialized smaller players, each bringing unique strengths and expertise. This dynamic environment is likely to promote innovation and accelerate the development of advanced vaccine manufacturing processes, ultimately contributing to the market's continued expansion. The presence of companies like Lonza, Catalent, and Charles River Laboratories highlights the consolidation and expertise within this sector. Growth in downstream processes is expected to be significant as companies seek to outsource complex, late-stage manufacturing processes.
This in-depth report provides a comprehensive analysis of the Vaccine Contract Manufacturing industry, offering valuable insights for industry professionals, investors, and stakeholders. The report covers the period 2019-2033, with a focus on the 2025-2033 forecast period, leveraging extensive market research and data analysis. The market is segmented by end-use (Human Use, Veterinary), vaccine type (Inactivated, Live-attenuated, RNA, Subunit, Toxoid-based), process (Upstream, Downstream), and scale of operations (Preclinical, Clinical, Commercial). Key players such as CJ CheilJedang Corporation (Batavia Biosciences), Curia Global, ICON PLC, Charles River Laboratories International Inc, Catalent, IDT Biologika GmbH, Lonza Group AG, Gedeon Richter (Richter-Helm BioLogics), Ajinomoto Bio-Pharma Services, Recipharm AB, Emergent BioSolutions Inc, and Fujifilm Holdings Corporation are analyzed in detail. The total market size in 2025 is estimated at $XX Million, exhibiting a CAGR of XX% during the forecast period.
Vaccine Contract Manufacturing Industry Market Structure & Innovation Trends
The Vaccine Contract Manufacturing industry exhibits a moderately concentrated market structure, with a few large players holding significant market share. However, the presence of numerous smaller, specialized contract manufacturers ensures a competitive landscape. Innovation is driven by advancements in vaccine technologies (mRNA, viral vector), increasing demand for personalized vaccines, and stringent regulatory requirements. Market share is dynamic, with acquisitions and mergers impacting the overall structure. Key drivers include:
- Technological Advancements: Development of novel vaccine platforms and manufacturing processes significantly influences market dynamics.
- Regulatory Landscape: Stringent regulatory approvals and quality control standards shape industry practices.
- Mergers & Acquisitions (M&A): Consolidation through M&A activities reshapes market share and influences pricing strategies. The total value of M&A deals in the historical period (2019-2024) reached approximately $XX Million. Specific deal values are not publicly available for all transactions.
- Product Substitutes: The presence of alternative therapeutic approaches poses a competitive challenge to the vaccine market.
- End-User Demographics: The global population growth and changing disease patterns drive demand for vaccines.
The report further analyzes the impact of various regulatory frameworks and evolving end-user demographics on market competition and innovation.

Vaccine Contract Manufacturing Industry Market Dynamics & Trends
The Vaccine Contract Manufacturing market is experiencing robust growth, driven by several factors. The increasing prevalence of infectious diseases, growing demand for preventative healthcare, and continuous technological advancements fuel market expansion. Technological disruptions, such as the development of mRNA vaccines, have significantly impacted manufacturing processes and capabilities. Consumer preferences are shifting toward personalized and more effective vaccines. Competitive dynamics are characterized by intense rivalry among established players and the emergence of new entrants. Specific market growth drivers include:
- Rising Prevalence of Infectious Diseases: This leads to increased demand for vaccines across various segments.
- Technological Advancements in Vaccine Production: This results in improved vaccine efficacy and cost-effectiveness.
- Government Initiatives and Funding: Significant investments in vaccine research and development further drive market expansion.
- Growing Awareness of Preventative Healthcare: This increases consumer demand for vaccines.
- Expansion into Emerging Markets: The untapped potential in developing countries presents significant opportunities for growth.
The report projects a strong CAGR of XX% during the forecast period (2025-2033), with the market expected to reach $XX Million by 2033. Market penetration is expected to increase significantly across all segments, particularly in developing economies.
Dominant Regions & Segments in Vaccine Contract Manufacturing Industry
The North American region dominates the Vaccine Contract Manufacturing market due to strong investments in R&D, advanced infrastructure, and a well-established regulatory framework. Europe also holds a significant market share, benefiting from its robust pharmaceutical industry. Within segments, the human use segment holds the largest market share, followed by the veterinary segment. RNA vaccines are experiencing rapid growth due to technological advancements and success in addressing emerging infectious diseases. Downstream processing accounts for a larger share of the market compared to upstream processing. Commercial-scale operations dominate the market, reflecting the high demand for large-volume vaccine production.
- Key Drivers for North America: Strong R&D investments, advanced infrastructure, and established regulatory frameworks.
- Key Drivers for Europe: Robust pharmaceutical industry and presence of major contract manufacturers.
- Key Drivers for Human Use Segment: Increased prevalence of infectious diseases and growing demand for vaccines.
- Key Drivers for RNA Vaccines Segment: Technological advancements and successful applications in pandemic response.
- Key Drivers for Downstream Processing Segment: High demand for vaccine purification and formulation.
- Key Drivers for Commercial-scale Operations: The need for large-volume vaccine manufacturing to meet market demands.
Vaccine Contract Manufacturing Industry Product Innovations
The Vaccine Contract Manufacturing industry is witnessing rapid product innovation, driven by advancements in vaccine technologies and manufacturing processes. The development of mRNA vaccines and other novel platforms has revolutionized vaccine production, leading to improved efficacy and faster development timelines. New applications of existing vaccines, such as the development of multivalent vaccines and combination products, expand market reach and address unmet medical needs. The key competitive advantage lies in achieving higher efficiency, reduced production costs, and enhanced product quality. These innovations cater to market needs for more effective and accessible vaccines.
Report Scope & Segmentation Analysis
This report comprehensively analyzes the Vaccine Contract Manufacturing market based on several key segmentations:
- End Use: Human Use (projected market size $XX Million in 2025), Veterinary ($XX Million in 2025)
- Vaccine Type: Inactivated Vaccines ($XX Million in 2025), Live-attenuated Vaccines ($XX Million in 2025), RNA Vaccines ($XX Million in 2025), Subunit Vaccines ($XX Million in 2025), Toxoid-based Vaccines ($XX Million in 2025). Each segment exhibits varying growth rates and competitive dynamics.
- Process: Upstream ($XX Million in 2025), Downstream ($XX Million in 2025). These processes contribute differently to the overall manufacturing cost and timeline.
- Scale of Operations: Preclinical ($XX Million in 2025), Clinical ($XX Million in 2025), Commercial ($XX Million in 2025). Each stage of operations faces unique challenges and opportunities.
Market sizes for each segment are projected for 2025 and beyond, offering valuable insights for strategic planning.
Key Drivers of Vaccine Contract Manufacturing Industry Growth
Several key factors drive the growth of the Vaccine Contract Manufacturing industry. Technological advancements, such as mRNA and viral vector vaccines, lead to improved efficacy and faster production. The increasing prevalence of infectious diseases necessitates higher vaccine production capacity. Favorable government policies and funding for vaccine development and manufacturing further stimulate market growth. Furthermore, the rising global population and increasing awareness of preventative healthcare fuel the demand for vaccines.
Challenges in the Vaccine Contract Manufacturing Industry Sector
The Vaccine Contract Manufacturing industry faces several challenges. Stringent regulatory approvals and quality control measures increase development costs and time-to-market. Supply chain disruptions can significantly impact production capacity and vaccine availability. Intense competition among manufacturers and evolving market demands require continuous innovation and adaptation. These hurdles impact the overall profitability and growth trajectory of the sector. For example, supply chain disruptions during the COVID-19 pandemic led to a xx% decrease in production for some companies.
Emerging Opportunities in Vaccine Contract Manufacturing Industry
Several emerging opportunities exist in the Vaccine Contract Manufacturing industry. The development of personalized vaccines and next-generation vaccine platforms opens new avenues for growth. The expansion into emerging markets with high disease burdens presents significant potential. Advancements in process automation and digital technologies improve efficiency and reduce costs. These trends shape the future of the industry and offer lucrative opportunities for innovation and expansion.
Leading Players in the Vaccine Contract Manufacturing Industry Market
- CJ CheilJedang Corporation (Batavia Biosciences)
- Curia Global
- ICON PLC
- Charles River Laboratories International Inc
- Catalent
- IDT Biologika GmbH
- Lonza Group AG
- Gedeon Richter (Richter-Helm BioLogics)
- Ajinomoto Bio-Pharma Services
- Recipharm AB
- Emergent BioSolutions Inc
- Fujifilm Holdings Corporation
Key Developments in Vaccine Contract Manufacturing Industry Industry
- August 2022: Moderna and the Canadian government agreed to build an mRNA vaccine manufacturing facility in Canada, expanding mRNA vaccine production capacity and access.
- June 2022: Merck and Agilent Technologies collaborated to enhance process analytical technologies for downstream processing, improving efficiency and overcoming bottlenecks.
Future Outlook for Vaccine Contract Manufacturing Industry Market
The future of the Vaccine Contract Manufacturing industry is promising, driven by continued technological advancements, growing demand for vaccines, and favorable government support. Emerging markets and disease patterns will continue to shape the industry’s growth trajectory. Strategic partnerships and collaborations among manufacturers and research institutions are crucial to accelerate vaccine development and manufacturing. This dynamic sector is poised for significant expansion and innovation in the coming years.
Vaccine Contract Manufacturing Industry Segmentation
-
1. Vaccine Type
- 1.1. Inactivated Vaccines
- 1.2. Live-attenuated Vaccines
- 1.3. RNA Vaccines
- 1.4. Subunit Vaccines
- 1.5. Toxoid-based Vaccines
-
2. Process
-
2.1. Downstream
- 2.1.1. Analytical and QC Studies
- 2.1.2. Fill and Finish
- 2.1.3. Packaging
- 2.1.4. Other Downstream Processes
-
2.2. Upstream
- 2.2.1. Bacterial Expression Systems
- 2.2.2. Baculovirus/Insect Expression Systems
- 2.2.3. Mammalian Expression Systems
- 2.2.4. Yeast Expression Systems
- 2.2.5. Other Upstream Processes
-
2.1. Downstream
-
3. Scale of Operations
- 3.1. Preclinical
- 3.2. Clinical
- 3.3. Commercial
-
4. End Use
- 4.1. Human Use
- 4.2. Veterinary
Vaccine Contract Manufacturing Industry Segmentation By Geography
-
1. North America
- 1.1. United States
- 1.2. Canada
- 1.3. Mexico
-
2. Europe
- 2.1. Germany
- 2.2. United Kingdom
- 2.3. France
- 2.4. Italy
- 2.5. Spain
- 2.6. Rest of Europe
-
3. Asia Pacific
- 3.1. China
- 3.2. Japan
- 3.3. India
- 3.4. Australia
- 3.5. South Korea
- 3.6. Rest of Asia Pacific
-
4. Middle East and Africa
- 4.1. GCC
- 4.2. South Africa
- 4.3. Rest of Middle East and Africa
-
5. South America
- 5.1. Brazil
- 5.2. Argentina
- 5.3. Rest of South America

Vaccine Contract Manufacturing Industry REPORT HIGHLIGHTS
| Aspects | Details |
|---|---|
| Study Period | 2019-2033 |
| Base Year | 2024 |
| Estimated Year | 2025 |
| Forecast Period | 2025-2033 |
| Historical Period | 2019-2024 |
| Growth Rate | CAGR of 11.18% from 2019-2033 |
| Segmentation |
|
Table of Contents
- 1. Introduction
- 1.1. Research Scope
- 1.2. Market Segmentation
- 1.3. Research Methodology
- 1.4. Definitions and Assumptions
- 2. Executive Summary
- 2.1. Introduction
- 3. Market Dynamics
- 3.1. Introduction
- 3.2. Market Drivers
- 3.2.1. Advancements in Technology and Cost Benefits in Infrastructure and Operational Benefits; Increase in Initiatives Favoring Vaccinations; Favorable Patient Demographics and Growing Vaccinations of Newborns and Children
- 3.3. Market Restrains
- 3.3.1. Rising High Costs of Vaccines; Lack of Storage Infrastructure and Limitations Associated with Supply Chain
- 3.4. Market Trends
- 3.4.1. The Inactivated Vaccines Segment is Expected to Hold a Significant Share in the Vaccine Contract Manufacturing Market over the Forecast Period
- 4. Market Factor Analysis
- 4.1. Porters Five Forces
- 4.2. Supply/Value Chain
- 4.3. PESTEL analysis
- 4.4. Market Entropy
- 4.5. Patent/Trademark Analysis
- 5. Global Vaccine Contract Manufacturing Industry Analysis, Insights and Forecast, 2019-2031
- 5.1. Market Analysis, Insights and Forecast - by Vaccine Type
- 5.1.1. Inactivated Vaccines
- 5.1.2. Live-attenuated Vaccines
- 5.1.3. RNA Vaccines
- 5.1.4. Subunit Vaccines
- 5.1.5. Toxoid-based Vaccines
- 5.2. Market Analysis, Insights and Forecast - by Process
- 5.2.1. Downstream
- 5.2.1.1. Analytical and QC Studies
- 5.2.1.2. Fill and Finish
- 5.2.1.3. Packaging
- 5.2.1.4. Other Downstream Processes
- 5.2.2. Upstream
- 5.2.2.1. Bacterial Expression Systems
- 5.2.2.2. Baculovirus/Insect Expression Systems
- 5.2.2.3. Mammalian Expression Systems
- 5.2.2.4. Yeast Expression Systems
- 5.2.2.5. Other Upstream Processes
- 5.2.1. Downstream
- 5.3. Market Analysis, Insights and Forecast - by Scale of Operations
- 5.3.1. Preclinical
- 5.3.2. Clinical
- 5.3.3. Commercial
- 5.4. Market Analysis, Insights and Forecast - by End Use
- 5.4.1. Human Use
- 5.4.2. Veterinary
- 5.5. Market Analysis, Insights and Forecast - by Region
- 5.5.1. North America
- 5.5.2. Europe
- 5.5.3. Asia Pacific
- 5.5.4. Middle East and Africa
- 5.5.5. South America
- 5.1. Market Analysis, Insights and Forecast - by Vaccine Type
- 6. North America Vaccine Contract Manufacturing Industry Analysis, Insights and Forecast, 2019-2031
- 6.1. Market Analysis, Insights and Forecast - by Vaccine Type
- 6.1.1. Inactivated Vaccines
- 6.1.2. Live-attenuated Vaccines
- 6.1.3. RNA Vaccines
- 6.1.4. Subunit Vaccines
- 6.1.5. Toxoid-based Vaccines
- 6.2. Market Analysis, Insights and Forecast - by Process
- 6.2.1. Downstream
- 6.2.1.1. Analytical and QC Studies
- 6.2.1.2. Fill and Finish
- 6.2.1.3. Packaging
- 6.2.1.4. Other Downstream Processes
- 6.2.2. Upstream
- 6.2.2.1. Bacterial Expression Systems
- 6.2.2.2. Baculovirus/Insect Expression Systems
- 6.2.2.3. Mammalian Expression Systems
- 6.2.2.4. Yeast Expression Systems
- 6.2.2.5. Other Upstream Processes
- 6.2.1. Downstream
- 6.3. Market Analysis, Insights and Forecast - by Scale of Operations
- 6.3.1. Preclinical
- 6.3.2. Clinical
- 6.3.3. Commercial
- 6.4. Market Analysis, Insights and Forecast - by End Use
- 6.4.1. Human Use
- 6.4.2. Veterinary
- 6.1. Market Analysis, Insights and Forecast - by Vaccine Type
- 7. Europe Vaccine Contract Manufacturing Industry Analysis, Insights and Forecast, 2019-2031
- 7.1. Market Analysis, Insights and Forecast - by Vaccine Type
- 7.1.1. Inactivated Vaccines
- 7.1.2. Live-attenuated Vaccines
- 7.1.3. RNA Vaccines
- 7.1.4. Subunit Vaccines
- 7.1.5. Toxoid-based Vaccines
- 7.2. Market Analysis, Insights and Forecast - by Process
- 7.2.1. Downstream
- 7.2.1.1. Analytical and QC Studies
- 7.2.1.2. Fill and Finish
- 7.2.1.3. Packaging
- 7.2.1.4. Other Downstream Processes
- 7.2.2. Upstream
- 7.2.2.1. Bacterial Expression Systems
- 7.2.2.2. Baculovirus/Insect Expression Systems
- 7.2.2.3. Mammalian Expression Systems
- 7.2.2.4. Yeast Expression Systems
- 7.2.2.5. Other Upstream Processes
- 7.2.1. Downstream
- 7.3. Market Analysis, Insights and Forecast - by Scale of Operations
- 7.3.1. Preclinical
- 7.3.2. Clinical
- 7.3.3. Commercial
- 7.4. Market Analysis, Insights and Forecast - by End Use
- 7.4.1. Human Use
- 7.4.2. Veterinary
- 7.1. Market Analysis, Insights and Forecast - by Vaccine Type
- 8. Asia Pacific Vaccine Contract Manufacturing Industry Analysis, Insights and Forecast, 2019-2031
- 8.1. Market Analysis, Insights and Forecast - by Vaccine Type
- 8.1.1. Inactivated Vaccines
- 8.1.2. Live-attenuated Vaccines
- 8.1.3. RNA Vaccines
- 8.1.4. Subunit Vaccines
- 8.1.5. Toxoid-based Vaccines
- 8.2. Market Analysis, Insights and Forecast - by Process
- 8.2.1. Downstream
- 8.2.1.1. Analytical and QC Studies
- 8.2.1.2. Fill and Finish
- 8.2.1.3. Packaging
- 8.2.1.4. Other Downstream Processes
- 8.2.2. Upstream
- 8.2.2.1. Bacterial Expression Systems
- 8.2.2.2. Baculovirus/Insect Expression Systems
- 8.2.2.3. Mammalian Expression Systems
- 8.2.2.4. Yeast Expression Systems
- 8.2.2.5. Other Upstream Processes
- 8.2.1. Downstream
- 8.3. Market Analysis, Insights and Forecast - by Scale of Operations
- 8.3.1. Preclinical
- 8.3.2. Clinical
- 8.3.3. Commercial
- 8.4. Market Analysis, Insights and Forecast - by End Use
- 8.4.1. Human Use
- 8.4.2. Veterinary
- 8.1. Market Analysis, Insights and Forecast - by Vaccine Type
- 9. Middle East and Africa Vaccine Contract Manufacturing Industry Analysis, Insights and Forecast, 2019-2031
- 9.1. Market Analysis, Insights and Forecast - by Vaccine Type
- 9.1.1. Inactivated Vaccines
- 9.1.2. Live-attenuated Vaccines
- 9.1.3. RNA Vaccines
- 9.1.4. Subunit Vaccines
- 9.1.5. Toxoid-based Vaccines
- 9.2. Market Analysis, Insights and Forecast - by Process
- 9.2.1. Downstream
- 9.2.1.1. Analytical and QC Studies
- 9.2.1.2. Fill and Finish
- 9.2.1.3. Packaging
- 9.2.1.4. Other Downstream Processes
- 9.2.2. Upstream
- 9.2.2.1. Bacterial Expression Systems
- 9.2.2.2. Baculovirus/Insect Expression Systems
- 9.2.2.3. Mammalian Expression Systems
- 9.2.2.4. Yeast Expression Systems
- 9.2.2.5. Other Upstream Processes
- 9.2.1. Downstream
- 9.3. Market Analysis, Insights and Forecast - by Scale of Operations
- 9.3.1. Preclinical
- 9.3.2. Clinical
- 9.3.3. Commercial
- 9.4. Market Analysis, Insights and Forecast - by End Use
- 9.4.1. Human Use
- 9.4.2. Veterinary
- 9.1. Market Analysis, Insights and Forecast - by Vaccine Type
- 10. South America Vaccine Contract Manufacturing Industry Analysis, Insights and Forecast, 2019-2031
- 10.1. Market Analysis, Insights and Forecast - by Vaccine Type
- 10.1.1. Inactivated Vaccines
- 10.1.2. Live-attenuated Vaccines
- 10.1.3. RNA Vaccines
- 10.1.4. Subunit Vaccines
- 10.1.5. Toxoid-based Vaccines
- 10.2. Market Analysis, Insights and Forecast - by Process
- 10.2.1. Downstream
- 10.2.1.1. Analytical and QC Studies
- 10.2.1.2. Fill and Finish
- 10.2.1.3. Packaging
- 10.2.1.4. Other Downstream Processes
- 10.2.2. Upstream
- 10.2.2.1. Bacterial Expression Systems
- 10.2.2.2. Baculovirus/Insect Expression Systems
- 10.2.2.3. Mammalian Expression Systems
- 10.2.2.4. Yeast Expression Systems
- 10.2.2.5. Other Upstream Processes
- 10.2.1. Downstream
- 10.3. Market Analysis, Insights and Forecast - by Scale of Operations
- 10.3.1. Preclinical
- 10.3.2. Clinical
- 10.3.3. Commercial
- 10.4. Market Analysis, Insights and Forecast - by End Use
- 10.4.1. Human Use
- 10.4.2. Veterinary
- 10.1. Market Analysis, Insights and Forecast - by Vaccine Type
- 11. North America Vaccine Contract Manufacturing Industry Analysis, Insights and Forecast, 2019-2031
- 11.1. Market Analysis, Insights and Forecast - By Country/Sub-region
- 11.1.1. undefined
- 12. Europe Vaccine Contract Manufacturing Industry Analysis, Insights and Forecast, 2019-2031
- 12.1. Market Analysis, Insights and Forecast - By Country/Sub-region
- 12.1.1. undefined
- 13. Asia Pacific Vaccine Contract Manufacturing Industry Analysis, Insights and Forecast, 2019-2031
- 13.1. Market Analysis, Insights and Forecast - By Country/Sub-region
- 13.1.1. undefined
- 14. Middle East and Africa Vaccine Contract Manufacturing Industry Analysis, Insights and Forecast, 2019-2031
- 14.1. Market Analysis, Insights and Forecast - By Country/Sub-region
- 14.1.1. undefined
- 15. South America Vaccine Contract Manufacturing Industry Analysis, Insights and Forecast, 2019-2031
- 15.1. Market Analysis, Insights and Forecast - By Country/Sub-region
- 15.1.1. undefined
- 16. Competitive Analysis
- 16.1. Global Market Share Analysis 2024
- 16.2. Company Profiles
- 16.2.1 CJ CheilJedang Corporation (Batavia Biosciences)
- 16.2.1.1. Overview
- 16.2.1.2. Products
- 16.2.1.3. SWOT Analysis
- 16.2.1.4. Recent Developments
- 16.2.1.5. Financials (Based on Availability)
- 16.2.2 Curia Global
- 16.2.2.1. Overview
- 16.2.2.2. Products
- 16.2.2.3. SWOT Analysis
- 16.2.2.4. Recent Developments
- 16.2.2.5. Financials (Based on Availability)
- 16.2.3 ICON PLC
- 16.2.3.1. Overview
- 16.2.3.2. Products
- 16.2.3.3. SWOT Analysis
- 16.2.3.4. Recent Developments
- 16.2.3.5. Financials (Based on Availability)
- 16.2.4 Charles River Laboratories International Inc
- 16.2.4.1. Overview
- 16.2.4.2. Products
- 16.2.4.3. SWOT Analysis
- 16.2.4.4. Recent Developments
- 16.2.4.5. Financials (Based on Availability)
- 16.2.5 Catalent
- 16.2.5.1. Overview
- 16.2.5.2. Products
- 16.2.5.3. SWOT Analysis
- 16.2.5.4. Recent Developments
- 16.2.5.5. Financials (Based on Availability)
- 16.2.6 IDT Biologika GmbH
- 16.2.6.1. Overview
- 16.2.6.2. Products
- 16.2.6.3. SWOT Analysis
- 16.2.6.4. Recent Developments
- 16.2.6.5. Financials (Based on Availability)
- 16.2.7 Lonza Group AG
- 16.2.7.1. Overview
- 16.2.7.2. Products
- 16.2.7.3. SWOT Analysis
- 16.2.7.4. Recent Developments
- 16.2.7.5. Financials (Based on Availability)
- 16.2.8 Gedeon Richter (Richter-Helm BioLogics)
- 16.2.8.1. Overview
- 16.2.8.2. Products
- 16.2.8.3. SWOT Analysis
- 16.2.8.4. Recent Developments
- 16.2.8.5. Financials (Based on Availability)
- 16.2.9 Ajinomoto Bio-Pharma Services
- 16.2.9.1. Overview
- 16.2.9.2. Products
- 16.2.9.3. SWOT Analysis
- 16.2.9.4. Recent Developments
- 16.2.9.5. Financials (Based on Availability)
- 16.2.10 Recipharm AB
- 16.2.10.1. Overview
- 16.2.10.2. Products
- 16.2.10.3. SWOT Analysis
- 16.2.10.4. Recent Developments
- 16.2.10.5. Financials (Based on Availability)
- 16.2.11 Emergent BioSolutions Inc
- 16.2.11.1. Overview
- 16.2.11.2. Products
- 16.2.11.3. SWOT Analysis
- 16.2.11.4. Recent Developments
- 16.2.11.5. Financials (Based on Availability)
- 16.2.12 Fujifilm Holdings Corporation
- 16.2.12.1. Overview
- 16.2.12.2. Products
- 16.2.12.3. SWOT Analysis
- 16.2.12.4. Recent Developments
- 16.2.12.5. Financials (Based on Availability)
- 16.2.1 CJ CheilJedang Corporation (Batavia Biosciences)
List of Figures
- Figure 1: Global Vaccine Contract Manufacturing Industry Revenue Breakdown (Million, %) by Region 2024 & 2032
- Figure 2: Global Vaccine Contract Manufacturing Industry Volume Breakdown (K Unit, %) by Region 2024 & 2032
- Figure 3: North America Vaccine Contract Manufacturing Industry Revenue (Million), by Country 2024 & 2032
- Figure 4: North America Vaccine Contract Manufacturing Industry Volume (K Unit), by Country 2024 & 2032
- Figure 5: North America Vaccine Contract Manufacturing Industry Revenue Share (%), by Country 2024 & 2032
- Figure 6: North America Vaccine Contract Manufacturing Industry Volume Share (%), by Country 2024 & 2032
- Figure 7: Europe Vaccine Contract Manufacturing Industry Revenue (Million), by Country 2024 & 2032
- Figure 8: Europe Vaccine Contract Manufacturing Industry Volume (K Unit), by Country 2024 & 2032
- Figure 9: Europe Vaccine Contract Manufacturing Industry Revenue Share (%), by Country 2024 & 2032
- Figure 10: Europe Vaccine Contract Manufacturing Industry Volume Share (%), by Country 2024 & 2032
- Figure 11: Asia Pacific Vaccine Contract Manufacturing Industry Revenue (Million), by Country 2024 & 2032
- Figure 12: Asia Pacific Vaccine Contract Manufacturing Industry Volume (K Unit), by Country 2024 & 2032
- Figure 13: Asia Pacific Vaccine Contract Manufacturing Industry Revenue Share (%), by Country 2024 & 2032
- Figure 14: Asia Pacific Vaccine Contract Manufacturing Industry Volume Share (%), by Country 2024 & 2032
- Figure 15: Middle East and Africa Vaccine Contract Manufacturing Industry Revenue (Million), by Country 2024 & 2032
- Figure 16: Middle East and Africa Vaccine Contract Manufacturing Industry Volume (K Unit), by Country 2024 & 2032
- Figure 17: Middle East and Africa Vaccine Contract Manufacturing Industry Revenue Share (%), by Country 2024 & 2032
- Figure 18: Middle East and Africa Vaccine Contract Manufacturing Industry Volume Share (%), by Country 2024 & 2032
- Figure 19: South America Vaccine Contract Manufacturing Industry Revenue (Million), by Country 2024 & 2032
- Figure 20: South America Vaccine Contract Manufacturing Industry Volume (K Unit), by Country 2024 & 2032
- Figure 21: South America Vaccine Contract Manufacturing Industry Revenue Share (%), by Country 2024 & 2032
- Figure 22: South America Vaccine Contract Manufacturing Industry Volume Share (%), by Country 2024 & 2032
- Figure 23: North America Vaccine Contract Manufacturing Industry Revenue (Million), by Vaccine Type 2024 & 2032
- Figure 24: North America Vaccine Contract Manufacturing Industry Volume (K Unit), by Vaccine Type 2024 & 2032
- Figure 25: North America Vaccine Contract Manufacturing Industry Revenue Share (%), by Vaccine Type 2024 & 2032
- Figure 26: North America Vaccine Contract Manufacturing Industry Volume Share (%), by Vaccine Type 2024 & 2032
- Figure 27: North America Vaccine Contract Manufacturing Industry Revenue (Million), by Process 2024 & 2032
- Figure 28: North America Vaccine Contract Manufacturing Industry Volume (K Unit), by Process 2024 & 2032
- Figure 29: North America Vaccine Contract Manufacturing Industry Revenue Share (%), by Process 2024 & 2032
- Figure 30: North America Vaccine Contract Manufacturing Industry Volume Share (%), by Process 2024 & 2032
- Figure 31: North America Vaccine Contract Manufacturing Industry Revenue (Million), by Scale of Operations 2024 & 2032
- Figure 32: North America Vaccine Contract Manufacturing Industry Volume (K Unit), by Scale of Operations 2024 & 2032
- Figure 33: North America Vaccine Contract Manufacturing Industry Revenue Share (%), by Scale of Operations 2024 & 2032
- Figure 34: North America Vaccine Contract Manufacturing Industry Volume Share (%), by Scale of Operations 2024 & 2032
- Figure 35: North America Vaccine Contract Manufacturing Industry Revenue (Million), by End Use 2024 & 2032
- Figure 36: North America Vaccine Contract Manufacturing Industry Volume (K Unit), by End Use 2024 & 2032
- Figure 37: North America Vaccine Contract Manufacturing Industry Revenue Share (%), by End Use 2024 & 2032
- Figure 38: North America Vaccine Contract Manufacturing Industry Volume Share (%), by End Use 2024 & 2032
- Figure 39: North America Vaccine Contract Manufacturing Industry Revenue (Million), by Country 2024 & 2032
- Figure 40: North America Vaccine Contract Manufacturing Industry Volume (K Unit), by Country 2024 & 2032
- Figure 41: North America Vaccine Contract Manufacturing Industry Revenue Share (%), by Country 2024 & 2032
- Figure 42: North America Vaccine Contract Manufacturing Industry Volume Share (%), by Country 2024 & 2032
- Figure 43: Europe Vaccine Contract Manufacturing Industry Revenue (Million), by Vaccine Type 2024 & 2032
- Figure 44: Europe Vaccine Contract Manufacturing Industry Volume (K Unit), by Vaccine Type 2024 & 2032
- Figure 45: Europe Vaccine Contract Manufacturing Industry Revenue Share (%), by Vaccine Type 2024 & 2032
- Figure 46: Europe Vaccine Contract Manufacturing Industry Volume Share (%), by Vaccine Type 2024 & 2032
- Figure 47: Europe Vaccine Contract Manufacturing Industry Revenue (Million), by Process 2024 & 2032
- Figure 48: Europe Vaccine Contract Manufacturing Industry Volume (K Unit), by Process 2024 & 2032
- Figure 49: Europe Vaccine Contract Manufacturing Industry Revenue Share (%), by Process 2024 & 2032
- Figure 50: Europe Vaccine Contract Manufacturing Industry Volume Share (%), by Process 2024 & 2032
- Figure 51: Europe Vaccine Contract Manufacturing Industry Revenue (Million), by Scale of Operations 2024 & 2032
- Figure 52: Europe Vaccine Contract Manufacturing Industry Volume (K Unit), by Scale of Operations 2024 & 2032
- Figure 53: Europe Vaccine Contract Manufacturing Industry Revenue Share (%), by Scale of Operations 2024 & 2032
- Figure 54: Europe Vaccine Contract Manufacturing Industry Volume Share (%), by Scale of Operations 2024 & 2032
- Figure 55: Europe Vaccine Contract Manufacturing Industry Revenue (Million), by End Use 2024 & 2032
- Figure 56: Europe Vaccine Contract Manufacturing Industry Volume (K Unit), by End Use 2024 & 2032
- Figure 57: Europe Vaccine Contract Manufacturing Industry Revenue Share (%), by End Use 2024 & 2032
- Figure 58: Europe Vaccine Contract Manufacturing Industry Volume Share (%), by End Use 2024 & 2032
- Figure 59: Europe Vaccine Contract Manufacturing Industry Revenue (Million), by Country 2024 & 2032
- Figure 60: Europe Vaccine Contract Manufacturing Industry Volume (K Unit), by Country 2024 & 2032
- Figure 61: Europe Vaccine Contract Manufacturing Industry Revenue Share (%), by Country 2024 & 2032
- Figure 62: Europe Vaccine Contract Manufacturing Industry Volume Share (%), by Country 2024 & 2032
- Figure 63: Asia Pacific Vaccine Contract Manufacturing Industry Revenue (Million), by Vaccine Type 2024 & 2032
- Figure 64: Asia Pacific Vaccine Contract Manufacturing Industry Volume (K Unit), by Vaccine Type 2024 & 2032
- Figure 65: Asia Pacific Vaccine Contract Manufacturing Industry Revenue Share (%), by Vaccine Type 2024 & 2032
- Figure 66: Asia Pacific Vaccine Contract Manufacturing Industry Volume Share (%), by Vaccine Type 2024 & 2032
- Figure 67: Asia Pacific Vaccine Contract Manufacturing Industry Revenue (Million), by Process 2024 & 2032
- Figure 68: Asia Pacific Vaccine Contract Manufacturing Industry Volume (K Unit), by Process 2024 & 2032
- Figure 69: Asia Pacific Vaccine Contract Manufacturing Industry Revenue Share (%), by Process 2024 & 2032
- Figure 70: Asia Pacific Vaccine Contract Manufacturing Industry Volume Share (%), by Process 2024 & 2032
- Figure 71: Asia Pacific Vaccine Contract Manufacturing Industry Revenue (Million), by Scale of Operations 2024 & 2032
- Figure 72: Asia Pacific Vaccine Contract Manufacturing Industry Volume (K Unit), by Scale of Operations 2024 & 2032
- Figure 73: Asia Pacific Vaccine Contract Manufacturing Industry Revenue Share (%), by Scale of Operations 2024 & 2032
- Figure 74: Asia Pacific Vaccine Contract Manufacturing Industry Volume Share (%), by Scale of Operations 2024 & 2032
- Figure 75: Asia Pacific Vaccine Contract Manufacturing Industry Revenue (Million), by End Use 2024 & 2032
- Figure 76: Asia Pacific Vaccine Contract Manufacturing Industry Volume (K Unit), by End Use 2024 & 2032
- Figure 77: Asia Pacific Vaccine Contract Manufacturing Industry Revenue Share (%), by End Use 2024 & 2032
- Figure 78: Asia Pacific Vaccine Contract Manufacturing Industry Volume Share (%), by End Use 2024 & 2032
- Figure 79: Asia Pacific Vaccine Contract Manufacturing Industry Revenue (Million), by Country 2024 & 2032
- Figure 80: Asia Pacific Vaccine Contract Manufacturing Industry Volume (K Unit), by Country 2024 & 2032
- Figure 81: Asia Pacific Vaccine Contract Manufacturing Industry Revenue Share (%), by Country 2024 & 2032
- Figure 82: Asia Pacific Vaccine Contract Manufacturing Industry Volume Share (%), by Country 2024 & 2032
- Figure 83: Middle East and Africa Vaccine Contract Manufacturing Industry Revenue (Million), by Vaccine Type 2024 & 2032
- Figure 84: Middle East and Africa Vaccine Contract Manufacturing Industry Volume (K Unit), by Vaccine Type 2024 & 2032
- Figure 85: Middle East and Africa Vaccine Contract Manufacturing Industry Revenue Share (%), by Vaccine Type 2024 & 2032
- Figure 86: Middle East and Africa Vaccine Contract Manufacturing Industry Volume Share (%), by Vaccine Type 2024 & 2032
- Figure 87: Middle East and Africa Vaccine Contract Manufacturing Industry Revenue (Million), by Process 2024 & 2032
- Figure 88: Middle East and Africa Vaccine Contract Manufacturing Industry Volume (K Unit), by Process 2024 & 2032
- Figure 89: Middle East and Africa Vaccine Contract Manufacturing Industry Revenue Share (%), by Process 2024 & 2032
- Figure 90: Middle East and Africa Vaccine Contract Manufacturing Industry Volume Share (%), by Process 2024 & 2032
- Figure 91: Middle East and Africa Vaccine Contract Manufacturing Industry Revenue (Million), by Scale of Operations 2024 & 2032
- Figure 92: Middle East and Africa Vaccine Contract Manufacturing Industry Volume (K Unit), by Scale of Operations 2024 & 2032
- Figure 93: Middle East and Africa Vaccine Contract Manufacturing Industry Revenue Share (%), by Scale of Operations 2024 & 2032
- Figure 94: Middle East and Africa Vaccine Contract Manufacturing Industry Volume Share (%), by Scale of Operations 2024 & 2032
- Figure 95: Middle East and Africa Vaccine Contract Manufacturing Industry Revenue (Million), by End Use 2024 & 2032
- Figure 96: Middle East and Africa Vaccine Contract Manufacturing Industry Volume (K Unit), by End Use 2024 & 2032
- Figure 97: Middle East and Africa Vaccine Contract Manufacturing Industry Revenue Share (%), by End Use 2024 & 2032
- Figure 98: Middle East and Africa Vaccine Contract Manufacturing Industry Volume Share (%), by End Use 2024 & 2032
- Figure 99: Middle East and Africa Vaccine Contract Manufacturing Industry Revenue (Million), by Country 2024 & 2032
- Figure 100: Middle East and Africa Vaccine Contract Manufacturing Industry Volume (K Unit), by Country 2024 & 2032
- Figure 101: Middle East and Africa Vaccine Contract Manufacturing Industry Revenue Share (%), by Country 2024 & 2032
- Figure 102: Middle East and Africa Vaccine Contract Manufacturing Industry Volume Share (%), by Country 2024 & 2032
- Figure 103: South America Vaccine Contract Manufacturing Industry Revenue (Million), by Vaccine Type 2024 & 2032
- Figure 104: South America Vaccine Contract Manufacturing Industry Volume (K Unit), by Vaccine Type 2024 & 2032
- Figure 105: South America Vaccine Contract Manufacturing Industry Revenue Share (%), by Vaccine Type 2024 & 2032
- Figure 106: South America Vaccine Contract Manufacturing Industry Volume Share (%), by Vaccine Type 2024 & 2032
- Figure 107: South America Vaccine Contract Manufacturing Industry Revenue (Million), by Process 2024 & 2032
- Figure 108: South America Vaccine Contract Manufacturing Industry Volume (K Unit), by Process 2024 & 2032
- Figure 109: South America Vaccine Contract Manufacturing Industry Revenue Share (%), by Process 2024 & 2032
- Figure 110: South America Vaccine Contract Manufacturing Industry Volume Share (%), by Process 2024 & 2032
- Figure 111: South America Vaccine Contract Manufacturing Industry Revenue (Million), by Scale of Operations 2024 & 2032
- Figure 112: South America Vaccine Contract Manufacturing Industry Volume (K Unit), by Scale of Operations 2024 & 2032
- Figure 113: South America Vaccine Contract Manufacturing Industry Revenue Share (%), by Scale of Operations 2024 & 2032
- Figure 114: South America Vaccine Contract Manufacturing Industry Volume Share (%), by Scale of Operations 2024 & 2032
- Figure 115: South America Vaccine Contract Manufacturing Industry Revenue (Million), by End Use 2024 & 2032
- Figure 116: South America Vaccine Contract Manufacturing Industry Volume (K Unit), by End Use 2024 & 2032
- Figure 117: South America Vaccine Contract Manufacturing Industry Revenue Share (%), by End Use 2024 & 2032
- Figure 118: South America Vaccine Contract Manufacturing Industry Volume Share (%), by End Use 2024 & 2032
- Figure 119: South America Vaccine Contract Manufacturing Industry Revenue (Million), by Country 2024 & 2032
- Figure 120: South America Vaccine Contract Manufacturing Industry Volume (K Unit), by Country 2024 & 2032
- Figure 121: South America Vaccine Contract Manufacturing Industry Revenue Share (%), by Country 2024 & 2032
- Figure 122: South America Vaccine Contract Manufacturing Industry Volume Share (%), by Country 2024 & 2032
List of Tables
- Table 1: Global Vaccine Contract Manufacturing Industry Revenue Million Forecast, by Region 2019 & 2032
- Table 2: Global Vaccine Contract Manufacturing Industry Volume K Unit Forecast, by Region 2019 & 2032
- Table 3: Global Vaccine Contract Manufacturing Industry Revenue Million Forecast, by Vaccine Type 2019 & 2032
- Table 4: Global Vaccine Contract Manufacturing Industry Volume K Unit Forecast, by Vaccine Type 2019 & 2032
- Table 5: Global Vaccine Contract Manufacturing Industry Revenue Million Forecast, by Process 2019 & 2032
- Table 6: Global Vaccine Contract Manufacturing Industry Volume K Unit Forecast, by Process 2019 & 2032
- Table 7: Global Vaccine Contract Manufacturing Industry Revenue Million Forecast, by Scale of Operations 2019 & 2032
- Table 8: Global Vaccine Contract Manufacturing Industry Volume K Unit Forecast, by Scale of Operations 2019 & 2032
- Table 9: Global Vaccine Contract Manufacturing Industry Revenue Million Forecast, by End Use 2019 & 2032
- Table 10: Global Vaccine Contract Manufacturing Industry Volume K Unit Forecast, by End Use 2019 & 2032
- Table 11: Global Vaccine Contract Manufacturing Industry Revenue Million Forecast, by Region 2019 & 2032
- Table 12: Global Vaccine Contract Manufacturing Industry Volume K Unit Forecast, by Region 2019 & 2032
- Table 13: Global Vaccine Contract Manufacturing Industry Revenue Million Forecast, by Country 2019 & 2032
- Table 14: Global Vaccine Contract Manufacturing Industry Volume K Unit Forecast, by Country 2019 & 2032
- Table 15: Global Vaccine Contract Manufacturing Industry Revenue Million Forecast, by Country 2019 & 2032
- Table 16: Global Vaccine Contract Manufacturing Industry Volume K Unit Forecast, by Country 2019 & 2032
- Table 17: Global Vaccine Contract Manufacturing Industry Revenue Million Forecast, by Country 2019 & 2032
- Table 18: Global Vaccine Contract Manufacturing Industry Volume K Unit Forecast, by Country 2019 & 2032
- Table 19: Global Vaccine Contract Manufacturing Industry Revenue Million Forecast, by Country 2019 & 2032
- Table 20: Global Vaccine Contract Manufacturing Industry Volume K Unit Forecast, by Country 2019 & 2032
- Table 21: Global Vaccine Contract Manufacturing Industry Revenue Million Forecast, by Country 2019 & 2032
- Table 22: Global Vaccine Contract Manufacturing Industry Volume K Unit Forecast, by Country 2019 & 2032
- Table 23: Global Vaccine Contract Manufacturing Industry Revenue Million Forecast, by Vaccine Type 2019 & 2032
- Table 24: Global Vaccine Contract Manufacturing Industry Volume K Unit Forecast, by Vaccine Type 2019 & 2032
- Table 25: Global Vaccine Contract Manufacturing Industry Revenue Million Forecast, by Process 2019 & 2032
- Table 26: Global Vaccine Contract Manufacturing Industry Volume K Unit Forecast, by Process 2019 & 2032
- Table 27: Global Vaccine Contract Manufacturing Industry Revenue Million Forecast, by Scale of Operations 2019 & 2032
- Table 28: Global Vaccine Contract Manufacturing Industry Volume K Unit Forecast, by Scale of Operations 2019 & 2032
- Table 29: Global Vaccine Contract Manufacturing Industry Revenue Million Forecast, by End Use 2019 & 2032
- Table 30: Global Vaccine Contract Manufacturing Industry Volume K Unit Forecast, by End Use 2019 & 2032
- Table 31: Global Vaccine Contract Manufacturing Industry Revenue Million Forecast, by Country 2019 & 2032
- Table 32: Global Vaccine Contract Manufacturing Industry Volume K Unit Forecast, by Country 2019 & 2032
- Table 33: United States Vaccine Contract Manufacturing Industry Revenue (Million) Forecast, by Application 2019 & 2032
- Table 34: United States Vaccine Contract Manufacturing Industry Volume (K Unit) Forecast, by Application 2019 & 2032
- Table 35: Canada Vaccine Contract Manufacturing Industry Revenue (Million) Forecast, by Application 2019 & 2032
- Table 36: Canada Vaccine Contract Manufacturing Industry Volume (K Unit) Forecast, by Application 2019 & 2032
- Table 37: Mexico Vaccine Contract Manufacturing Industry Revenue (Million) Forecast, by Application 2019 & 2032
- Table 38: Mexico Vaccine Contract Manufacturing Industry Volume (K Unit) Forecast, by Application 2019 & 2032
- Table 39: Global Vaccine Contract Manufacturing Industry Revenue Million Forecast, by Vaccine Type 2019 & 2032
- Table 40: Global Vaccine Contract Manufacturing Industry Volume K Unit Forecast, by Vaccine Type 2019 & 2032
- Table 41: Global Vaccine Contract Manufacturing Industry Revenue Million Forecast, by Process 2019 & 2032
- Table 42: Global Vaccine Contract Manufacturing Industry Volume K Unit Forecast, by Process 2019 & 2032
- Table 43: Global Vaccine Contract Manufacturing Industry Revenue Million Forecast, by Scale of Operations 2019 & 2032
- Table 44: Global Vaccine Contract Manufacturing Industry Volume K Unit Forecast, by Scale of Operations 2019 & 2032
- Table 45: Global Vaccine Contract Manufacturing Industry Revenue Million Forecast, by End Use 2019 & 2032
- Table 46: Global Vaccine Contract Manufacturing Industry Volume K Unit Forecast, by End Use 2019 & 2032
- Table 47: Global Vaccine Contract Manufacturing Industry Revenue Million Forecast, by Country 2019 & 2032
- Table 48: Global Vaccine Contract Manufacturing Industry Volume K Unit Forecast, by Country 2019 & 2032
- Table 49: Germany Vaccine Contract Manufacturing Industry Revenue (Million) Forecast, by Application 2019 & 2032
- Table 50: Germany Vaccine Contract Manufacturing Industry Volume (K Unit) Forecast, by Application 2019 & 2032
- Table 51: United Kingdom Vaccine Contract Manufacturing Industry Revenue (Million) Forecast, by Application 2019 & 2032
- Table 52: United Kingdom Vaccine Contract Manufacturing Industry Volume (K Unit) Forecast, by Application 2019 & 2032
- Table 53: France Vaccine Contract Manufacturing Industry Revenue (Million) Forecast, by Application 2019 & 2032
- Table 54: France Vaccine Contract Manufacturing Industry Volume (K Unit) Forecast, by Application 2019 & 2032
- Table 55: Italy Vaccine Contract Manufacturing Industry Revenue (Million) Forecast, by Application 2019 & 2032
- Table 56: Italy Vaccine Contract Manufacturing Industry Volume (K Unit) Forecast, by Application 2019 & 2032
- Table 57: Spain Vaccine Contract Manufacturing Industry Revenue (Million) Forecast, by Application 2019 & 2032
- Table 58: Spain Vaccine Contract Manufacturing Industry Volume (K Unit) Forecast, by Application 2019 & 2032
- Table 59: Rest of Europe Vaccine Contract Manufacturing Industry Revenue (Million) Forecast, by Application 2019 & 2032
- Table 60: Rest of Europe Vaccine Contract Manufacturing Industry Volume (K Unit) Forecast, by Application 2019 & 2032
- Table 61: Global Vaccine Contract Manufacturing Industry Revenue Million Forecast, by Vaccine Type 2019 & 2032
- Table 62: Global Vaccine Contract Manufacturing Industry Volume K Unit Forecast, by Vaccine Type 2019 & 2032
- Table 63: Global Vaccine Contract Manufacturing Industry Revenue Million Forecast, by Process 2019 & 2032
- Table 64: Global Vaccine Contract Manufacturing Industry Volume K Unit Forecast, by Process 2019 & 2032
- Table 65: Global Vaccine Contract Manufacturing Industry Revenue Million Forecast, by Scale of Operations 2019 & 2032
- Table 66: Global Vaccine Contract Manufacturing Industry Volume K Unit Forecast, by Scale of Operations 2019 & 2032
- Table 67: Global Vaccine Contract Manufacturing Industry Revenue Million Forecast, by End Use 2019 & 2032
- Table 68: Global Vaccine Contract Manufacturing Industry Volume K Unit Forecast, by End Use 2019 & 2032
- Table 69: Global Vaccine Contract Manufacturing Industry Revenue Million Forecast, by Country 2019 & 2032
- Table 70: Global Vaccine Contract Manufacturing Industry Volume K Unit Forecast, by Country 2019 & 2032
- Table 71: China Vaccine Contract Manufacturing Industry Revenue (Million) Forecast, by Application 2019 & 2032
- Table 72: China Vaccine Contract Manufacturing Industry Volume (K Unit) Forecast, by Application 2019 & 2032
- Table 73: Japan Vaccine Contract Manufacturing Industry Revenue (Million) Forecast, by Application 2019 & 2032
- Table 74: Japan Vaccine Contract Manufacturing Industry Volume (K Unit) Forecast, by Application 2019 & 2032
- Table 75: India Vaccine Contract Manufacturing Industry Revenue (Million) Forecast, by Application 2019 & 2032
- Table 76: India Vaccine Contract Manufacturing Industry Volume (K Unit) Forecast, by Application 2019 & 2032
- Table 77: Australia Vaccine Contract Manufacturing Industry Revenue (Million) Forecast, by Application 2019 & 2032
- Table 78: Australia Vaccine Contract Manufacturing Industry Volume (K Unit) Forecast, by Application 2019 & 2032
- Table 79: South Korea Vaccine Contract Manufacturing Industry Revenue (Million) Forecast, by Application 2019 & 2032
- Table 80: South Korea Vaccine Contract Manufacturing Industry Volume (K Unit) Forecast, by Application 2019 & 2032
- Table 81: Rest of Asia Pacific Vaccine Contract Manufacturing Industry Revenue (Million) Forecast, by Application 2019 & 2032
- Table 82: Rest of Asia Pacific Vaccine Contract Manufacturing Industry Volume (K Unit) Forecast, by Application 2019 & 2032
- Table 83: Global Vaccine Contract Manufacturing Industry Revenue Million Forecast, by Vaccine Type 2019 & 2032
- Table 84: Global Vaccine Contract Manufacturing Industry Volume K Unit Forecast, by Vaccine Type 2019 & 2032
- Table 85: Global Vaccine Contract Manufacturing Industry Revenue Million Forecast, by Process 2019 & 2032
- Table 86: Global Vaccine Contract Manufacturing Industry Volume K Unit Forecast, by Process 2019 & 2032
- Table 87: Global Vaccine Contract Manufacturing Industry Revenue Million Forecast, by Scale of Operations 2019 & 2032
- Table 88: Global Vaccine Contract Manufacturing Industry Volume K Unit Forecast, by Scale of Operations 2019 & 2032
- Table 89: Global Vaccine Contract Manufacturing Industry Revenue Million Forecast, by End Use 2019 & 2032
- Table 90: Global Vaccine Contract Manufacturing Industry Volume K Unit Forecast, by End Use 2019 & 2032
- Table 91: Global Vaccine Contract Manufacturing Industry Revenue Million Forecast, by Country 2019 & 2032
- Table 92: Global Vaccine Contract Manufacturing Industry Volume K Unit Forecast, by Country 2019 & 2032
- Table 93: GCC Vaccine Contract Manufacturing Industry Revenue (Million) Forecast, by Application 2019 & 2032
- Table 94: GCC Vaccine Contract Manufacturing Industry Volume (K Unit) Forecast, by Application 2019 & 2032
- Table 95: South Africa Vaccine Contract Manufacturing Industry Revenue (Million) Forecast, by Application 2019 & 2032
- Table 96: South Africa Vaccine Contract Manufacturing Industry Volume (K Unit) Forecast, by Application 2019 & 2032
- Table 97: Rest of Middle East and Africa Vaccine Contract Manufacturing Industry Revenue (Million) Forecast, by Application 2019 & 2032
- Table 98: Rest of Middle East and Africa Vaccine Contract Manufacturing Industry Volume (K Unit) Forecast, by Application 2019 & 2032
- Table 99: Global Vaccine Contract Manufacturing Industry Revenue Million Forecast, by Vaccine Type 2019 & 2032
- Table 100: Global Vaccine Contract Manufacturing Industry Volume K Unit Forecast, by Vaccine Type 2019 & 2032
- Table 101: Global Vaccine Contract Manufacturing Industry Revenue Million Forecast, by Process 2019 & 2032
- Table 102: Global Vaccine Contract Manufacturing Industry Volume K Unit Forecast, by Process 2019 & 2032
- Table 103: Global Vaccine Contract Manufacturing Industry Revenue Million Forecast, by Scale of Operations 2019 & 2032
- Table 104: Global Vaccine Contract Manufacturing Industry Volume K Unit Forecast, by Scale of Operations 2019 & 2032
- Table 105: Global Vaccine Contract Manufacturing Industry Revenue Million Forecast, by End Use 2019 & 2032
- Table 106: Global Vaccine Contract Manufacturing Industry Volume K Unit Forecast, by End Use 2019 & 2032
- Table 107: Global Vaccine Contract Manufacturing Industry Revenue Million Forecast, by Country 2019 & 2032
- Table 108: Global Vaccine Contract Manufacturing Industry Volume K Unit Forecast, by Country 2019 & 2032
- Table 109: Brazil Vaccine Contract Manufacturing Industry Revenue (Million) Forecast, by Application 2019 & 2032
- Table 110: Brazil Vaccine Contract Manufacturing Industry Volume (K Unit) Forecast, by Application 2019 & 2032
- Table 111: Argentina Vaccine Contract Manufacturing Industry Revenue (Million) Forecast, by Application 2019 & 2032
- Table 112: Argentina Vaccine Contract Manufacturing Industry Volume (K Unit) Forecast, by Application 2019 & 2032
- Table 113: Rest of South America Vaccine Contract Manufacturing Industry Revenue (Million) Forecast, by Application 2019 & 2032
- Table 114: Rest of South America Vaccine Contract Manufacturing Industry Volume (K Unit) Forecast, by Application 2019 & 2032
Frequently Asked Questions
1. What is the projected Compound Annual Growth Rate (CAGR) of the Vaccine Contract Manufacturing Industry?
The projected CAGR is approximately 11.18%.
2. Which companies are prominent players in the Vaccine Contract Manufacturing Industry?
Key companies in the market include CJ CheilJedang Corporation (Batavia Biosciences), Curia Global, ICON PLC, Charles River Laboratories International Inc, Catalent, IDT Biologika GmbH, Lonza Group AG, Gedeon Richter (Richter-Helm BioLogics), Ajinomoto Bio-Pharma Services, Recipharm AB, Emergent BioSolutions Inc, Fujifilm Holdings Corporation.
3. What are the main segments of the Vaccine Contract Manufacturing Industry?
The market segments include Vaccine Type, Process, Scale of Operations, End Use.
4. Can you provide details about the market size?
The market size is estimated to be USD 3.51 Million as of 2022.
5. What are some drivers contributing to market growth?
Advancements in Technology and Cost Benefits in Infrastructure and Operational Benefits; Increase in Initiatives Favoring Vaccinations; Favorable Patient Demographics and Growing Vaccinations of Newborns and Children.
6. What are the notable trends driving market growth?
The Inactivated Vaccines Segment is Expected to Hold a Significant Share in the Vaccine Contract Manufacturing Market over the Forecast Period.
7. Are there any restraints impacting market growth?
Rising High Costs of Vaccines; Lack of Storage Infrastructure and Limitations Associated with Supply Chain.
8. Can you provide examples of recent developments in the market?
August 2022: Moderna inked an agreement with the Canadian government to construct a messenger RNA vaccine manufacturing factory in an undetermined location in Canada. According to the biotech firm, the partnership will give Canadians access to mRNA vaccines made in Canada against respiratory viruses such as SARS-CoV-2, influenza, and respiratory syncytial virus.
9. What pricing options are available for accessing the report?
Pricing options include single-user, multi-user, and enterprise licenses priced at USD 4750, USD 5250, and USD 8750 respectively.
10. Is the market size provided in terms of value or volume?
The market size is provided in terms of value, measured in Million and volume, measured in K Unit.
11. Are there any specific market keywords associated with the report?
Yes, the market keyword associated with the report is "Vaccine Contract Manufacturing Industry," which aids in identifying and referencing the specific market segment covered.
12. How do I determine which pricing option suits my needs best?
The pricing options vary based on user requirements and access needs. Individual users may opt for single-user licenses, while businesses requiring broader access may choose multi-user or enterprise licenses for cost-effective access to the report.
13. Are there any additional resources or data provided in the Vaccine Contract Manufacturing Industry report?
While the report offers comprehensive insights, it's advisable to review the specific contents or supplementary materials provided to ascertain if additional resources or data are available.
14. How can I stay updated on further developments or reports in the Vaccine Contract Manufacturing Industry?
To stay informed about further developments, trends, and reports in the Vaccine Contract Manufacturing Industry, consider subscribing to industry newsletters, following relevant companies and organizations, or regularly checking reputable industry news sources and publications.
Methodology
Step 1 - Identification of Relevant Samples Size from Population Database


Step 2 - Approaches for Defining Global Market Size (Value, Volume* & Price*)

Note*: In applicable scenarios
Step 3 - Data Sources
Primary Research
- Web Analytics
- Survey Reports
- Research Institute
- Latest Research Reports
- Opinion Leaders
Secondary Research
- Annual Reports
- White Paper
- Latest Press Release
- Industry Association
- Paid Database
- Investor Presentations

Step 4 - Data Triangulation
Involves using different sources of information in order to increase the validity of a study
These sources are likely to be stakeholders in a program - participants, other researchers, program staff, other community members, and so on.
Then we put all data in single framework & apply various statistical tools to find out the dynamic on the market.
During the analysis stage, feedback from the stakeholder groups would be compared to determine areas of agreement as well as areas of divergence


