
Key Insights
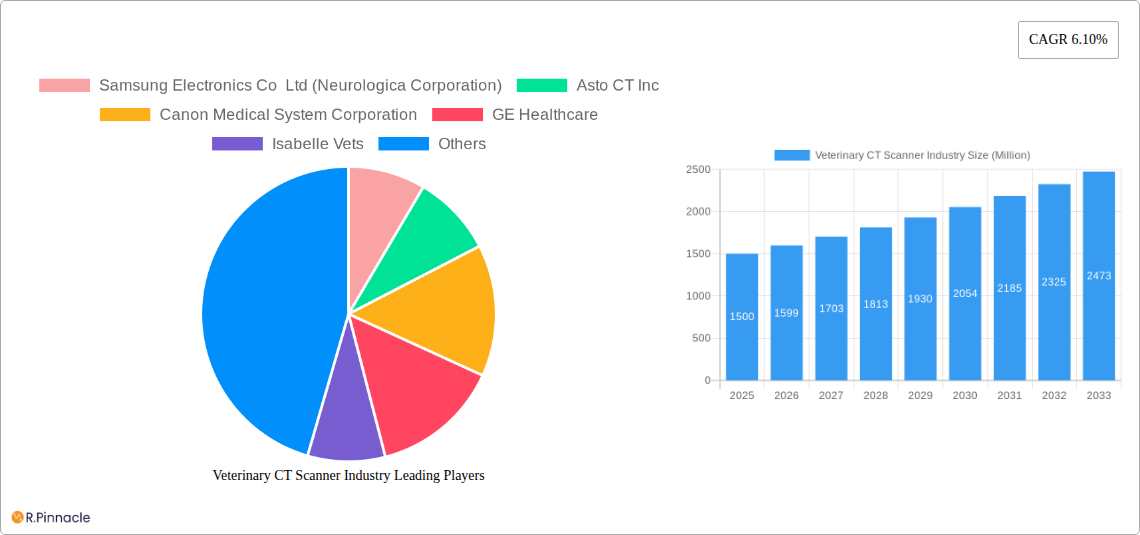
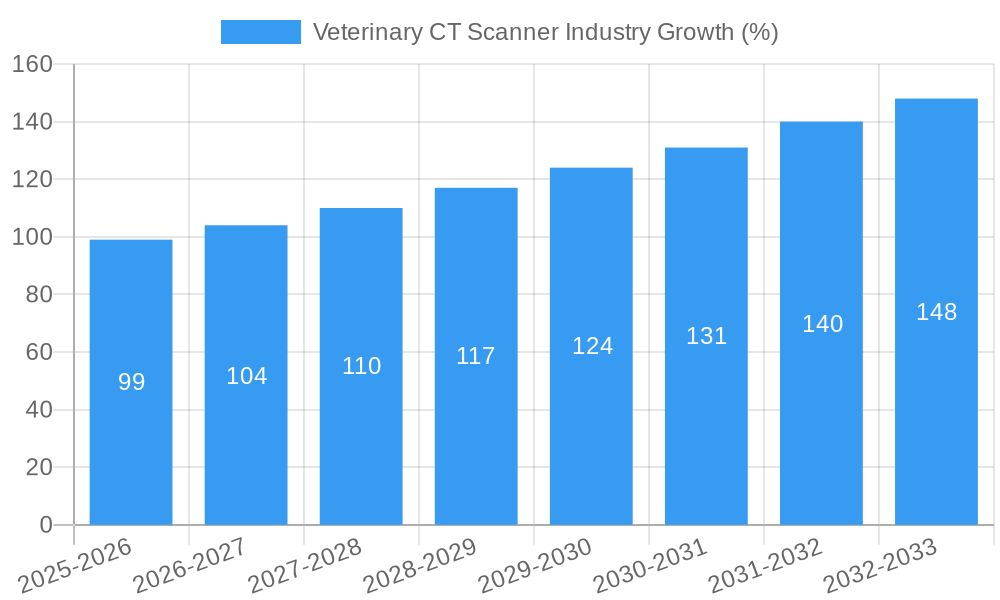
The veterinary CT scanner market is experiencing robust growth, driven by increasing pet ownership, rising veterinary healthcare expenditure, and advancements in imaging technology. The market's Compound Annual Growth Rate (CAGR) of 6.10% from 2019-2024 suggests a significant expansion, and this trajectory is expected to continue through 2033. Key market segments include stationary and portable CT scanners catering to companion animals, livestock, and other animal types. Applications span various veterinary specializations, such as neurology, oncology, cardiology, and gastroenterology, with veterinary hospitals being the primary end-users. Technological advancements, such as the development of smaller, more affordable, and portable CT scanners, are further fueling market expansion, making this technology accessible to a wider range of veterinary practices. The increasing demand for advanced diagnostic tools for precise and timely diagnosis of animal diseases is a major factor driving this growth. Geographic analysis reveals a strong market presence in North America and Europe, with Asia Pacific poised for significant expansion owing to increasing pet ownership and improving healthcare infrastructure in emerging economies. Competition is moderately intense with key players like Samsung Neurologica, Canon Medical, GE Healthcare, and Siemens Healthineers continuously innovating and expanding their product portfolios to cater to the growing market needs. However, high initial investment costs and limited access to advanced technology in some regions could act as potential restraints.
The market's future growth hinges on several factors. Continued technological innovation leading to more sophisticated and user-friendly veterinary CT scanners will be crucial. Furthermore, expanding access to financing options for veterinary clinics, particularly in developing regions, will be vital to drive adoption. Increasing awareness amongst veterinarians regarding the benefits of CT scanning in improved diagnostics and treatment outcomes will also positively impact market growth. Furthermore, partnerships between manufacturers and veterinary organizations to provide training and support will be essential for optimizing the utilization of this technology and maximizing its impact on animal health. Regulatory approvals and standardization of CT scanning practices across different regions will also play a significant role in shaping the market's trajectory in the coming years. The ongoing development of specialized software and AI-powered image analysis tools will also contribute to the market’s expansion.
Veterinary CT Scanner Industry Market Report: 2019-2033
This comprehensive report provides a detailed analysis of the Veterinary CT Scanner industry, offering invaluable insights for industry professionals, investors, and stakeholders. Covering the period 2019-2033, with a focus on 2025, this report meticulously examines market dynamics, growth drivers, challenges, and future opportunities. The report leverages extensive market research and data analysis to provide actionable intelligence and strategic recommendations. The global market value is projected to reach xx Million by 2033.
Veterinary CT Scanner Industry Market Structure & Innovation Trends
The veterinary CT scanner market is moderately concentrated, with key players like Samsung Electronics Co Ltd (Neurologica Corporation), GE Healthcare, Siemens Healthineers, and Canon Medical System Corporation holding significant market share. Precise market share figures for each company are unavailable and will be detailed in the full report. Innovation is driven by the need for higher resolution imaging, faster scan times, and improved portability, particularly for use in mobile veterinary clinics. Regulatory frameworks, varying by region, influence market access and device approval. The market faces competitive pressures from advancements in other diagnostic imaging technologies such as MRI and ultrasound, although CT scanners remain a vital diagnostic tool, particularly for bone and soft tissue visualization.
- Market Concentration: Moderate, with a few major players dominating.
- Innovation Drivers: Higher resolution, faster scan times, portability, and AI integration.
- Regulatory Frameworks: Vary significantly across regions.
- Product Substitutes: MRI, ultrasound, X-ray.
- M&A Activity: The report details xx Million in M&A activity in the historical period (2019-2024), with specific deal values and analysis included within the full report.
- End-User Demographics: Growing demand from veterinary hospitals and research institutes, driving market expansion.
Veterinary CT Scanner Industry Market Dynamics & Trends
The veterinary CT scanner market exhibits strong growth potential, driven by factors including rising pet ownership, increasing veterinary care spending, and technological advancements resulting in better image quality and increased accessibility. The Compound Annual Growth Rate (CAGR) for the forecast period (2025-2033) is estimated to be xx%. Market penetration of CT scanners in veterinary settings is still relatively low compared to human healthcare, presenting significant growth opportunities. This market is also fueled by increasing awareness of animal health and a trend towards improved diagnostic capabilities in veterinary practice. Competitive dynamics are influenced by technological innovations, pricing strategies, and the expansion of service offerings by market participants.
Dominant Regions & Segments in Veterinary CT Scanner Industry
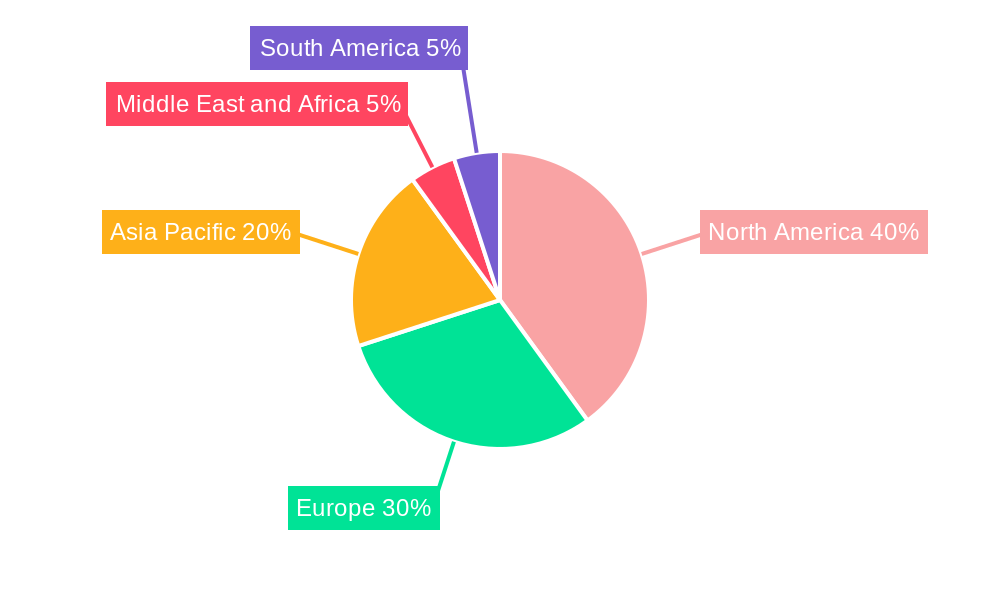
North America currently dominates the veterinary CT scanner market, primarily driven by high veterinary care expenditure and advanced veterinary infrastructure. However, significant growth is anticipated in the Asia-Pacific region due to increasing pet ownership and rising disposable incomes.
- Leading Region: North America
- Leading Product Type: Stationary Multi-slice CT Scanner (due to higher image quality and features)
- Leading Animal Type: Companion animals (dogs and cats)
- Leading Application: Oncology (cancer detection and treatment monitoring)
- Leading End-User: Veterinary Hospitals
Key Drivers (by Region and Segment):
- North America: High veterinary spending, advanced healthcare infrastructure.
- Europe: Growing adoption of advanced diagnostics, supportive regulatory environment.
- Asia-Pacific: Rising pet ownership, expanding veterinary sector.
- Stationary CT Scanners: Superior image quality, greater functionality.
- Companion Animals: Higher pet ownership rates, increased pet health awareness.
- Oncology: Prevalence of cancer in animals, need for precise diagnostics.
- Veterinary Hospitals: Large patient volumes, access to funding for advanced equipment.
Veterinary CT Scanner Industry Product Innovations
Recent innovations focus on miniaturization, resulting in more portable scanners suitable for smaller veterinary clinics and even on-site mobile use. Improvements in image processing algorithms, faster scan times, and the integration of AI for automated image analysis are significant advancements driving market growth. The development of specialized software for veterinary applications further enhances the usability and diagnostic capabilities of veterinary CT scanners. These improvements improve image quality, diagnostic accuracy, and treatment planning, providing significant competitive advantages.
Report Scope & Segmentation Analysis
This report segments the veterinary CT scanner market by product type (Stationary Multi-slice CT Scanner and Portable CT Scanner), animal type (Companion Animal, Livestock Animal, and Other Animal Types), application (Neurology, Oncology, Cardiology, Nephrology, Gastroenterology, and Other Applications), and end-user (Veterinary Hospitals, Research Institutes, and Other End-Users). Each segment’s market size, growth projections, and competitive dynamics are analyzed extensively in the full report. For example, the companion animal segment is expected to dominate due to higher pet ownership, while the oncology application segment shows strong growth due to the rising prevalence of cancer in pets.
Key Drivers of Veterinary CT Scanner Industry Growth
Key growth drivers include:
- Technological advancements: Improved image quality, faster scan times, and enhanced portability.
- Rising pet ownership: Increased demand for advanced veterinary diagnostic services.
- Growing veterinary spending: Higher disposable incomes and increasing awareness of pet health.
- Favorable regulatory environments: Supportive policies promoting the adoption of advanced medical technologies.
Challenges in the Veterinary CT Scanner Industry Sector
Challenges include:
- High initial investment costs: Limiting access for smaller veterinary clinics.
- Specialized training requirements: Need for skilled technicians to operate and interpret images.
- Competition from alternative imaging techniques: MRI and ultrasound offer alternative diagnostic capabilities.
- Supply chain disruptions: Impacting the availability of components and potentially increasing costs.
Emerging Opportunities in Veterinary CT Scanner Industry
Opportunities exist in:
- Expansion into emerging markets: Untapped potential in developing economies with rising pet ownership.
- Development of specialized veterinary software: Improved image analysis and diagnostic capabilities.
- Integration of AI and machine learning: Automated image analysis and improved diagnostic accuracy.
- Increased focus on mobile and portable CT scanners: Expanding access to advanced diagnostics in remote areas.
Leading Players in the Veterinary CT Scanner Industry Market
- Samsung Electronics Co Ltd (Neurologica Corporation)
- Asto CT Inc
- Canon Medical System Corporation
- GE Healthcare
- Isabelle Vets
- Animage LLC
- GNI ApS
- Siemens Healthineers
- Epica Animal Health
Key Developments in Veterinary CT Scanner Industry
- September 2022: Installation of a Toshiba Aquilion 16 CT scanner at a Fort Lauderdale veterinary hospital, showcasing advancements in technology and improved access to high-quality care.
- April 2022: Launch of an innovative online computed tomography (CT) program by Improve International, enhancing professional development opportunities and potentially improving the skillset of veterinary professionals using CT scanners.
Future Outlook for Veterinary CT Scanner Industry Market
The veterinary CT scanner market is poised for continued growth, driven by ongoing technological advancements, increasing pet ownership, and rising veterinary spending. Strategic opportunities lie in developing innovative products, expanding into underserved markets, and fostering collaborations to enhance market penetration and improve the quality of veterinary care. The market is expected to witness substantial growth, driven by the factors mentioned above.
Veterinary CT Scanner Industry Segmentation
-
1. Product Type
- 1.1. Stationary Multi-slice CT Scanner
- 1.2. Portable CT Scanner
-
2. Animal Type
- 2.1. Companion Animal
- 2.2. Livestock Animal
- 2.3. Other Animal Types
-
3. Application
- 3.1. Neurology
- 3.2. Oncology
- 3.3. Cardiology
- 3.4. Nephrology
- 3.5. Gastroenterology
- 3.6. Other Applications
-
4. End-User
- 4.1. Veterinary Hospitals
- 4.2. Research Institutes
- 4.3. Other End-Users
Veterinary CT Scanner Industry Segmentation By Geography
-
1. North America
- 1.1. United States
- 1.2. Canada
- 1.3. Mexico
-
2. Europe
- 2.1. Germany
- 2.2. United Kingdom
- 2.3. France
- 2.4. Italy
- 2.5. Spain
- 2.6. Rest of Europe
-
3. Asia Pacific
- 3.1. China
- 3.2. Japan
- 3.3. India
- 3.4. Australia
- 3.5. South Korea
- 3.6. Rest of Asia Pacific
-
4. Middle East and Africa
- 4.1. GCC
- 4.2. South Africa
- 4.3. Rest of Middle East and Africa
-
5. South America
- 5.1. Brazil
- 5.2. Argentina
- 5.3. Rest of South America
Veterinary CT Scanner Industry REPORT HIGHLIGHTS
| Aspects | Details |
|---|---|
| Study Period | 2019-2033 |
| Base Year | 2024 |
| Estimated Year | 2025 |
| Forecast Period | 2025-2033 |
| Historical Period | 2019-2024 |
| Growth Rate | CAGR of 6.10% from 2019-2033 |
| Segmentation |
|
Table of Contents
- 1. Introduction
- 1.1. Research Scope
- 1.2. Market Segmentation
- 1.3. Research Methodology
- 1.4. Definitions and Assumptions
- 2. Executive Summary
- 2.1. Introduction
- 3. Market Dynamics
- 3.1. Introduction
- 3.2. Market Drivers
- 3.2.1. Increased Pet Ownership and Animal Health Expenditure; Rising Prevalence of Animal Diseases and Injuries
- 3.3. Market Restrains
- 3.3.1. High Cost of CT Imaging Devices; Low Animal Health Awareness in Emerging Markets
- 3.4. Market Trends
- 3.4.1. Companion Animals Segment is Expected to Hold a Significant Market Share During the Forecast Period
- 4. Market Factor Analysis
- 4.1. Porters Five Forces
- 4.2. Supply/Value Chain
- 4.3. PESTEL analysis
- 4.4. Market Entropy
- 4.5. Patent/Trademark Analysis
- 5. Global Veterinary CT Scanner Industry Analysis, Insights and Forecast, 2019-2031
- 5.1. Market Analysis, Insights and Forecast - by Product Type
- 5.1.1. Stationary Multi-slice CT Scanner
- 5.1.2. Portable CT Scanner
- 5.2. Market Analysis, Insights and Forecast - by Animal Type
- 5.2.1. Companion Animal
- 5.2.2. Livestock Animal
- 5.2.3. Other Animal Types
- 5.3. Market Analysis, Insights and Forecast - by Application
- 5.3.1. Neurology
- 5.3.2. Oncology
- 5.3.3. Cardiology
- 5.3.4. Nephrology
- 5.3.5. Gastroenterology
- 5.3.6. Other Applications
- 5.4. Market Analysis, Insights and Forecast - by End-User
- 5.4.1. Veterinary Hospitals
- 5.4.2. Research Institutes
- 5.4.3. Other End-Users
- 5.5. Market Analysis, Insights and Forecast - by Region
- 5.5.1. North America
- 5.5.2. Europe
- 5.5.3. Asia Pacific
- 5.5.4. Middle East and Africa
- 5.5.5. South America
- 5.1. Market Analysis, Insights and Forecast - by Product Type
- 6. North America Veterinary CT Scanner Industry Analysis, Insights and Forecast, 2019-2031
- 6.1. Market Analysis, Insights and Forecast - by Product Type
- 6.1.1. Stationary Multi-slice CT Scanner
- 6.1.2. Portable CT Scanner
- 6.2. Market Analysis, Insights and Forecast - by Animal Type
- 6.2.1. Companion Animal
- 6.2.2. Livestock Animal
- 6.2.3. Other Animal Types
- 6.3. Market Analysis, Insights and Forecast - by Application
- 6.3.1. Neurology
- 6.3.2. Oncology
- 6.3.3. Cardiology
- 6.3.4. Nephrology
- 6.3.5. Gastroenterology
- 6.3.6. Other Applications
- 6.4. Market Analysis, Insights and Forecast - by End-User
- 6.4.1. Veterinary Hospitals
- 6.4.2. Research Institutes
- 6.4.3. Other End-Users
- 6.1. Market Analysis, Insights and Forecast - by Product Type
- 7. Europe Veterinary CT Scanner Industry Analysis, Insights and Forecast, 2019-2031
- 7.1. Market Analysis, Insights and Forecast - by Product Type
- 7.1.1. Stationary Multi-slice CT Scanner
- 7.1.2. Portable CT Scanner
- 7.2. Market Analysis, Insights and Forecast - by Animal Type
- 7.2.1. Companion Animal
- 7.2.2. Livestock Animal
- 7.2.3. Other Animal Types
- 7.3. Market Analysis, Insights and Forecast - by Application
- 7.3.1. Neurology
- 7.3.2. Oncology
- 7.3.3. Cardiology
- 7.3.4. Nephrology
- 7.3.5. Gastroenterology
- 7.3.6. Other Applications
- 7.4. Market Analysis, Insights and Forecast - by End-User
- 7.4.1. Veterinary Hospitals
- 7.4.2. Research Institutes
- 7.4.3. Other End-Users
- 7.1. Market Analysis, Insights and Forecast - by Product Type
- 8. Asia Pacific Veterinary CT Scanner Industry Analysis, Insights and Forecast, 2019-2031
- 8.1. Market Analysis, Insights and Forecast - by Product Type
- 8.1.1. Stationary Multi-slice CT Scanner
- 8.1.2. Portable CT Scanner
- 8.2. Market Analysis, Insights and Forecast - by Animal Type
- 8.2.1. Companion Animal
- 8.2.2. Livestock Animal
- 8.2.3. Other Animal Types
- 8.3. Market Analysis, Insights and Forecast - by Application
- 8.3.1. Neurology
- 8.3.2. Oncology
- 8.3.3. Cardiology
- 8.3.4. Nephrology
- 8.3.5. Gastroenterology
- 8.3.6. Other Applications
- 8.4. Market Analysis, Insights and Forecast - by End-User
- 8.4.1. Veterinary Hospitals
- 8.4.2. Research Institutes
- 8.4.3. Other End-Users
- 8.1. Market Analysis, Insights and Forecast - by Product Type
- 9. Middle East and Africa Veterinary CT Scanner Industry Analysis, Insights and Forecast, 2019-2031
- 9.1. Market Analysis, Insights and Forecast - by Product Type
- 9.1.1. Stationary Multi-slice CT Scanner
- 9.1.2. Portable CT Scanner
- 9.2. Market Analysis, Insights and Forecast - by Animal Type
- 9.2.1. Companion Animal
- 9.2.2. Livestock Animal
- 9.2.3. Other Animal Types
- 9.3. Market Analysis, Insights and Forecast - by Application
- 9.3.1. Neurology
- 9.3.2. Oncology
- 9.3.3. Cardiology
- 9.3.4. Nephrology
- 9.3.5. Gastroenterology
- 9.3.6. Other Applications
- 9.4. Market Analysis, Insights and Forecast - by End-User
- 9.4.1. Veterinary Hospitals
- 9.4.2. Research Institutes
- 9.4.3. Other End-Users
- 9.1. Market Analysis, Insights and Forecast - by Product Type
- 10. South America Veterinary CT Scanner Industry Analysis, Insights and Forecast, 2019-2031
- 10.1. Market Analysis, Insights and Forecast - by Product Type
- 10.1.1. Stationary Multi-slice CT Scanner
- 10.1.2. Portable CT Scanner
- 10.2. Market Analysis, Insights and Forecast - by Animal Type
- 10.2.1. Companion Animal
- 10.2.2. Livestock Animal
- 10.2.3. Other Animal Types
- 10.3. Market Analysis, Insights and Forecast - by Application
- 10.3.1. Neurology
- 10.3.2. Oncology
- 10.3.3. Cardiology
- 10.3.4. Nephrology
- 10.3.5. Gastroenterology
- 10.3.6. Other Applications
- 10.4. Market Analysis, Insights and Forecast - by End-User
- 10.4.1. Veterinary Hospitals
- 10.4.2. Research Institutes
- 10.4.3. Other End-Users
- 10.1. Market Analysis, Insights and Forecast - by Product Type
- 11. North America Veterinary CT Scanner Industry Analysis, Insights and Forecast, 2019-2031
- 11.1. Market Analysis, Insights and Forecast - By Country/Sub-region
- 11.1.1 United States
- 11.1.2 Canada
- 11.1.3 Mexico
- 12. Europe Veterinary CT Scanner Industry Analysis, Insights and Forecast, 2019-2031
- 12.1. Market Analysis, Insights and Forecast - By Country/Sub-region
- 12.1.1 Germany
- 12.1.2 United Kingdom
- 12.1.3 France
- 12.1.4 Italy
- 12.1.5 Spain
- 12.1.6 Rest of Europe
- 13. Asia Pacific Veterinary CT Scanner Industry Analysis, Insights and Forecast, 2019-2031
- 13.1. Market Analysis, Insights and Forecast - By Country/Sub-region
- 13.1.1 China
- 13.1.2 Japan
- 13.1.3 India
- 13.1.4 Australia
- 13.1.5 South Korea
- 13.1.6 Rest of Asia Pacific
- 14. Middle East and Africa Veterinary CT Scanner Industry Analysis, Insights and Forecast, 2019-2031
- 14.1. Market Analysis, Insights and Forecast - By Country/Sub-region
- 14.1.1 GCC
- 14.1.2 South Africa
- 14.1.3 Rest of Middle East and Africa
- 15. South America Veterinary CT Scanner Industry Analysis, Insights and Forecast, 2019-2031
- 15.1. Market Analysis, Insights and Forecast - By Country/Sub-region
- 15.1.1 Brazil
- 15.1.2 Argentina
- 15.1.3 Rest of South America
- 16. Competitive Analysis
- 16.1. Global Market Share Analysis 2024
- 16.2. Company Profiles
- 16.2.1 Samsung Electronics Co Ltd (Neurologica Corporation)
- 16.2.1.1. Overview
- 16.2.1.2. Products
- 16.2.1.3. SWOT Analysis
- 16.2.1.4. Recent Developments
- 16.2.1.5. Financials (Based on Availability)
- 16.2.2 Asto CT Inc
- 16.2.2.1. Overview
- 16.2.2.2. Products
- 16.2.2.3. SWOT Analysis
- 16.2.2.4. Recent Developments
- 16.2.2.5. Financials (Based on Availability)
- 16.2.3 Canon Medical System Corporation
- 16.2.3.1. Overview
- 16.2.3.2. Products
- 16.2.3.3. SWOT Analysis
- 16.2.3.4. Recent Developments
- 16.2.3.5. Financials (Based on Availability)
- 16.2.4 GE Healthcare
- 16.2.4.1. Overview
- 16.2.4.2. Products
- 16.2.4.3. SWOT Analysis
- 16.2.4.4. Recent Developments
- 16.2.4.5. Financials (Based on Availability)
- 16.2.5 Isabelle Vets
- 16.2.5.1. Overview
- 16.2.5.2. Products
- 16.2.5.3. SWOT Analysis
- 16.2.5.4. Recent Developments
- 16.2.5.5. Financials (Based on Availability)
- 16.2.6 Animage LLC
- 16.2.6.1. Overview
- 16.2.6.2. Products
- 16.2.6.3. SWOT Analysis
- 16.2.6.4. Recent Developments
- 16.2.6.5. Financials (Based on Availability)
- 16.2.7 GNI ApS
- 16.2.7.1. Overview
- 16.2.7.2. Products
- 16.2.7.3. SWOT Analysis
- 16.2.7.4. Recent Developments
- 16.2.7.5. Financials (Based on Availability)
- 16.2.8 Siemens Healthineers
- 16.2.8.1. Overview
- 16.2.8.2. Products
- 16.2.8.3. SWOT Analysis
- 16.2.8.4. Recent Developments
- 16.2.8.5. Financials (Based on Availability)
- 16.2.9 Epica Animal Health
- 16.2.9.1. Overview
- 16.2.9.2. Products
- 16.2.9.3. SWOT Analysis
- 16.2.9.4. Recent Developments
- 16.2.9.5. Financials (Based on Availability)
- 16.2.1 Samsung Electronics Co Ltd (Neurologica Corporation)
List of Figures
- Figure 1: Global Veterinary CT Scanner Industry Revenue Breakdown (Million, %) by Region 2024 & 2032
- Figure 2: Global Veterinary CT Scanner Industry Volume Breakdown (K Unit, %) by Region 2024 & 2032
- Figure 3: North America Veterinary CT Scanner Industry Revenue (Million), by Country 2024 & 2032
- Figure 4: North America Veterinary CT Scanner Industry Volume (K Unit), by Country 2024 & 2032
- Figure 5: North America Veterinary CT Scanner Industry Revenue Share (%), by Country 2024 & 2032
- Figure 6: North America Veterinary CT Scanner Industry Volume Share (%), by Country 2024 & 2032
- Figure 7: Europe Veterinary CT Scanner Industry Revenue (Million), by Country 2024 & 2032
- Figure 8: Europe Veterinary CT Scanner Industry Volume (K Unit), by Country 2024 & 2032
- Figure 9: Europe Veterinary CT Scanner Industry Revenue Share (%), by Country 2024 & 2032
- Figure 10: Europe Veterinary CT Scanner Industry Volume Share (%), by Country 2024 & 2032
- Figure 11: Asia Pacific Veterinary CT Scanner Industry Revenue (Million), by Country 2024 & 2032
- Figure 12: Asia Pacific Veterinary CT Scanner Industry Volume (K Unit), by Country 2024 & 2032
- Figure 13: Asia Pacific Veterinary CT Scanner Industry Revenue Share (%), by Country 2024 & 2032
- Figure 14: Asia Pacific Veterinary CT Scanner Industry Volume Share (%), by Country 2024 & 2032
- Figure 15: Middle East and Africa Veterinary CT Scanner Industry Revenue (Million), by Country 2024 & 2032
- Figure 16: Middle East and Africa Veterinary CT Scanner Industry Volume (K Unit), by Country 2024 & 2032
- Figure 17: Middle East and Africa Veterinary CT Scanner Industry Revenue Share (%), by Country 2024 & 2032
- Figure 18: Middle East and Africa Veterinary CT Scanner Industry Volume Share (%), by Country 2024 & 2032
- Figure 19: South America Veterinary CT Scanner Industry Revenue (Million), by Country 2024 & 2032
- Figure 20: South America Veterinary CT Scanner Industry Volume (K Unit), by Country 2024 & 2032
- Figure 21: South America Veterinary CT Scanner Industry Revenue Share (%), by Country 2024 & 2032
- Figure 22: South America Veterinary CT Scanner Industry Volume Share (%), by Country 2024 & 2032
- Figure 23: North America Veterinary CT Scanner Industry Revenue (Million), by Product Type 2024 & 2032
- Figure 24: North America Veterinary CT Scanner Industry Volume (K Unit), by Product Type 2024 & 2032
- Figure 25: North America Veterinary CT Scanner Industry Revenue Share (%), by Product Type 2024 & 2032
- Figure 26: North America Veterinary CT Scanner Industry Volume Share (%), by Product Type 2024 & 2032
- Figure 27: North America Veterinary CT Scanner Industry Revenue (Million), by Animal Type 2024 & 2032
- Figure 28: North America Veterinary CT Scanner Industry Volume (K Unit), by Animal Type 2024 & 2032
- Figure 29: North America Veterinary CT Scanner Industry Revenue Share (%), by Animal Type 2024 & 2032
- Figure 30: North America Veterinary CT Scanner Industry Volume Share (%), by Animal Type 2024 & 2032
- Figure 31: North America Veterinary CT Scanner Industry Revenue (Million), by Application 2024 & 2032
- Figure 32: North America Veterinary CT Scanner Industry Volume (K Unit), by Application 2024 & 2032
- Figure 33: North America Veterinary CT Scanner Industry Revenue Share (%), by Application 2024 & 2032
- Figure 34: North America Veterinary CT Scanner Industry Volume Share (%), by Application 2024 & 2032
- Figure 35: North America Veterinary CT Scanner Industry Revenue (Million), by End-User 2024 & 2032
- Figure 36: North America Veterinary CT Scanner Industry Volume (K Unit), by End-User 2024 & 2032
- Figure 37: North America Veterinary CT Scanner Industry Revenue Share (%), by End-User 2024 & 2032
- Figure 38: North America Veterinary CT Scanner Industry Volume Share (%), by End-User 2024 & 2032
- Figure 39: North America Veterinary CT Scanner Industry Revenue (Million), by Country 2024 & 2032
- Figure 40: North America Veterinary CT Scanner Industry Volume (K Unit), by Country 2024 & 2032
- Figure 41: North America Veterinary CT Scanner Industry Revenue Share (%), by Country 2024 & 2032
- Figure 42: North America Veterinary CT Scanner Industry Volume Share (%), by Country 2024 & 2032
- Figure 43: Europe Veterinary CT Scanner Industry Revenue (Million), by Product Type 2024 & 2032
- Figure 44: Europe Veterinary CT Scanner Industry Volume (K Unit), by Product Type 2024 & 2032
- Figure 45: Europe Veterinary CT Scanner Industry Revenue Share (%), by Product Type 2024 & 2032
- Figure 46: Europe Veterinary CT Scanner Industry Volume Share (%), by Product Type 2024 & 2032
- Figure 47: Europe Veterinary CT Scanner Industry Revenue (Million), by Animal Type 2024 & 2032
- Figure 48: Europe Veterinary CT Scanner Industry Volume (K Unit), by Animal Type 2024 & 2032
- Figure 49: Europe Veterinary CT Scanner Industry Revenue Share (%), by Animal Type 2024 & 2032
- Figure 50: Europe Veterinary CT Scanner Industry Volume Share (%), by Animal Type 2024 & 2032
- Figure 51: Europe Veterinary CT Scanner Industry Revenue (Million), by Application 2024 & 2032
- Figure 52: Europe Veterinary CT Scanner Industry Volume (K Unit), by Application 2024 & 2032
- Figure 53: Europe Veterinary CT Scanner Industry Revenue Share (%), by Application 2024 & 2032
- Figure 54: Europe Veterinary CT Scanner Industry Volume Share (%), by Application 2024 & 2032
- Figure 55: Europe Veterinary CT Scanner Industry Revenue (Million), by End-User 2024 & 2032
- Figure 56: Europe Veterinary CT Scanner Industry Volume (K Unit), by End-User 2024 & 2032
- Figure 57: Europe Veterinary CT Scanner Industry Revenue Share (%), by End-User 2024 & 2032
- Figure 58: Europe Veterinary CT Scanner Industry Volume Share (%), by End-User 2024 & 2032
- Figure 59: Europe Veterinary CT Scanner Industry Revenue (Million), by Country 2024 & 2032
- Figure 60: Europe Veterinary CT Scanner Industry Volume (K Unit), by Country 2024 & 2032
- Figure 61: Europe Veterinary CT Scanner Industry Revenue Share (%), by Country 2024 & 2032
- Figure 62: Europe Veterinary CT Scanner Industry Volume Share (%), by Country 2024 & 2032
- Figure 63: Asia Pacific Veterinary CT Scanner Industry Revenue (Million), by Product Type 2024 & 2032
- Figure 64: Asia Pacific Veterinary CT Scanner Industry Volume (K Unit), by Product Type 2024 & 2032
- Figure 65: Asia Pacific Veterinary CT Scanner Industry Revenue Share (%), by Product Type 2024 & 2032
- Figure 66: Asia Pacific Veterinary CT Scanner Industry Volume Share (%), by Product Type 2024 & 2032
- Figure 67: Asia Pacific Veterinary CT Scanner Industry Revenue (Million), by Animal Type 2024 & 2032
- Figure 68: Asia Pacific Veterinary CT Scanner Industry Volume (K Unit), by Animal Type 2024 & 2032
- Figure 69: Asia Pacific Veterinary CT Scanner Industry Revenue Share (%), by Animal Type 2024 & 2032
- Figure 70: Asia Pacific Veterinary CT Scanner Industry Volume Share (%), by Animal Type 2024 & 2032
- Figure 71: Asia Pacific Veterinary CT Scanner Industry Revenue (Million), by Application 2024 & 2032
- Figure 72: Asia Pacific Veterinary CT Scanner Industry Volume (K Unit), by Application 2024 & 2032
- Figure 73: Asia Pacific Veterinary CT Scanner Industry Revenue Share (%), by Application 2024 & 2032
- Figure 74: Asia Pacific Veterinary CT Scanner Industry Volume Share (%), by Application 2024 & 2032
- Figure 75: Asia Pacific Veterinary CT Scanner Industry Revenue (Million), by End-User 2024 & 2032
- Figure 76: Asia Pacific Veterinary CT Scanner Industry Volume (K Unit), by End-User 2024 & 2032
- Figure 77: Asia Pacific Veterinary CT Scanner Industry Revenue Share (%), by End-User 2024 & 2032
- Figure 78: Asia Pacific Veterinary CT Scanner Industry Volume Share (%), by End-User 2024 & 2032
- Figure 79: Asia Pacific Veterinary CT Scanner Industry Revenue (Million), by Country 2024 & 2032
- Figure 80: Asia Pacific Veterinary CT Scanner Industry Volume (K Unit), by Country 2024 & 2032
- Figure 81: Asia Pacific Veterinary CT Scanner Industry Revenue Share (%), by Country 2024 & 2032
- Figure 82: Asia Pacific Veterinary CT Scanner Industry Volume Share (%), by Country 2024 & 2032
- Figure 83: Middle East and Africa Veterinary CT Scanner Industry Revenue (Million), by Product Type 2024 & 2032
- Figure 84: Middle East and Africa Veterinary CT Scanner Industry Volume (K Unit), by Product Type 2024 & 2032
- Figure 85: Middle East and Africa Veterinary CT Scanner Industry Revenue Share (%), by Product Type 2024 & 2032
- Figure 86: Middle East and Africa Veterinary CT Scanner Industry Volume Share (%), by Product Type 2024 & 2032
- Figure 87: Middle East and Africa Veterinary CT Scanner Industry Revenue (Million), by Animal Type 2024 & 2032
- Figure 88: Middle East and Africa Veterinary CT Scanner Industry Volume (K Unit), by Animal Type 2024 & 2032
- Figure 89: Middle East and Africa Veterinary CT Scanner Industry Revenue Share (%), by Animal Type 2024 & 2032
- Figure 90: Middle East and Africa Veterinary CT Scanner Industry Volume Share (%), by Animal Type 2024 & 2032
- Figure 91: Middle East and Africa Veterinary CT Scanner Industry Revenue (Million), by Application 2024 & 2032
- Figure 92: Middle East and Africa Veterinary CT Scanner Industry Volume (K Unit), by Application 2024 & 2032
- Figure 93: Middle East and Africa Veterinary CT Scanner Industry Revenue Share (%), by Application 2024 & 2032
- Figure 94: Middle East and Africa Veterinary CT Scanner Industry Volume Share (%), by Application 2024 & 2032
- Figure 95: Middle East and Africa Veterinary CT Scanner Industry Revenue (Million), by End-User 2024 & 2032
- Figure 96: Middle East and Africa Veterinary CT Scanner Industry Volume (K Unit), by End-User 2024 & 2032
- Figure 97: Middle East and Africa Veterinary CT Scanner Industry Revenue Share (%), by End-User 2024 & 2032
- Figure 98: Middle East and Africa Veterinary CT Scanner Industry Volume Share (%), by End-User 2024 & 2032
- Figure 99: Middle East and Africa Veterinary CT Scanner Industry Revenue (Million), by Country 2024 & 2032
- Figure 100: Middle East and Africa Veterinary CT Scanner Industry Volume (K Unit), by Country 2024 & 2032
- Figure 101: Middle East and Africa Veterinary CT Scanner Industry Revenue Share (%), by Country 2024 & 2032
- Figure 102: Middle East and Africa Veterinary CT Scanner Industry Volume Share (%), by Country 2024 & 2032
- Figure 103: South America Veterinary CT Scanner Industry Revenue (Million), by Product Type 2024 & 2032
- Figure 104: South America Veterinary CT Scanner Industry Volume (K Unit), by Product Type 2024 & 2032
- Figure 105: South America Veterinary CT Scanner Industry Revenue Share (%), by Product Type 2024 & 2032
- Figure 106: South America Veterinary CT Scanner Industry Volume Share (%), by Product Type 2024 & 2032
- Figure 107: South America Veterinary CT Scanner Industry Revenue (Million), by Animal Type 2024 & 2032
- Figure 108: South America Veterinary CT Scanner Industry Volume (K Unit), by Animal Type 2024 & 2032
- Figure 109: South America Veterinary CT Scanner Industry Revenue Share (%), by Animal Type 2024 & 2032
- Figure 110: South America Veterinary CT Scanner Industry Volume Share (%), by Animal Type 2024 & 2032
- Figure 111: South America Veterinary CT Scanner Industry Revenue (Million), by Application 2024 & 2032
- Figure 112: South America Veterinary CT Scanner Industry Volume (K Unit), by Application 2024 & 2032
- Figure 113: South America Veterinary CT Scanner Industry Revenue Share (%), by Application 2024 & 2032
- Figure 114: South America Veterinary CT Scanner Industry Volume Share (%), by Application 2024 & 2032
- Figure 115: South America Veterinary CT Scanner Industry Revenue (Million), by End-User 2024 & 2032
- Figure 116: South America Veterinary CT Scanner Industry Volume (K Unit), by End-User 2024 & 2032
- Figure 117: South America Veterinary CT Scanner Industry Revenue Share (%), by End-User 2024 & 2032
- Figure 118: South America Veterinary CT Scanner Industry Volume Share (%), by End-User 2024 & 2032
- Figure 119: South America Veterinary CT Scanner Industry Revenue (Million), by Country 2024 & 2032
- Figure 120: South America Veterinary CT Scanner Industry Volume (K Unit), by Country 2024 & 2032
- Figure 121: South America Veterinary CT Scanner Industry Revenue Share (%), by Country 2024 & 2032
- Figure 122: South America Veterinary CT Scanner Industry Volume Share (%), by Country 2024 & 2032
List of Tables
- Table 1: Global Veterinary CT Scanner Industry Revenue Million Forecast, by Region 2019 & 2032
- Table 2: Global Veterinary CT Scanner Industry Volume K Unit Forecast, by Region 2019 & 2032
- Table 3: Global Veterinary CT Scanner Industry Revenue Million Forecast, by Product Type 2019 & 2032
- Table 4: Global Veterinary CT Scanner Industry Volume K Unit Forecast, by Product Type 2019 & 2032
- Table 5: Global Veterinary CT Scanner Industry Revenue Million Forecast, by Animal Type 2019 & 2032
- Table 6: Global Veterinary CT Scanner Industry Volume K Unit Forecast, by Animal Type 2019 & 2032
- Table 7: Global Veterinary CT Scanner Industry Revenue Million Forecast, by Application 2019 & 2032
- Table 8: Global Veterinary CT Scanner Industry Volume K Unit Forecast, by Application 2019 & 2032
- Table 9: Global Veterinary CT Scanner Industry Revenue Million Forecast, by End-User 2019 & 2032
- Table 10: Global Veterinary CT Scanner Industry Volume K Unit Forecast, by End-User 2019 & 2032
- Table 11: Global Veterinary CT Scanner Industry Revenue Million Forecast, by Region 2019 & 2032
- Table 12: Global Veterinary CT Scanner Industry Volume K Unit Forecast, by Region 2019 & 2032
- Table 13: Global Veterinary CT Scanner Industry Revenue Million Forecast, by Country 2019 & 2032
- Table 14: Global Veterinary CT Scanner Industry Volume K Unit Forecast, by Country 2019 & 2032
- Table 15: United States Veterinary CT Scanner Industry Revenue (Million) Forecast, by Application 2019 & 2032
- Table 16: United States Veterinary CT Scanner Industry Volume (K Unit) Forecast, by Application 2019 & 2032
- Table 17: Canada Veterinary CT Scanner Industry Revenue (Million) Forecast, by Application 2019 & 2032
- Table 18: Canada Veterinary CT Scanner Industry Volume (K Unit) Forecast, by Application 2019 & 2032
- Table 19: Mexico Veterinary CT Scanner Industry Revenue (Million) Forecast, by Application 2019 & 2032
- Table 20: Mexico Veterinary CT Scanner Industry Volume (K Unit) Forecast, by Application 2019 & 2032
- Table 21: Global Veterinary CT Scanner Industry Revenue Million Forecast, by Country 2019 & 2032
- Table 22: Global Veterinary CT Scanner Industry Volume K Unit Forecast, by Country 2019 & 2032
- Table 23: Germany Veterinary CT Scanner Industry Revenue (Million) Forecast, by Application 2019 & 2032
- Table 24: Germany Veterinary CT Scanner Industry Volume (K Unit) Forecast, by Application 2019 & 2032
- Table 25: United Kingdom Veterinary CT Scanner Industry Revenue (Million) Forecast, by Application 2019 & 2032
- Table 26: United Kingdom Veterinary CT Scanner Industry Volume (K Unit) Forecast, by Application 2019 & 2032
- Table 27: France Veterinary CT Scanner Industry Revenue (Million) Forecast, by Application 2019 & 2032
- Table 28: France Veterinary CT Scanner Industry Volume (K Unit) Forecast, by Application 2019 & 2032
- Table 29: Italy Veterinary CT Scanner Industry Revenue (Million) Forecast, by Application 2019 & 2032
- Table 30: Italy Veterinary CT Scanner Industry Volume (K Unit) Forecast, by Application 2019 & 2032
- Table 31: Spain Veterinary CT Scanner Industry Revenue (Million) Forecast, by Application 2019 & 2032
- Table 32: Spain Veterinary CT Scanner Industry Volume (K Unit) Forecast, by Application 2019 & 2032
- Table 33: Rest of Europe Veterinary CT Scanner Industry Revenue (Million) Forecast, by Application 2019 & 2032
- Table 34: Rest of Europe Veterinary CT Scanner Industry Volume (K Unit) Forecast, by Application 2019 & 2032
- Table 35: Global Veterinary CT Scanner Industry Revenue Million Forecast, by Country 2019 & 2032
- Table 36: Global Veterinary CT Scanner Industry Volume K Unit Forecast, by Country 2019 & 2032
- Table 37: China Veterinary CT Scanner Industry Revenue (Million) Forecast, by Application 2019 & 2032
- Table 38: China Veterinary CT Scanner Industry Volume (K Unit) Forecast, by Application 2019 & 2032
- Table 39: Japan Veterinary CT Scanner Industry Revenue (Million) Forecast, by Application 2019 & 2032
- Table 40: Japan Veterinary CT Scanner Industry Volume (K Unit) Forecast, by Application 2019 & 2032
- Table 41: India Veterinary CT Scanner Industry Revenue (Million) Forecast, by Application 2019 & 2032
- Table 42: India Veterinary CT Scanner Industry Volume (K Unit) Forecast, by Application 2019 & 2032
- Table 43: Australia Veterinary CT Scanner Industry Revenue (Million) Forecast, by Application 2019 & 2032
- Table 44: Australia Veterinary CT Scanner Industry Volume (K Unit) Forecast, by Application 2019 & 2032
- Table 45: South Korea Veterinary CT Scanner Industry Revenue (Million) Forecast, by Application 2019 & 2032
- Table 46: South Korea Veterinary CT Scanner Industry Volume (K Unit) Forecast, by Application 2019 & 2032
- Table 47: Rest of Asia Pacific Veterinary CT Scanner Industry Revenue (Million) Forecast, by Application 2019 & 2032
- Table 48: Rest of Asia Pacific Veterinary CT Scanner Industry Volume (K Unit) Forecast, by Application 2019 & 2032
- Table 49: Global Veterinary CT Scanner Industry Revenue Million Forecast, by Country 2019 & 2032
- Table 50: Global Veterinary CT Scanner Industry Volume K Unit Forecast, by Country 2019 & 2032
- Table 51: GCC Veterinary CT Scanner Industry Revenue (Million) Forecast, by Application 2019 & 2032
- Table 52: GCC Veterinary CT Scanner Industry Volume (K Unit) Forecast, by Application 2019 & 2032
- Table 53: South Africa Veterinary CT Scanner Industry Revenue (Million) Forecast, by Application 2019 & 2032
- Table 54: South Africa Veterinary CT Scanner Industry Volume (K Unit) Forecast, by Application 2019 & 2032
- Table 55: Rest of Middle East and Africa Veterinary CT Scanner Industry Revenue (Million) Forecast, by Application 2019 & 2032
- Table 56: Rest of Middle East and Africa Veterinary CT Scanner Industry Volume (K Unit) Forecast, by Application 2019 & 2032
- Table 57: Global Veterinary CT Scanner Industry Revenue Million Forecast, by Country 2019 & 2032
- Table 58: Global Veterinary CT Scanner Industry Volume K Unit Forecast, by Country 2019 & 2032
- Table 59: Brazil Veterinary CT Scanner Industry Revenue (Million) Forecast, by Application 2019 & 2032
- Table 60: Brazil Veterinary CT Scanner Industry Volume (K Unit) Forecast, by Application 2019 & 2032
- Table 61: Argentina Veterinary CT Scanner Industry Revenue (Million) Forecast, by Application 2019 & 2032
- Table 62: Argentina Veterinary CT Scanner Industry Volume (K Unit) Forecast, by Application 2019 & 2032
- Table 63: Rest of South America Veterinary CT Scanner Industry Revenue (Million) Forecast, by Application 2019 & 2032
- Table 64: Rest of South America Veterinary CT Scanner Industry Volume (K Unit) Forecast, by Application 2019 & 2032
- Table 65: Global Veterinary CT Scanner Industry Revenue Million Forecast, by Product Type 2019 & 2032
- Table 66: Global Veterinary CT Scanner Industry Volume K Unit Forecast, by Product Type 2019 & 2032
- Table 67: Global Veterinary CT Scanner Industry Revenue Million Forecast, by Animal Type 2019 & 2032
- Table 68: Global Veterinary CT Scanner Industry Volume K Unit Forecast, by Animal Type 2019 & 2032
- Table 69: Global Veterinary CT Scanner Industry Revenue Million Forecast, by Application 2019 & 2032
- Table 70: Global Veterinary CT Scanner Industry Volume K Unit Forecast, by Application 2019 & 2032
- Table 71: Global Veterinary CT Scanner Industry Revenue Million Forecast, by End-User 2019 & 2032
- Table 72: Global Veterinary CT Scanner Industry Volume K Unit Forecast, by End-User 2019 & 2032
- Table 73: Global Veterinary CT Scanner Industry Revenue Million Forecast, by Country 2019 & 2032
- Table 74: Global Veterinary CT Scanner Industry Volume K Unit Forecast, by Country 2019 & 2032
- Table 75: United States Veterinary CT Scanner Industry Revenue (Million) Forecast, by Application 2019 & 2032
- Table 76: United States Veterinary CT Scanner Industry Volume (K Unit) Forecast, by Application 2019 & 2032
- Table 77: Canada Veterinary CT Scanner Industry Revenue (Million) Forecast, by Application 2019 & 2032
- Table 78: Canada Veterinary CT Scanner Industry Volume (K Unit) Forecast, by Application 2019 & 2032
- Table 79: Mexico Veterinary CT Scanner Industry Revenue (Million) Forecast, by Application 2019 & 2032
- Table 80: Mexico Veterinary CT Scanner Industry Volume (K Unit) Forecast, by Application 2019 & 2032
- Table 81: Global Veterinary CT Scanner Industry Revenue Million Forecast, by Product Type 2019 & 2032
- Table 82: Global Veterinary CT Scanner Industry Volume K Unit Forecast, by Product Type 2019 & 2032
- Table 83: Global Veterinary CT Scanner Industry Revenue Million Forecast, by Animal Type 2019 & 2032
- Table 84: Global Veterinary CT Scanner Industry Volume K Unit Forecast, by Animal Type 2019 & 2032
- Table 85: Global Veterinary CT Scanner Industry Revenue Million Forecast, by Application 2019 & 2032
- Table 86: Global Veterinary CT Scanner Industry Volume K Unit Forecast, by Application 2019 & 2032
- Table 87: Global Veterinary CT Scanner Industry Revenue Million Forecast, by End-User 2019 & 2032
- Table 88: Global Veterinary CT Scanner Industry Volume K Unit Forecast, by End-User 2019 & 2032
- Table 89: Global Veterinary CT Scanner Industry Revenue Million Forecast, by Country 2019 & 2032
- Table 90: Global Veterinary CT Scanner Industry Volume K Unit Forecast, by Country 2019 & 2032
- Table 91: Germany Veterinary CT Scanner Industry Revenue (Million) Forecast, by Application 2019 & 2032
- Table 92: Germany Veterinary CT Scanner Industry Volume (K Unit) Forecast, by Application 2019 & 2032
- Table 93: United Kingdom Veterinary CT Scanner Industry Revenue (Million) Forecast, by Application 2019 & 2032
- Table 94: United Kingdom Veterinary CT Scanner Industry Volume (K Unit) Forecast, by Application 2019 & 2032
- Table 95: France Veterinary CT Scanner Industry Revenue (Million) Forecast, by Application 2019 & 2032
- Table 96: France Veterinary CT Scanner Industry Volume (K Unit) Forecast, by Application 2019 & 2032
- Table 97: Italy Veterinary CT Scanner Industry Revenue (Million) Forecast, by Application 2019 & 2032
- Table 98: Italy Veterinary CT Scanner Industry Volume (K Unit) Forecast, by Application 2019 & 2032
- Table 99: Spain Veterinary CT Scanner Industry Revenue (Million) Forecast, by Application 2019 & 2032
- Table 100: Spain Veterinary CT Scanner Industry Volume (K Unit) Forecast, by Application 2019 & 2032
- Table 101: Rest of Europe Veterinary CT Scanner Industry Revenue (Million) Forecast, by Application 2019 & 2032
- Table 102: Rest of Europe Veterinary CT Scanner Industry Volume (K Unit) Forecast, by Application 2019 & 2032
- Table 103: Global Veterinary CT Scanner Industry Revenue Million Forecast, by Product Type 2019 & 2032
- Table 104: Global Veterinary CT Scanner Industry Volume K Unit Forecast, by Product Type 2019 & 2032
- Table 105: Global Veterinary CT Scanner Industry Revenue Million Forecast, by Animal Type 2019 & 2032
- Table 106: Global Veterinary CT Scanner Industry Volume K Unit Forecast, by Animal Type 2019 & 2032
- Table 107: Global Veterinary CT Scanner Industry Revenue Million Forecast, by Application 2019 & 2032
- Table 108: Global Veterinary CT Scanner Industry Volume K Unit Forecast, by Application 2019 & 2032
- Table 109: Global Veterinary CT Scanner Industry Revenue Million Forecast, by End-User 2019 & 2032
- Table 110: Global Veterinary CT Scanner Industry Volume K Unit Forecast, by End-User 2019 & 2032
- Table 111: Global Veterinary CT Scanner Industry Revenue Million Forecast, by Country 2019 & 2032
- Table 112: Global Veterinary CT Scanner Industry Volume K Unit Forecast, by Country 2019 & 2032
- Table 113: China Veterinary CT Scanner Industry Revenue (Million) Forecast, by Application 2019 & 2032
- Table 114: China Veterinary CT Scanner Industry Volume (K Unit) Forecast, by Application 2019 & 2032
- Table 115: Japan Veterinary CT Scanner Industry Revenue (Million) Forecast, by Application 2019 & 2032
- Table 116: Japan Veterinary CT Scanner Industry Volume (K Unit) Forecast, by Application 2019 & 2032
- Table 117: India Veterinary CT Scanner Industry Revenue (Million) Forecast, by Application 2019 & 2032
- Table 118: India Veterinary CT Scanner Industry Volume (K Unit) Forecast, by Application 2019 & 2032
- Table 119: Australia Veterinary CT Scanner Industry Revenue (Million) Forecast, by Application 2019 & 2032
- Table 120: Australia Veterinary CT Scanner Industry Volume (K Unit) Forecast, by Application 2019 & 2032
- Table 121: South Korea Veterinary CT Scanner Industry Revenue (Million) Forecast, by Application 2019 & 2032
- Table 122: South Korea Veterinary CT Scanner Industry Volume (K Unit) Forecast, by Application 2019 & 2032
- Table 123: Rest of Asia Pacific Veterinary CT Scanner Industry Revenue (Million) Forecast, by Application 2019 & 2032
- Table 124: Rest of Asia Pacific Veterinary CT Scanner Industry Volume (K Unit) Forecast, by Application 2019 & 2032
- Table 125: Global Veterinary CT Scanner Industry Revenue Million Forecast, by Product Type 2019 & 2032
- Table 126: Global Veterinary CT Scanner Industry Volume K Unit Forecast, by Product Type 2019 & 2032
- Table 127: Global Veterinary CT Scanner Industry Revenue Million Forecast, by Animal Type 2019 & 2032
- Table 128: Global Veterinary CT Scanner Industry Volume K Unit Forecast, by Animal Type 2019 & 2032
- Table 129: Global Veterinary CT Scanner Industry Revenue Million Forecast, by Application 2019 & 2032
- Table 130: Global Veterinary CT Scanner Industry Volume K Unit Forecast, by Application 2019 & 2032
- Table 131: Global Veterinary CT Scanner Industry Revenue Million Forecast, by End-User 2019 & 2032
- Table 132: Global Veterinary CT Scanner Industry Volume K Unit Forecast, by End-User 2019 & 2032
- Table 133: Global Veterinary CT Scanner Industry Revenue Million Forecast, by Country 2019 & 2032
- Table 134: Global Veterinary CT Scanner Industry Volume K Unit Forecast, by Country 2019 & 2032
- Table 135: GCC Veterinary CT Scanner Industry Revenue (Million) Forecast, by Application 2019 & 2032
- Table 136: GCC Veterinary CT Scanner Industry Volume (K Unit) Forecast, by Application 2019 & 2032
- Table 137: South Africa Veterinary CT Scanner Industry Revenue (Million) Forecast, by Application 2019 & 2032
- Table 138: South Africa Veterinary CT Scanner Industry Volume (K Unit) Forecast, by Application 2019 & 2032
- Table 139: Rest of Middle East and Africa Veterinary CT Scanner Industry Revenue (Million) Forecast, by Application 2019 & 2032
- Table 140: Rest of Middle East and Africa Veterinary CT Scanner Industry Volume (K Unit) Forecast, by Application 2019 & 2032
- Table 141: Global Veterinary CT Scanner Industry Revenue Million Forecast, by Product Type 2019 & 2032
- Table 142: Global Veterinary CT Scanner Industry Volume K Unit Forecast, by Product Type 2019 & 2032
- Table 143: Global Veterinary CT Scanner Industry Revenue Million Forecast, by Animal Type 2019 & 2032
- Table 144: Global Veterinary CT Scanner Industry Volume K Unit Forecast, by Animal Type 2019 & 2032
- Table 145: Global Veterinary CT Scanner Industry Revenue Million Forecast, by Application 2019 & 2032
- Table 146: Global Veterinary CT Scanner Industry Volume K Unit Forecast, by Application 2019 & 2032
- Table 147: Global Veterinary CT Scanner Industry Revenue Million Forecast, by End-User 2019 & 2032
- Table 148: Global Veterinary CT Scanner Industry Volume K Unit Forecast, by End-User 2019 & 2032
- Table 149: Global Veterinary CT Scanner Industry Revenue Million Forecast, by Country 2019 & 2032
- Table 150: Global Veterinary CT Scanner Industry Volume K Unit Forecast, by Country 2019 & 2032
- Table 151: Brazil Veterinary CT Scanner Industry Revenue (Million) Forecast, by Application 2019 & 2032
- Table 152: Brazil Veterinary CT Scanner Industry Volume (K Unit) Forecast, by Application 2019 & 2032
- Table 153: Argentina Veterinary CT Scanner Industry Revenue (Million) Forecast, by Application 2019 & 2032
- Table 154: Argentina Veterinary CT Scanner Industry Volume (K Unit) Forecast, by Application 2019 & 2032
- Table 155: Rest of South America Veterinary CT Scanner Industry Revenue (Million) Forecast, by Application 2019 & 2032
- Table 156: Rest of South America Veterinary CT Scanner Industry Volume (K Unit) Forecast, by Application 2019 & 2032
Frequently Asked Questions
1. What is the projected Compound Annual Growth Rate (CAGR) of the Veterinary CT Scanner Industry?
The projected CAGR is approximately 6.10%.
2. Which companies are prominent players in the Veterinary CT Scanner Industry?
Key companies in the market include Samsung Electronics Co Ltd (Neurologica Corporation), Asto CT Inc, Canon Medical System Corporation, GE Healthcare, Isabelle Vets, Animage LLC, GNI ApS, Siemens Healthineers, Epica Animal Health.
3. What are the main segments of the Veterinary CT Scanner Industry?
The market segments include Product Type, Animal Type, Application, End-User.
4. Can you provide details about the market size?
The market size is estimated to be USD XX Million as of 2022.
5. What are some drivers contributing to market growth?
Increased Pet Ownership and Animal Health Expenditure; Rising Prevalence of Animal Diseases and Injuries.
6. What are the notable trends driving market growth?
Companion Animals Segment is Expected to Hold a Significant Market Share During the Forecast Period.
7. Are there any restraints impacting market growth?
High Cost of CT Imaging Devices; Low Animal Health Awareness in Emerging Markets.
8. Can you provide examples of recent developments in the market?
September 2022: A Fort Lauderdale, Florida-based referral hospital recently upgraded its treatment capabilities by installing a state-of-the-art Toshiba Aquilion 16 CT scanner, ensuring top-notch care for our beloved pets.
9. What pricing options are available for accessing the report?
Pricing options include single-user, multi-user, and enterprise licenses priced at USD 4750, USD 5250, and USD 8750 respectively.
10. Is the market size provided in terms of value or volume?
The market size is provided in terms of value, measured in Million and volume, measured in K Unit.
11. Are there any specific market keywords associated with the report?
Yes, the market keyword associated with the report is "Veterinary CT Scanner Industry," which aids in identifying and referencing the specific market segment covered.
12. How do I determine which pricing option suits my needs best?
The pricing options vary based on user requirements and access needs. Individual users may opt for single-user licenses, while businesses requiring broader access may choose multi-user or enterprise licenses for cost-effective access to the report.
13. Are there any additional resources or data provided in the Veterinary CT Scanner Industry report?
While the report offers comprehensive insights, it's advisable to review the specific contents or supplementary materials provided to ascertain if additional resources or data are available.
14. How can I stay updated on further developments or reports in the Veterinary CT Scanner Industry?
To stay informed about further developments, trends, and reports in the Veterinary CT Scanner Industry, consider subscribing to industry newsletters, following relevant companies and organizations, or regularly checking reputable industry news sources and publications.
Methodology
Step 1 - Identification of Relevant Samples Size from Population Database


Step 2 - Approaches for Defining Global Market Size (Value, Volume* & Price*)

Note*: In applicable scenarios
Step 3 - Data Sources
Primary Research
- Web Analytics
- Survey Reports
- Research Institute
- Latest Research Reports
- Opinion Leaders
Secondary Research
- Annual Reports
- White Paper
- Latest Press Release
- Industry Association
- Paid Database
- Investor Presentations

Step 4 - Data Triangulation
Involves using different sources of information in order to increase the validity of a study
These sources are likely to be stakeholders in a program - participants, other researchers, program staff, other community members, and so on.
Then we put all data in single framework & apply various statistical tools to find out the dynamic on the market.
During the analysis stage, feedback from the stakeholder groups would be compared to determine areas of agreement as well as areas of divergence


