
Key Insights
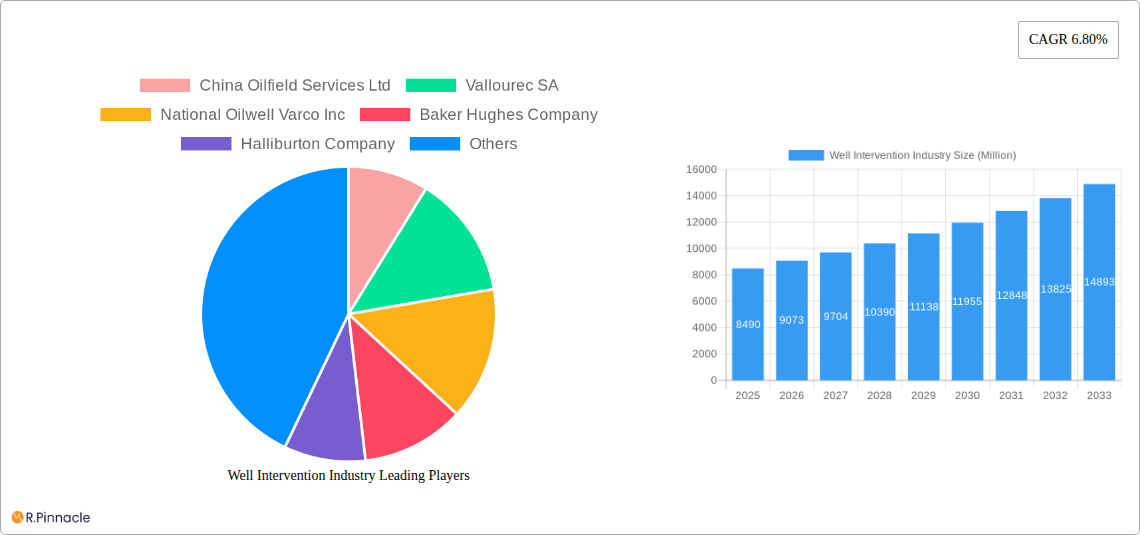
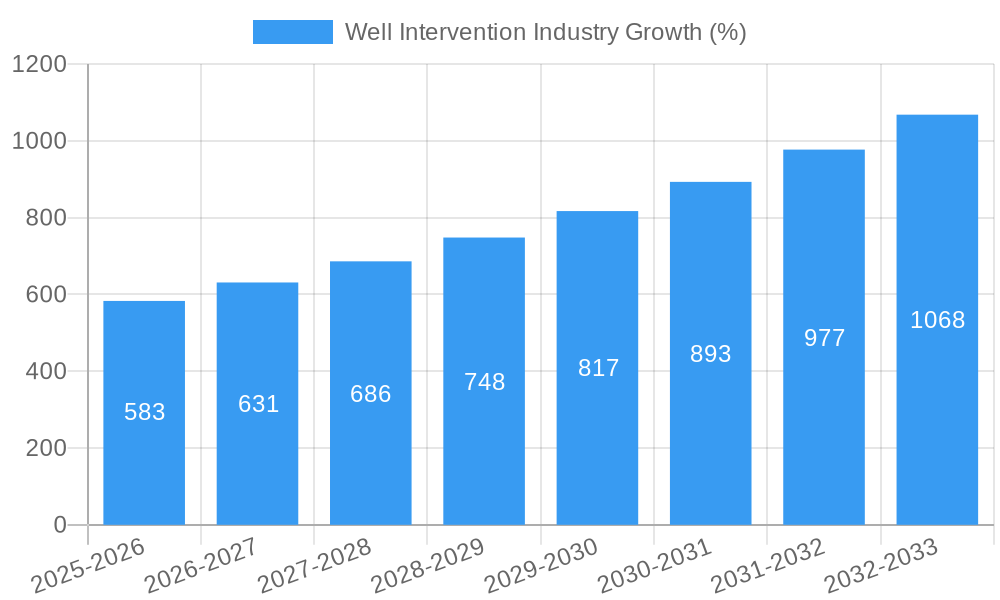
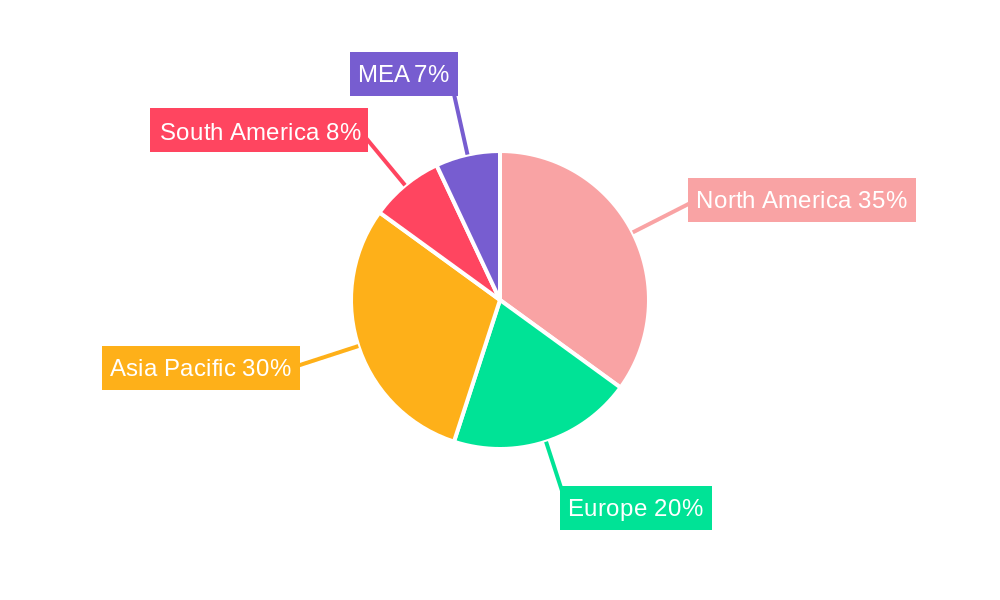
The global well intervention market, valued at $8.49 billion in 2025, is projected to experience robust growth, driven by increasing oil and gas exploration and production activities, particularly in offshore environments. The market's Compound Annual Growth Rate (CAGR) of 6.80% from 2025 to 2033 signifies a significant expansion, fueled by technological advancements in intervention techniques, such as coiled tubing and slickline operations, enabling more efficient and cost-effective well maintenance and repair. The demand for enhanced oil recovery (EOR) methods further contributes to market growth, as operators seek to maximize production from mature fields. Onshore deployments currently dominate the market share, due to established infrastructure and easier accessibility. However, the offshore segment is witnessing faster growth, driven by the exploration of deeper water reserves, despite the associated higher costs and technical complexities. Major players like Schlumberger, Halliburton, and Baker Hughes are actively investing in research and development to improve intervention technologies and expand their service offerings, leading to a competitive yet innovative market landscape. Regional growth is largely influenced by existing oil and gas reserves and government policies supporting exploration activities. North America and the Asia-Pacific region are expected to dominate, given their significant reserves and increasing investments in the sector.
Growth within the next decade will be significantly influenced by several factors. The ongoing energy transition towards renewable sources presents a challenge, although the sustained demand for oil and gas in the foreseeable future will continue to support market expansion. Stringent environmental regulations concerning emissions and waste management will necessitate the adoption of more environmentally friendly intervention technologies. Furthermore, fluctuations in oil prices and geopolitical events can impact investment decisions, potentially slowing down market growth in specific regions or periods. Companies are focusing on developing more efficient and sustainable solutions, including automation and digitalization to optimize well intervention operations and mitigate risks. The continued growth will rely on a balance between technological innovation, regulatory compliance, and consistent demand for oil and gas production.
Well Intervention Industry Market Report: 2019-2033
This comprehensive report provides a detailed analysis of the Well Intervention industry, offering invaluable insights for industry professionals, investors, and strategic decision-makers. The report covers the period 2019-2033, with a focus on the forecast period 2025-2033 and a base year of 2025. Expect in-depth analysis of market size (valued in Millions USD), key growth drivers, challenges, and emerging opportunities across various segments and geographies. This report is your essential guide to navigating the complexities of this dynamic market.
Well Intervention Industry Market Structure & Innovation Trends
This section analyzes the competitive landscape, innovation drivers, and regulatory environment of the well intervention market. We examine market concentration, revealing the market share held by key players like Schlumberger Limited, Halliburton Company, Baker Hughes Company, and others. The report also quantifies the impact of mergers and acquisitions (M&A) activities, estimating the total value of deals exceeding $xx Million in the historical period (2019-2024). Innovation trends are explored, focusing on advancements in technologies like RLWI and their influence on market dynamics. The regulatory landscape's impact on market growth is assessed, including an examination of varying regulations across different regions and their influence on product development and adoption. Further, the report discusses the impact of product substitutes and the evolving demographics of end-users.
- Market Share Analysis: Detailed breakdown of market share held by top players (Schlumberger, Halliburton, Baker Hughes, etc.).
- M&A Activity: Analysis of key mergers and acquisitions, including deal values exceeding $xx Million.
- Innovation Drivers: Examination of technological advancements driving market growth.
- Regulatory Framework: Assessment of the impact of regulatory changes on market dynamics.
Well Intervention Industry Market Dynamics & Trends
This section dives deep into the market dynamics, exploring factors driving market growth and technological disruptions. We analyze the compound annual growth rate (CAGR) projected for the forecast period (2025-2033), estimating it at xx%. Market penetration rates for key technologies are examined to understand adoption trends and forecast potential. Consumer preferences (i.e., demand for specific services and technologies) and the competitive dynamics shaping the industry are thoroughly investigated.
Dominant Regions & Segments in Well Intervention Industry
This segment identifies the dominant regions and deployment locations (onshore vs. offshore) within the Well Intervention market. Detailed analysis will focus on identifying the leading region, considering factors such as economic policies, infrastructure development, and energy demand.
Onshore Segment: Key drivers include [List bullet points detailing economic factors, infrastructure specifics, and government policies impacting onshore well intervention]. A detailed analysis of the market dominance within this sector will be presented.
Offshore Segment: Key drivers include [List bullet points detailing economic factors, infrastructure specifics, and government policies impacting offshore well intervention]. A detailed analysis of the market dominance within this sector will be presented.
Well Intervention Industry Product Innovations
This section summarizes the recent product innovations and their impact on the market. Key technological trends such as advancements in riserless light well intervention (RLWI) and other relevant technologies are highlighted. The report also emphasizes the competitive advantages offered by these new products and their market fit, considering factors such as efficiency gains, cost reductions, and environmental impact.
Report Scope & Segmentation Analysis
This report segments the well intervention market based on location of deployment: onshore and offshore. Each segment is analyzed based on projected growth, market size in Millions USD, and competitive dynamics. Growth projections for each segment are included for the forecast period (2025-2033). The competitive landscape within each segment will be assessed.
Key Drivers of Well Intervention Industry Growth
This section outlines the key factors driving growth in the Well Intervention industry. These drivers are categorized into technological advancements (e.g., automation, remote operations), economic factors (e.g., increasing oil and gas prices, exploration activities), and supportive regulatory policies promoting the use of advanced well intervention techniques. Specific examples of each driver and their projected impact on the market will be presented.
Challenges in the Well Intervention Industry Sector
This section discusses the significant challenges hindering the growth of the Well Intervention market. These challenges are categorized into regulatory hurdles, supply chain disruptions (affecting the availability and cost of equipment and materials), and competitive pressures from established and emerging players. We quantify the impact of these challenges on the market, providing concrete examples and projections where possible. For example, we might quantify the impact of supply chain disruptions on project delays and cost overruns.
Emerging Opportunities in Well Intervention Industry
This section highlights emerging trends and opportunities, focusing on new markets (e.g., unconventional resources), technological innovations (e.g., AI, robotics), and evolving consumer preferences toward sustainable and efficient well intervention solutions. Specific examples and projections of potential market growth are presented.
Leading Players in the Well Intervention Industry Market
- China Oilfield Services Ltd
- Vallourec SA
- National Oilwell Varco Inc
- Baker Hughes Company
- Halliburton Company
- Weatherford International Ltd
- Schlumberger Limited
- Scientific Drilling International Inc
Key Developments in Well Intervention Industry
- May 2023: TechnipFMC secured a contract from Equinor for RLWI services on the Norwegian Continental Shelf, covering production enhancement, data acquisition, and pre-plug-and-abandonment services from 2024-2025, with options for extension.
- March 2023: Petroleum Safety Authority Norway (PSA) approved Norske Shell's use of the Island Constructor vessel for well intervention on the Knarr and Gaupe fields.
Future Outlook for Well Intervention Industry Market
The future outlook for the Well Intervention industry is positive, driven by several factors, including increasing demand for oil and gas, technological advancements improving efficiency and reducing environmental impact, and supportive government policies promoting exploration and production activities. This will lead to considerable market expansion and create attractive strategic opportunities for industry players in the coming years. The report offers predictions for the growth rate, market size, and emerging technologies that will shape the market landscape in the coming decade.
Well Intervention Industry Segmentation
-
1. Location of Deployment
- 1.1. Onshore
- 1.2. Offshore
Well Intervention Industry Segmentation By Geography
-
1. North America
- 1.1. United States of America
- 1.2. Canada
- 1.3. Rest of the North America
-
2. Europe
- 2.1. United Kingdom
- 2.2. France
- 2.3. Germany
- 2.4. Italy
- 2.5. Rest of the Europe
-
3. Asia Pacific
- 3.1. China
- 3.2. India
- 3.3. South Korea
- 3.4. Rest of the Asia Pacific
-
4. South America
- 4.1. Brazil
- 4.2. Argentina
- 4.3. Rest of the South America
-
5. Middle East and Africa
- 5.1. United Arab Emirates
- 5.2. Saudi Arabia
- 5.3. Rest of the Middle East and Africa
Well Intervention Industry REPORT HIGHLIGHTS
| Aspects | Details |
|---|---|
| Study Period | 2019-2033 |
| Base Year | 2024 |
| Estimated Year | 2025 |
| Forecast Period | 2025-2033 |
| Historical Period | 2019-2024 |
| Growth Rate | CAGR of 6.80% from 2019-2033 |
| Segmentation |
|
Table of Contents
- 1. Introduction
- 1.1. Research Scope
- 1.2. Market Segmentation
- 1.3. Research Methodology
- 1.4. Definitions and Assumptions
- 2. Executive Summary
- 2.1. Introduction
- 3. Market Dynamics
- 3.1. Introduction
- 3.2. Market Drivers
- 3.2.1. 4.; Increased Drilling and Completion Activities
- 3.3. Market Restrains
- 3.3.1. 4.; Volatility of Oil Prices
- 3.4. Market Trends
- 3.4.1. Offshore Segment to have a Significant Market Share
- 4. Market Factor Analysis
- 4.1. Porters Five Forces
- 4.2. Supply/Value Chain
- 4.3. PESTEL analysis
- 4.4. Market Entropy
- 4.5. Patent/Trademark Analysis
- 5. Global Well Intervention Industry Analysis, Insights and Forecast, 2019-2031
- 5.1. Market Analysis, Insights and Forecast - by Location of Deployment
- 5.1.1. Onshore
- 5.1.2. Offshore
- 5.2. Market Analysis, Insights and Forecast - by Region
- 5.2.1. North America
- 5.2.2. Europe
- 5.2.3. Asia Pacific
- 5.2.4. South America
- 5.2.5. Middle East and Africa
- 5.1. Market Analysis, Insights and Forecast - by Location of Deployment
- 6. North America Well Intervention Industry Analysis, Insights and Forecast, 2019-2031
- 6.1. Market Analysis, Insights and Forecast - by Location of Deployment
- 6.1.1. Onshore
- 6.1.2. Offshore
- 6.1. Market Analysis, Insights and Forecast - by Location of Deployment
- 7. Europe Well Intervention Industry Analysis, Insights and Forecast, 2019-2031
- 7.1. Market Analysis, Insights and Forecast - by Location of Deployment
- 7.1.1. Onshore
- 7.1.2. Offshore
- 7.1. Market Analysis, Insights and Forecast - by Location of Deployment
- 8. Asia Pacific Well Intervention Industry Analysis, Insights and Forecast, 2019-2031
- 8.1. Market Analysis, Insights and Forecast - by Location of Deployment
- 8.1.1. Onshore
- 8.1.2. Offshore
- 8.1. Market Analysis, Insights and Forecast - by Location of Deployment
- 9. South America Well Intervention Industry Analysis, Insights and Forecast, 2019-2031
- 9.1. Market Analysis, Insights and Forecast - by Location of Deployment
- 9.1.1. Onshore
- 9.1.2. Offshore
- 9.1. Market Analysis, Insights and Forecast - by Location of Deployment
- 10. Middle East and Africa Well Intervention Industry Analysis, Insights and Forecast, 2019-2031
- 10.1. Market Analysis, Insights and Forecast - by Location of Deployment
- 10.1.1. Onshore
- 10.1.2. Offshore
- 10.1. Market Analysis, Insights and Forecast - by Location of Deployment
- 11. North America Well Intervention Industry Analysis, Insights and Forecast, 2019-2031
- 11.1. Market Analysis, Insights and Forecast - By Country/Sub-region
- 11.1.1 United States
- 11.1.2 Canada
- 11.1.3 Mexico
- 12. Europe Well Intervention Industry Analysis, Insights and Forecast, 2019-2031
- 12.1. Market Analysis, Insights and Forecast - By Country/Sub-region
- 12.1.1 Germany
- 12.1.2 United Kingdom
- 12.1.3 France
- 12.1.4 Spain
- 12.1.5 Italy
- 12.1.6 Spain
- 12.1.7 Belgium
- 12.1.8 Netherland
- 12.1.9 Nordics
- 12.1.10 Rest of Europe
- 13. Asia Pacific Well Intervention Industry Analysis, Insights and Forecast, 2019-2031
- 13.1. Market Analysis, Insights and Forecast - By Country/Sub-region
- 13.1.1 China
- 13.1.2 Japan
- 13.1.3 India
- 13.1.4 South Korea
- 13.1.5 Southeast Asia
- 13.1.6 Australia
- 13.1.7 Indonesia
- 13.1.8 Phillipes
- 13.1.9 Singapore
- 13.1.10 Thailandc
- 13.1.11 Rest of Asia Pacific
- 14. South America Well Intervention Industry Analysis, Insights and Forecast, 2019-2031
- 14.1. Market Analysis, Insights and Forecast - By Country/Sub-region
- 14.1.1 Brazil
- 14.1.2 Argentina
- 14.1.3 Peru
- 14.1.4 Chile
- 14.1.5 Colombia
- 14.1.6 Ecuador
- 14.1.7 Venezuela
- 14.1.8 Rest of South America
- 15. MEA Well Intervention Industry Analysis, Insights and Forecast, 2019-2031
- 15.1. Market Analysis, Insights and Forecast - By Country/Sub-region
- 15.1.1 United Arab Emirates
- 15.1.2 Saudi Arabia
- 15.1.3 South Africa
- 15.1.4 Rest of Middle East and Africa
- 16. Competitive Analysis
- 16.1. Global Market Share Analysis 2024
- 16.2. Company Profiles
- 16.2.1 China Oilfield Services Ltd
- 16.2.1.1. Overview
- 16.2.1.2. Products
- 16.2.1.3. SWOT Analysis
- 16.2.1.4. Recent Developments
- 16.2.1.5. Financials (Based on Availability)
- 16.2.2 Vallourec SA
- 16.2.2.1. Overview
- 16.2.2.2. Products
- 16.2.2.3. SWOT Analysis
- 16.2.2.4. Recent Developments
- 16.2.2.5. Financials (Based on Availability)
- 16.2.3 National Oilwell Varco Inc
- 16.2.3.1. Overview
- 16.2.3.2. Products
- 16.2.3.3. SWOT Analysis
- 16.2.3.4. Recent Developments
- 16.2.3.5. Financials (Based on Availability)
- 16.2.4 Baker Hughes Company
- 16.2.4.1. Overview
- 16.2.4.2. Products
- 16.2.4.3. SWOT Analysis
- 16.2.4.4. Recent Developments
- 16.2.4.5. Financials (Based on Availability)
- 16.2.5 Halliburton Company
- 16.2.5.1. Overview
- 16.2.5.2. Products
- 16.2.5.3. SWOT Analysis
- 16.2.5.4. Recent Developments
- 16.2.5.5. Financials (Based on Availability)
- 16.2.6 Weatherford International Ltd
- 16.2.6.1. Overview
- 16.2.6.2. Products
- 16.2.6.3. SWOT Analysis
- 16.2.6.4. Recent Developments
- 16.2.6.5. Financials (Based on Availability)
- 16.2.7 Schlumberger Limited
- 16.2.7.1. Overview
- 16.2.7.2. Products
- 16.2.7.3. SWOT Analysis
- 16.2.7.4. Recent Developments
- 16.2.7.5. Financials (Based on Availability)
- 16.2.8 Scientific Drilling International Inc
- 16.2.8.1. Overview
- 16.2.8.2. Products
- 16.2.8.3. SWOT Analysis
- 16.2.8.4. Recent Developments
- 16.2.8.5. Financials (Based on Availability)
- 16.2.1 China Oilfield Services Ltd
List of Figures
- Figure 1: Global Well Intervention Industry Revenue Breakdown (Million, %) by Region 2024 & 2032
- Figure 2: North America Well Intervention Industry Revenue (Million), by Country 2024 & 2032
- Figure 3: North America Well Intervention Industry Revenue Share (%), by Country 2024 & 2032
- Figure 4: Europe Well Intervention Industry Revenue (Million), by Country 2024 & 2032
- Figure 5: Europe Well Intervention Industry Revenue Share (%), by Country 2024 & 2032
- Figure 6: Asia Pacific Well Intervention Industry Revenue (Million), by Country 2024 & 2032
- Figure 7: Asia Pacific Well Intervention Industry Revenue Share (%), by Country 2024 & 2032
- Figure 8: South America Well Intervention Industry Revenue (Million), by Country 2024 & 2032
- Figure 9: South America Well Intervention Industry Revenue Share (%), by Country 2024 & 2032
- Figure 10: MEA Well Intervention Industry Revenue (Million), by Country 2024 & 2032
- Figure 11: MEA Well Intervention Industry Revenue Share (%), by Country 2024 & 2032
- Figure 12: North America Well Intervention Industry Revenue (Million), by Location of Deployment 2024 & 2032
- Figure 13: North America Well Intervention Industry Revenue Share (%), by Location of Deployment 2024 & 2032
- Figure 14: North America Well Intervention Industry Revenue (Million), by Country 2024 & 2032
- Figure 15: North America Well Intervention Industry Revenue Share (%), by Country 2024 & 2032
- Figure 16: Europe Well Intervention Industry Revenue (Million), by Location of Deployment 2024 & 2032
- Figure 17: Europe Well Intervention Industry Revenue Share (%), by Location of Deployment 2024 & 2032
- Figure 18: Europe Well Intervention Industry Revenue (Million), by Country 2024 & 2032
- Figure 19: Europe Well Intervention Industry Revenue Share (%), by Country 2024 & 2032
- Figure 20: Asia Pacific Well Intervention Industry Revenue (Million), by Location of Deployment 2024 & 2032
- Figure 21: Asia Pacific Well Intervention Industry Revenue Share (%), by Location of Deployment 2024 & 2032
- Figure 22: Asia Pacific Well Intervention Industry Revenue (Million), by Country 2024 & 2032
- Figure 23: Asia Pacific Well Intervention Industry Revenue Share (%), by Country 2024 & 2032
- Figure 24: South America Well Intervention Industry Revenue (Million), by Location of Deployment 2024 & 2032
- Figure 25: South America Well Intervention Industry Revenue Share (%), by Location of Deployment 2024 & 2032
- Figure 26: South America Well Intervention Industry Revenue (Million), by Country 2024 & 2032
- Figure 27: South America Well Intervention Industry Revenue Share (%), by Country 2024 & 2032
- Figure 28: Middle East and Africa Well Intervention Industry Revenue (Million), by Location of Deployment 2024 & 2032
- Figure 29: Middle East and Africa Well Intervention Industry Revenue Share (%), by Location of Deployment 2024 & 2032
- Figure 30: Middle East and Africa Well Intervention Industry Revenue (Million), by Country 2024 & 2032
- Figure 31: Middle East and Africa Well Intervention Industry Revenue Share (%), by Country 2024 & 2032
List of Tables
- Table 1: Global Well Intervention Industry Revenue Million Forecast, by Region 2019 & 2032
- Table 2: Global Well Intervention Industry Revenue Million Forecast, by Location of Deployment 2019 & 2032
- Table 3: Global Well Intervention Industry Revenue Million Forecast, by Region 2019 & 2032
- Table 4: Global Well Intervention Industry Revenue Million Forecast, by Country 2019 & 2032
- Table 5: United States Well Intervention Industry Revenue (Million) Forecast, by Application 2019 & 2032
- Table 6: Canada Well Intervention Industry Revenue (Million) Forecast, by Application 2019 & 2032
- Table 7: Mexico Well Intervention Industry Revenue (Million) Forecast, by Application 2019 & 2032
- Table 8: Global Well Intervention Industry Revenue Million Forecast, by Country 2019 & 2032
- Table 9: Germany Well Intervention Industry Revenue (Million) Forecast, by Application 2019 & 2032
- Table 10: United Kingdom Well Intervention Industry Revenue (Million) Forecast, by Application 2019 & 2032
- Table 11: France Well Intervention Industry Revenue (Million) Forecast, by Application 2019 & 2032
- Table 12: Spain Well Intervention Industry Revenue (Million) Forecast, by Application 2019 & 2032
- Table 13: Italy Well Intervention Industry Revenue (Million) Forecast, by Application 2019 & 2032
- Table 14: Spain Well Intervention Industry Revenue (Million) Forecast, by Application 2019 & 2032
- Table 15: Belgium Well Intervention Industry Revenue (Million) Forecast, by Application 2019 & 2032
- Table 16: Netherland Well Intervention Industry Revenue (Million) Forecast, by Application 2019 & 2032
- Table 17: Nordics Well Intervention Industry Revenue (Million) Forecast, by Application 2019 & 2032
- Table 18: Rest of Europe Well Intervention Industry Revenue (Million) Forecast, by Application 2019 & 2032
- Table 19: Global Well Intervention Industry Revenue Million Forecast, by Country 2019 & 2032
- Table 20: China Well Intervention Industry Revenue (Million) Forecast, by Application 2019 & 2032
- Table 21: Japan Well Intervention Industry Revenue (Million) Forecast, by Application 2019 & 2032
- Table 22: India Well Intervention Industry Revenue (Million) Forecast, by Application 2019 & 2032
- Table 23: South Korea Well Intervention Industry Revenue (Million) Forecast, by Application 2019 & 2032
- Table 24: Southeast Asia Well Intervention Industry Revenue (Million) Forecast, by Application 2019 & 2032
- Table 25: Australia Well Intervention Industry Revenue (Million) Forecast, by Application 2019 & 2032
- Table 26: Indonesia Well Intervention Industry Revenue (Million) Forecast, by Application 2019 & 2032
- Table 27: Phillipes Well Intervention Industry Revenue (Million) Forecast, by Application 2019 & 2032
- Table 28: Singapore Well Intervention Industry Revenue (Million) Forecast, by Application 2019 & 2032
- Table 29: Thailandc Well Intervention Industry Revenue (Million) Forecast, by Application 2019 & 2032
- Table 30: Rest of Asia Pacific Well Intervention Industry Revenue (Million) Forecast, by Application 2019 & 2032
- Table 31: Global Well Intervention Industry Revenue Million Forecast, by Country 2019 & 2032
- Table 32: Brazil Well Intervention Industry Revenue (Million) Forecast, by Application 2019 & 2032
- Table 33: Argentina Well Intervention Industry Revenue (Million) Forecast, by Application 2019 & 2032
- Table 34: Peru Well Intervention Industry Revenue (Million) Forecast, by Application 2019 & 2032
- Table 35: Chile Well Intervention Industry Revenue (Million) Forecast, by Application 2019 & 2032
- Table 36: Colombia Well Intervention Industry Revenue (Million) Forecast, by Application 2019 & 2032
- Table 37: Ecuador Well Intervention Industry Revenue (Million) Forecast, by Application 2019 & 2032
- Table 38: Venezuela Well Intervention Industry Revenue (Million) Forecast, by Application 2019 & 2032
- Table 39: Rest of South America Well Intervention Industry Revenue (Million) Forecast, by Application 2019 & 2032
- Table 40: Global Well Intervention Industry Revenue Million Forecast, by Country 2019 & 2032
- Table 41: United Arab Emirates Well Intervention Industry Revenue (Million) Forecast, by Application 2019 & 2032
- Table 42: Saudi Arabia Well Intervention Industry Revenue (Million) Forecast, by Application 2019 & 2032
- Table 43: South Africa Well Intervention Industry Revenue (Million) Forecast, by Application 2019 & 2032
- Table 44: Rest of Middle East and Africa Well Intervention Industry Revenue (Million) Forecast, by Application 2019 & 2032
- Table 45: Global Well Intervention Industry Revenue Million Forecast, by Location of Deployment 2019 & 2032
- Table 46: Global Well Intervention Industry Revenue Million Forecast, by Country 2019 & 2032
- Table 47: United States of America Well Intervention Industry Revenue (Million) Forecast, by Application 2019 & 2032
- Table 48: Canada Well Intervention Industry Revenue (Million) Forecast, by Application 2019 & 2032
- Table 49: Rest of the North America Well Intervention Industry Revenue (Million) Forecast, by Application 2019 & 2032
- Table 50: Global Well Intervention Industry Revenue Million Forecast, by Location of Deployment 2019 & 2032
- Table 51: Global Well Intervention Industry Revenue Million Forecast, by Country 2019 & 2032
- Table 52: United Kingdom Well Intervention Industry Revenue (Million) Forecast, by Application 2019 & 2032
- Table 53: France Well Intervention Industry Revenue (Million) Forecast, by Application 2019 & 2032
- Table 54: Germany Well Intervention Industry Revenue (Million) Forecast, by Application 2019 & 2032
- Table 55: Italy Well Intervention Industry Revenue (Million) Forecast, by Application 2019 & 2032
- Table 56: Rest of the Europe Well Intervention Industry Revenue (Million) Forecast, by Application 2019 & 2032
- Table 57: Global Well Intervention Industry Revenue Million Forecast, by Location of Deployment 2019 & 2032
- Table 58: Global Well Intervention Industry Revenue Million Forecast, by Country 2019 & 2032
- Table 59: China Well Intervention Industry Revenue (Million) Forecast, by Application 2019 & 2032
- Table 60: India Well Intervention Industry Revenue (Million) Forecast, by Application 2019 & 2032
- Table 61: South Korea Well Intervention Industry Revenue (Million) Forecast, by Application 2019 & 2032
- Table 62: Rest of the Asia Pacific Well Intervention Industry Revenue (Million) Forecast, by Application 2019 & 2032
- Table 63: Global Well Intervention Industry Revenue Million Forecast, by Location of Deployment 2019 & 2032
- Table 64: Global Well Intervention Industry Revenue Million Forecast, by Country 2019 & 2032
- Table 65: Brazil Well Intervention Industry Revenue (Million) Forecast, by Application 2019 & 2032
- Table 66: Argentina Well Intervention Industry Revenue (Million) Forecast, by Application 2019 & 2032
- Table 67: Rest of the South America Well Intervention Industry Revenue (Million) Forecast, by Application 2019 & 2032
- Table 68: Global Well Intervention Industry Revenue Million Forecast, by Location of Deployment 2019 & 2032
- Table 69: Global Well Intervention Industry Revenue Million Forecast, by Country 2019 & 2032
- Table 70: United Arab Emirates Well Intervention Industry Revenue (Million) Forecast, by Application 2019 & 2032
- Table 71: Saudi Arabia Well Intervention Industry Revenue (Million) Forecast, by Application 2019 & 2032
- Table 72: Rest of the Middle East and Africa Well Intervention Industry Revenue (Million) Forecast, by Application 2019 & 2032
Frequently Asked Questions
1. What is the projected Compound Annual Growth Rate (CAGR) of the Well Intervention Industry?
The projected CAGR is approximately 6.80%.
2. Which companies are prominent players in the Well Intervention Industry?
Key companies in the market include China Oilfield Services Ltd, Vallourec SA, National Oilwell Varco Inc, Baker Hughes Company, Halliburton Company, Weatherford International Ltd, Schlumberger Limited, Scientific Drilling International Inc.
3. What are the main segments of the Well Intervention Industry?
The market segments include Location of Deployment.
4. Can you provide details about the market size?
The market size is estimated to be USD 8.49 Million as of 2022.
5. What are some drivers contributing to market growth?
4.; Increased Drilling and Completion Activities.
6. What are the notable trends driving market growth?
Offshore Segment to have a Significant Market Share.
7. Are there any restraints impacting market growth?
4.; Volatility of Oil Prices.
8. Can you provide examples of recent developments in the market?
In May 2023, TechnipFMC got a contract from Equinor to provide riserless light well intervention (RLWI) services on the Norwegian Continental Shelf. The contract includes production enhancement, production data, and pre-plug-and-abandonment services with a time bond from 2024 to 2025, with options to extend for the three subsequent years.
9. What pricing options are available for accessing the report?
Pricing options include single-user, multi-user, and enterprise licenses priced at USD 4750, USD 5250, and USD 8750 respectively.
10. Is the market size provided in terms of value or volume?
The market size is provided in terms of value, measured in Million.
11. Are there any specific market keywords associated with the report?
Yes, the market keyword associated with the report is "Well Intervention Industry," which aids in identifying and referencing the specific market segment covered.
12. How do I determine which pricing option suits my needs best?
The pricing options vary based on user requirements and access needs. Individual users may opt for single-user licenses, while businesses requiring broader access may choose multi-user or enterprise licenses for cost-effective access to the report.
13. Are there any additional resources or data provided in the Well Intervention Industry report?
While the report offers comprehensive insights, it's advisable to review the specific contents or supplementary materials provided to ascertain if additional resources or data are available.
14. How can I stay updated on further developments or reports in the Well Intervention Industry?
To stay informed about further developments, trends, and reports in the Well Intervention Industry, consider subscribing to industry newsletters, following relevant companies and organizations, or regularly checking reputable industry news sources and publications.
Methodology
Step 1 - Identification of Relevant Samples Size from Population Database


Step 2 - Approaches for Defining Global Market Size (Value, Volume* & Price*)

Note*: In applicable scenarios
Step 3 - Data Sources
Primary Research
- Web Analytics
- Survey Reports
- Research Institute
- Latest Research Reports
- Opinion Leaders
Secondary Research
- Annual Reports
- White Paper
- Latest Press Release
- Industry Association
- Paid Database
- Investor Presentations

Step 4 - Data Triangulation
Involves using different sources of information in order to increase the validity of a study
These sources are likely to be stakeholders in a program - participants, other researchers, program staff, other community members, and so on.
Then we put all data in single framework & apply various statistical tools to find out the dynamic on the market.
During the analysis stage, feedback from the stakeholder groups would be compared to determine areas of agreement as well as areas of divergence


