
Key Insights
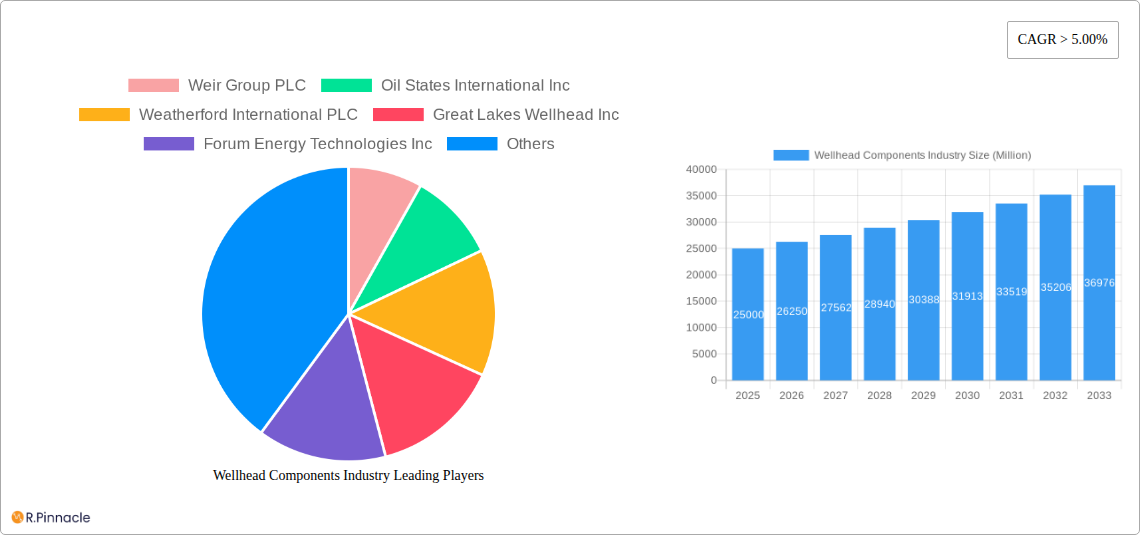
The global wellhead components market is experiencing robust growth, driven by the increasing demand for oil and gas exploration and production activities worldwide. A CAGR exceeding 5% indicates a consistently expanding market, projected to reach substantial value by 2033. Key drivers include rising energy consumption, particularly in developing economies, coupled with ongoing investments in offshore and unconventional resource extraction. Technological advancements, such as the adoption of intelligent wellhead systems and improved materials for enhanced durability and performance, further contribute to market expansion. While geopolitical instability and fluctuating energy prices pose potential restraints, the long-term outlook remains positive, fueled by sustained demand and technological innovation. The market segmentation reveals a significant share held by onshore operations, although offshore segments are witnessing considerable growth owing to discoveries in deepwater and ultra-deepwater regions. Major players like Weir Group PLC, Schlumberger Limited, and Baker Hughes Company are leading the market, continuously developing advanced wellhead components and expanding their global presence through strategic partnerships and acquisitions. The competitive landscape is characterized by technological innovation and a focus on providing customized solutions to meet the specific needs of oil and gas operators. Growth is expected to be geographically diverse, with North America and the Asia-Pacific region expected to remain key markets due to significant oil and gas production activities and robust infrastructure development.
Within the wellhead component segment, casing heads, tubing heads, and casing hangers command significant market shares due to their critical role in well integrity and safety. The increasing complexity of well designs, especially in harsh environments like deepwater and unconventional reservoirs, fuels the demand for advanced and specialized components. This trend necessitates significant research and development investments by market players focused on improving efficiency, longevity, and operational safety. Regional variations in growth trajectory are influenced by factors including regulatory frameworks, exploration activities, and the presence of established oil and gas infrastructure. Future market growth will likely be influenced by the adoption of sustainable drilling practices, the exploration of new energy resources, and advancements in automation and digitalization within the oil and gas industry. Continued investment in research and development, alongside collaborations between manufacturers and oil and gas operators, will be crucial for sustaining market momentum and driving further innovation in wellhead component technology.
Wellhead Components Industry Market Report: 2019-2033
This comprehensive report provides an in-depth analysis of the Wellhead Components industry, offering actionable insights for industry professionals. With a study period spanning 2019-2033, a base year of 2025, and a forecast period of 2025-2033, this report is your essential guide to navigating this dynamic market. The report covers a market valued at $XX Million in 2025, projected to reach $XX Million by 2033.
Wellhead Components Industry Market Structure & Innovation Trends
The Wellhead Components market is characterized by a moderately consolidated structure, with key players including Weir Group PLC, Oil States International Inc, Weatherford International PLC, Great Lakes Wellhead Inc, Forum Energy Technologies Inc, Baker Hughes Company, Cactus Wellhead LLC, Schlumberger Limited, NOV Inc, and TechnipFMC PLC. However, numerous smaller specialized companies also contribute significantly. Market share data reveals that the top five players account for approximately XX% of the global market, while the remaining market share is distributed among a diverse range of companies.
Innovation in the industry is driven by the need for enhanced well integrity, improved efficiency, and reduced operational costs. This is reflected in the development of advanced materials, sophisticated designs, and automation technologies. Stringent regulatory frameworks, particularly concerning safety and environmental protection, significantly influence the design and manufacturing of wellhead components. Furthermore, the substitution of traditional materials with more robust and corrosion-resistant materials is gaining momentum. The industry is witnessing a steady increase in mergers and acquisitions (M&A) activities. Recent deals, totaling an estimated $XX Million in value during 2019-2024, indicate a trend of consolidation and expansion of existing players. The end-user demographics are primarily oil and gas exploration and production companies, operating both onshore and offshore.
- Market Concentration: Moderately consolidated, with top 5 players holding approximately XX% market share.
- Innovation Drivers: Enhanced well integrity, efficiency gains, cost reduction.
- Regulatory Frameworks: Stringent safety and environmental regulations.
- Product Substitutes: Advanced materials replacing traditional ones.
- M&A Activity: Significant consolidation, with $XX Million in deals (2019-2024).
- End-Users: Oil and gas exploration and production companies (onshore and offshore).
Wellhead Components Industry Market Dynamics & Trends
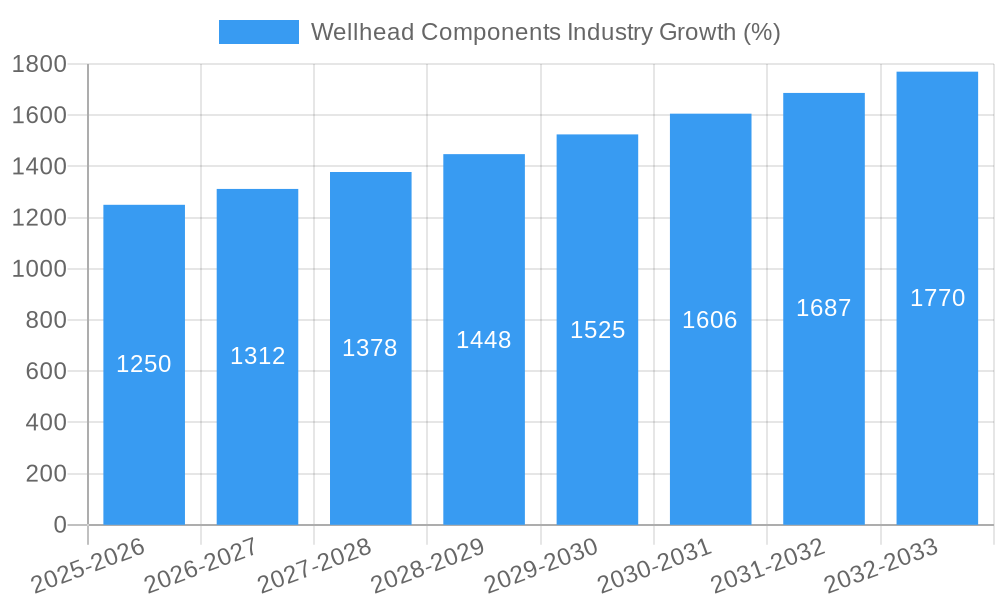
The Wellhead Components market is experiencing robust growth, driven by increasing global energy demand and the ongoing expansion of oil and gas exploration and production activities, particularly in unconventional resources. The compound annual growth rate (CAGR) is estimated at XX% during the forecast period (2025-2033). This growth is further fueled by technological advancements leading to improved drilling efficiency and the adoption of automation in wellhead operations. Market penetration is high in mature oil and gas regions but is expanding rapidly in emerging markets as exploration activities intensify. Competitive dynamics are intense, with companies investing heavily in research and development to enhance product offerings and gain a competitive edge. The industry is also witnessing a shift towards sustainable practices, driven by environmental concerns and regulatory pressure.
Dominant Regions & Segments in Wellhead Components Industry
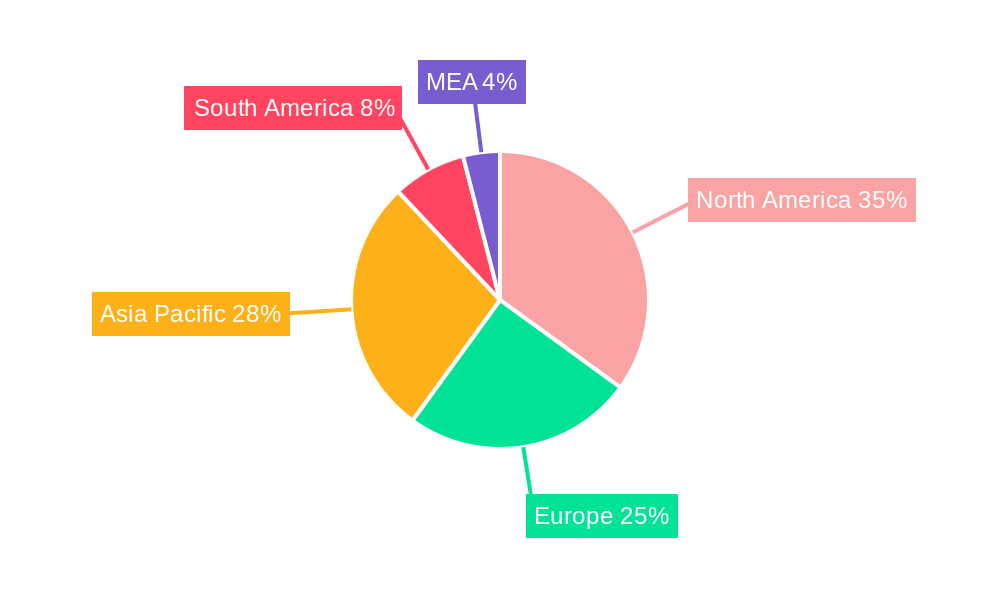
The Offshore segment dominates the Wellhead Components market, driven by the increasing demand for deepwater and ultra-deepwater drilling activities. The North American region, particularly the United States and Canada, holds a significant market share due to its established oil and gas infrastructure and ongoing exploration activities. However, the Middle East and Asia-Pacific regions are demonstrating significant growth potential.
- Leading Region: North America (United States and Canada)
- Leading Segment: Offshore
- Key Drivers (North America): Established oil and gas infrastructure, ongoing exploration activities.
- Key Drivers (Middle East & Asia-Pacific): Rising energy demand, expanding exploration & production.
- Key Drivers (Offshore): Deepwater & ultra-deepwater drilling activities
Wellhead Component Segment Analysis: Casing heads and tubing heads constitute the largest segments, followed by casing spools and casing hangers. The "Other Wellhead Components" segment encompasses a range of specialized components with varying market dynamics and growth projections.
Wellhead Components Industry Product Innovations
Recent innovations focus on materials that enhance corrosion resistance, pressure handling capabilities, and operational longevity. The industry is actively incorporating advanced technologies like remote monitoring systems and automated control mechanisms. New product designs focus on streamlining installation, reducing maintenance requirements, and optimizing overall well performance. The focus is on increasing safety and efficiency, which directly translates to lower operational costs and improved environmental compliance.
Report Scope & Segmentation Analysis
This report segments the Wellhead Components market by wellhead component type (Casing Heads, Casing Spools, Tubing Heads, Casing Hangers, Secondary Seals, Tubing Hangers, Other Wellhead Components) and by location (Onshore, Offshore). Each segment's growth projections, market size, and competitive dynamics are thoroughly analyzed within the report. For instance, the Casing Heads segment is projected to experience a CAGR of XX% driven by the increasing demand for deepwater drilling, while the Onshore segment is expected to maintain steady growth based on the expansion of onshore exploration and production activities.
Key Drivers of Wellhead Components Industry Growth
The Wellhead Components industry’s growth is driven by several factors. Firstly, increasing global energy demand necessitates enhanced oil and gas exploration and production. Secondly, technological advancements such as improved drilling techniques and automation lead to increased efficiency and reduced operational costs. Thirdly, government policies and regulations promoting energy security often spur investment in oil and gas exploration, further stimulating the demand for wellhead components.
Challenges in the Wellhead Components Industry Sector
The Wellhead Components industry faces challenges such as fluctuating oil and gas prices that impact investment decisions. Supply chain disruptions due to geopolitical events or natural disasters can affect the availability of raw materials and components. Furthermore, intense competition from numerous established players and new entrants demands ongoing innovation and cost optimization to maintain profitability.
Emerging Opportunities in Wellhead Components Industry
The growing emphasis on unconventional resources exploration, such as shale gas and tight oil, presents significant opportunities. Advancements in subsea technologies and the development of deepwater fields create new market segments. Finally, the focus on sustainable practices opens avenues for eco-friendly and energy-efficient wellhead component designs.
Leading Players in the Wellhead Components Industry Market
- Weir Group PLC
- Oil States International Inc
- Weatherford International PLC
- Great Lakes Wellhead Inc
- Forum Energy Technologies Inc
- Baker Hughes Company
- Cactus Wellhead LLC
- Schlumberger Limited
- NOV Inc
- TechnipFMC PLC
Key Developments in Wellhead Components Industry
- February 2021: TechnipFMC's subsidiary secures a substantial contract for the Limbayong deepwater development project in Malaysia.
- March 2021: Dril-Quip, Inc. wins a two-year contract for subsea wellhead systems from BP.
- December 2021: Plexus Holdings PLC receives a purchase order for its 'POS-GRIP' wellhead system.
Future Outlook for Wellhead Components Industry Market
The Wellhead Components market is poised for continued growth, driven by long-term projections for global energy demand and the ongoing expansion of exploration and production activities in both established and emerging markets. Strategic investments in research and development, focusing on innovation and technological advancements, will be crucial for companies seeking to capitalize on this growth potential. The market will also see increasing demand for sustainable and environmentally friendly solutions, shaping future product development and industry practices.
Wellhead Components Industry Segmentation
-
1. Wellhead Component
- 1.1. Casing Heads
- 1.2. Casing Spools
- 1.3. Tubing Heads
- 1.4. Casing Hangers
- 1.5. Secondary Seals
- 1.6. Tubing Hangers
- 1.7. Other Wellhead Components
-
2. Location
- 2.1. Onshore
- 2.2. Offshore
Wellhead Components Industry Segmentation By Geography
- 1. North America
- 2. Europe
- 3. Asia Pacific
- 4. South America
- 5. Middle East and Africa
Wellhead Components Industry REPORT HIGHLIGHTS
| Aspects | Details |
|---|---|
| Study Period | 2019-2033 |
| Base Year | 2024 |
| Estimated Year | 2025 |
| Forecast Period | 2025-2033 |
| Historical Period | 2019-2024 |
| Growth Rate | CAGR of > 5.00% from 2019-2033 |
| Segmentation |
|
Table of Contents
- 1. Introduction
- 1.1. Research Scope
- 1.2. Market Segmentation
- 1.3. Research Methodology
- 1.4. Definitions and Assumptions
- 2. Executive Summary
- 2.1. Introduction
- 3. Market Dynamics
- 3.1. Introduction
- 3.2. Market Drivers
- 3.2.1. 4.; The Rise in Oil and Gas Drilling Activities4.; Increased Shale Gas Exploration
- 3.3. Market Restrains
- 3.3.1. 4.; Increasing Share of Renewable Energy
- 3.4. Market Trends
- 3.4.1. Onshore Segment to Dominate the Market
- 4. Market Factor Analysis
- 4.1. Porters Five Forces
- 4.2. Supply/Value Chain
- 4.3. PESTEL analysis
- 4.4. Market Entropy
- 4.5. Patent/Trademark Analysis
- 5. Global Wellhead Components Industry Analysis, Insights and Forecast, 2019-2031
- 5.1. Market Analysis, Insights and Forecast - by Wellhead Component
- 5.1.1. Casing Heads
- 5.1.2. Casing Spools
- 5.1.3. Tubing Heads
- 5.1.4. Casing Hangers
- 5.1.5. Secondary Seals
- 5.1.6. Tubing Hangers
- 5.1.7. Other Wellhead Components
- 5.2. Market Analysis, Insights and Forecast - by Location
- 5.2.1. Onshore
- 5.2.2. Offshore
- 5.3. Market Analysis, Insights and Forecast - by Region
- 5.3.1. North America
- 5.3.2. Europe
- 5.3.3. Asia Pacific
- 5.3.4. South America
- 5.3.5. Middle East and Africa
- 5.1. Market Analysis, Insights and Forecast - by Wellhead Component
- 6. North America Wellhead Components Industry Analysis, Insights and Forecast, 2019-2031
- 6.1. Market Analysis, Insights and Forecast - by Wellhead Component
- 6.1.1. Casing Heads
- 6.1.2. Casing Spools
- 6.1.3. Tubing Heads
- 6.1.4. Casing Hangers
- 6.1.5. Secondary Seals
- 6.1.6. Tubing Hangers
- 6.1.7. Other Wellhead Components
- 6.2. Market Analysis, Insights and Forecast - by Location
- 6.2.1. Onshore
- 6.2.2. Offshore
- 6.1. Market Analysis, Insights and Forecast - by Wellhead Component
- 7. Europe Wellhead Components Industry Analysis, Insights and Forecast, 2019-2031
- 7.1. Market Analysis, Insights and Forecast - by Wellhead Component
- 7.1.1. Casing Heads
- 7.1.2. Casing Spools
- 7.1.3. Tubing Heads
- 7.1.4. Casing Hangers
- 7.1.5. Secondary Seals
- 7.1.6. Tubing Hangers
- 7.1.7. Other Wellhead Components
- 7.2. Market Analysis, Insights and Forecast - by Location
- 7.2.1. Onshore
- 7.2.2. Offshore
- 7.1. Market Analysis, Insights and Forecast - by Wellhead Component
- 8. Asia Pacific Wellhead Components Industry Analysis, Insights and Forecast, 2019-2031
- 8.1. Market Analysis, Insights and Forecast - by Wellhead Component
- 8.1.1. Casing Heads
- 8.1.2. Casing Spools
- 8.1.3. Tubing Heads
- 8.1.4. Casing Hangers
- 8.1.5. Secondary Seals
- 8.1.6. Tubing Hangers
- 8.1.7. Other Wellhead Components
- 8.2. Market Analysis, Insights and Forecast - by Location
- 8.2.1. Onshore
- 8.2.2. Offshore
- 8.1. Market Analysis, Insights and Forecast - by Wellhead Component
- 9. South America Wellhead Components Industry Analysis, Insights and Forecast, 2019-2031
- 9.1. Market Analysis, Insights and Forecast - by Wellhead Component
- 9.1.1. Casing Heads
- 9.1.2. Casing Spools
- 9.1.3. Tubing Heads
- 9.1.4. Casing Hangers
- 9.1.5. Secondary Seals
- 9.1.6. Tubing Hangers
- 9.1.7. Other Wellhead Components
- 9.2. Market Analysis, Insights and Forecast - by Location
- 9.2.1. Onshore
- 9.2.2. Offshore
- 9.1. Market Analysis, Insights and Forecast - by Wellhead Component
- 10. Middle East and Africa Wellhead Components Industry Analysis, Insights and Forecast, 2019-2031
- 10.1. Market Analysis, Insights and Forecast - by Wellhead Component
- 10.1.1. Casing Heads
- 10.1.2. Casing Spools
- 10.1.3. Tubing Heads
- 10.1.4. Casing Hangers
- 10.1.5. Secondary Seals
- 10.1.6. Tubing Hangers
- 10.1.7. Other Wellhead Components
- 10.2. Market Analysis, Insights and Forecast - by Location
- 10.2.1. Onshore
- 10.2.2. Offshore
- 10.1. Market Analysis, Insights and Forecast - by Wellhead Component
- 11. North America Wellhead Components Industry Analysis, Insights and Forecast, 2019-2031
- 11.1. Market Analysis, Insights and Forecast - By Country/Sub-region
- 11.1.1 United States
- 11.1.2 Canada
- 11.1.3 Mexico
- 12. Europe Wellhead Components Industry Analysis, Insights and Forecast, 2019-2031
- 12.1. Market Analysis, Insights and Forecast - By Country/Sub-region
- 12.1.1 Germany
- 12.1.2 United Kingdom
- 12.1.3 France
- 12.1.4 Spain
- 12.1.5 Italy
- 12.1.6 Spain
- 12.1.7 Belgium
- 12.1.8 Netherland
- 12.1.9 Nordics
- 12.1.10 Rest of Europe
- 13. Asia Pacific Wellhead Components Industry Analysis, Insights and Forecast, 2019-2031
- 13.1. Market Analysis, Insights and Forecast - By Country/Sub-region
- 13.1.1 China
- 13.1.2 Japan
- 13.1.3 India
- 13.1.4 South Korea
- 13.1.5 Southeast Asia
- 13.1.6 Australia
- 13.1.7 Indonesia
- 13.1.8 Phillipes
- 13.1.9 Singapore
- 13.1.10 Thailandc
- 13.1.11 Rest of Asia Pacific
- 14. South America Wellhead Components Industry Analysis, Insights and Forecast, 2019-2031
- 14.1. Market Analysis, Insights and Forecast - By Country/Sub-region
- 14.1.1 Brazil
- 14.1.2 Argentina
- 14.1.3 Peru
- 14.1.4 Chile
- 14.1.5 Colombia
- 14.1.6 Ecuador
- 14.1.7 Venezuela
- 14.1.8 Rest of South America
- 15. North America Wellhead Components Industry Analysis, Insights and Forecast, 2019-2031
- 15.1. Market Analysis, Insights and Forecast - By Country/Sub-region
- 15.1.1 United States
- 15.1.2 Canada
- 15.1.3 Mexico
- 16. MEA Wellhead Components Industry Analysis, Insights and Forecast, 2019-2031
- 16.1. Market Analysis, Insights and Forecast - By Country/Sub-region
- 16.1.1 United Arab Emirates
- 16.1.2 Saudi Arabia
- 16.1.3 South Africa
- 16.1.4 Rest of Middle East and Africa
- 17. Competitive Analysis
- 17.1. Global Market Share Analysis 2024
- 17.2. Company Profiles
- 17.2.1 Weir Group PLC
- 17.2.1.1. Overview
- 17.2.1.2. Products
- 17.2.1.3. SWOT Analysis
- 17.2.1.4. Recent Developments
- 17.2.1.5. Financials (Based on Availability)
- 17.2.2 Oil States International Inc
- 17.2.2.1. Overview
- 17.2.2.2. Products
- 17.2.2.3. SWOT Analysis
- 17.2.2.4. Recent Developments
- 17.2.2.5. Financials (Based on Availability)
- 17.2.3 Weatherford International PLC
- 17.2.3.1. Overview
- 17.2.3.2. Products
- 17.2.3.3. SWOT Analysis
- 17.2.3.4. Recent Developments
- 17.2.3.5. Financials (Based on Availability)
- 17.2.4 Great Lakes Wellhead Inc
- 17.2.4.1. Overview
- 17.2.4.2. Products
- 17.2.4.3. SWOT Analysis
- 17.2.4.4. Recent Developments
- 17.2.4.5. Financials (Based on Availability)
- 17.2.5 Forum Energy Technologies Inc
- 17.2.5.1. Overview
- 17.2.5.2. Products
- 17.2.5.3. SWOT Analysis
- 17.2.5.4. Recent Developments
- 17.2.5.5. Financials (Based on Availability)
- 17.2.6 Baker Hughes Company
- 17.2.6.1. Overview
- 17.2.6.2. Products
- 17.2.6.3. SWOT Analysis
- 17.2.6.4. Recent Developments
- 17.2.6.5. Financials (Based on Availability)
- 17.2.7 Cactus Wellhead LLC*List Not Exhaustive
- 17.2.7.1. Overview
- 17.2.7.2. Products
- 17.2.7.3. SWOT Analysis
- 17.2.7.4. Recent Developments
- 17.2.7.5. Financials (Based on Availability)
- 17.2.8 Schlumberger Limited
- 17.2.8.1. Overview
- 17.2.8.2. Products
- 17.2.8.3. SWOT Analysis
- 17.2.8.4. Recent Developments
- 17.2.8.5. Financials (Based on Availability)
- 17.2.9 NOV Inc
- 17.2.9.1. Overview
- 17.2.9.2. Products
- 17.2.9.3. SWOT Analysis
- 17.2.9.4. Recent Developments
- 17.2.9.5. Financials (Based on Availability)
- 17.2.10 TechnipFMC PLC
- 17.2.10.1. Overview
- 17.2.10.2. Products
- 17.2.10.3. SWOT Analysis
- 17.2.10.4. Recent Developments
- 17.2.10.5. Financials (Based on Availability)
- 17.2.1 Weir Group PLC
List of Figures
- Figure 1: Global Wellhead Components Industry Revenue Breakdown (Million, %) by Region 2024 & 2032
- Figure 2: North America Wellhead Components Industry Revenue (Million), by Country 2024 & 2032
- Figure 3: North America Wellhead Components Industry Revenue Share (%), by Country 2024 & 2032
- Figure 4: Europe Wellhead Components Industry Revenue (Million), by Country 2024 & 2032
- Figure 5: Europe Wellhead Components Industry Revenue Share (%), by Country 2024 & 2032
- Figure 6: Asia Pacific Wellhead Components Industry Revenue (Million), by Country 2024 & 2032
- Figure 7: Asia Pacific Wellhead Components Industry Revenue Share (%), by Country 2024 & 2032
- Figure 8: South America Wellhead Components Industry Revenue (Million), by Country 2024 & 2032
- Figure 9: South America Wellhead Components Industry Revenue Share (%), by Country 2024 & 2032
- Figure 10: North America Wellhead Components Industry Revenue (Million), by Country 2024 & 2032
- Figure 11: North America Wellhead Components Industry Revenue Share (%), by Country 2024 & 2032
- Figure 12: MEA Wellhead Components Industry Revenue (Million), by Country 2024 & 2032
- Figure 13: MEA Wellhead Components Industry Revenue Share (%), by Country 2024 & 2032
- Figure 14: North America Wellhead Components Industry Revenue (Million), by Wellhead Component 2024 & 2032
- Figure 15: North America Wellhead Components Industry Revenue Share (%), by Wellhead Component 2024 & 2032
- Figure 16: North America Wellhead Components Industry Revenue (Million), by Location 2024 & 2032
- Figure 17: North America Wellhead Components Industry Revenue Share (%), by Location 2024 & 2032
- Figure 18: North America Wellhead Components Industry Revenue (Million), by Country 2024 & 2032
- Figure 19: North America Wellhead Components Industry Revenue Share (%), by Country 2024 & 2032
- Figure 20: Europe Wellhead Components Industry Revenue (Million), by Wellhead Component 2024 & 2032
- Figure 21: Europe Wellhead Components Industry Revenue Share (%), by Wellhead Component 2024 & 2032
- Figure 22: Europe Wellhead Components Industry Revenue (Million), by Location 2024 & 2032
- Figure 23: Europe Wellhead Components Industry Revenue Share (%), by Location 2024 & 2032
- Figure 24: Europe Wellhead Components Industry Revenue (Million), by Country 2024 & 2032
- Figure 25: Europe Wellhead Components Industry Revenue Share (%), by Country 2024 & 2032
- Figure 26: Asia Pacific Wellhead Components Industry Revenue (Million), by Wellhead Component 2024 & 2032
- Figure 27: Asia Pacific Wellhead Components Industry Revenue Share (%), by Wellhead Component 2024 & 2032
- Figure 28: Asia Pacific Wellhead Components Industry Revenue (Million), by Location 2024 & 2032
- Figure 29: Asia Pacific Wellhead Components Industry Revenue Share (%), by Location 2024 & 2032
- Figure 30: Asia Pacific Wellhead Components Industry Revenue (Million), by Country 2024 & 2032
- Figure 31: Asia Pacific Wellhead Components Industry Revenue Share (%), by Country 2024 & 2032
- Figure 32: South America Wellhead Components Industry Revenue (Million), by Wellhead Component 2024 & 2032
- Figure 33: South America Wellhead Components Industry Revenue Share (%), by Wellhead Component 2024 & 2032
- Figure 34: South America Wellhead Components Industry Revenue (Million), by Location 2024 & 2032
- Figure 35: South America Wellhead Components Industry Revenue Share (%), by Location 2024 & 2032
- Figure 36: South America Wellhead Components Industry Revenue (Million), by Country 2024 & 2032
- Figure 37: South America Wellhead Components Industry Revenue Share (%), by Country 2024 & 2032
- Figure 38: Middle East and Africa Wellhead Components Industry Revenue (Million), by Wellhead Component 2024 & 2032
- Figure 39: Middle East and Africa Wellhead Components Industry Revenue Share (%), by Wellhead Component 2024 & 2032
- Figure 40: Middle East and Africa Wellhead Components Industry Revenue (Million), by Location 2024 & 2032
- Figure 41: Middle East and Africa Wellhead Components Industry Revenue Share (%), by Location 2024 & 2032
- Figure 42: Middle East and Africa Wellhead Components Industry Revenue (Million), by Country 2024 & 2032
- Figure 43: Middle East and Africa Wellhead Components Industry Revenue Share (%), by Country 2024 & 2032
List of Tables
- Table 1: Global Wellhead Components Industry Revenue Million Forecast, by Region 2019 & 2032
- Table 2: Global Wellhead Components Industry Revenue Million Forecast, by Wellhead Component 2019 & 2032
- Table 3: Global Wellhead Components Industry Revenue Million Forecast, by Location 2019 & 2032
- Table 4: Global Wellhead Components Industry Revenue Million Forecast, by Region 2019 & 2032
- Table 5: Global Wellhead Components Industry Revenue Million Forecast, by Country 2019 & 2032
- Table 6: United States Wellhead Components Industry Revenue (Million) Forecast, by Application 2019 & 2032
- Table 7: Canada Wellhead Components Industry Revenue (Million) Forecast, by Application 2019 & 2032
- Table 8: Mexico Wellhead Components Industry Revenue (Million) Forecast, by Application 2019 & 2032
- Table 9: Global Wellhead Components Industry Revenue Million Forecast, by Country 2019 & 2032
- Table 10: Germany Wellhead Components Industry Revenue (Million) Forecast, by Application 2019 & 2032
- Table 11: United Kingdom Wellhead Components Industry Revenue (Million) Forecast, by Application 2019 & 2032
- Table 12: France Wellhead Components Industry Revenue (Million) Forecast, by Application 2019 & 2032
- Table 13: Spain Wellhead Components Industry Revenue (Million) Forecast, by Application 2019 & 2032
- Table 14: Italy Wellhead Components Industry Revenue (Million) Forecast, by Application 2019 & 2032
- Table 15: Spain Wellhead Components Industry Revenue (Million) Forecast, by Application 2019 & 2032
- Table 16: Belgium Wellhead Components Industry Revenue (Million) Forecast, by Application 2019 & 2032
- Table 17: Netherland Wellhead Components Industry Revenue (Million) Forecast, by Application 2019 & 2032
- Table 18: Nordics Wellhead Components Industry Revenue (Million) Forecast, by Application 2019 & 2032
- Table 19: Rest of Europe Wellhead Components Industry Revenue (Million) Forecast, by Application 2019 & 2032
- Table 20: Global Wellhead Components Industry Revenue Million Forecast, by Country 2019 & 2032
- Table 21: China Wellhead Components Industry Revenue (Million) Forecast, by Application 2019 & 2032
- Table 22: Japan Wellhead Components Industry Revenue (Million) Forecast, by Application 2019 & 2032
- Table 23: India Wellhead Components Industry Revenue (Million) Forecast, by Application 2019 & 2032
- Table 24: South Korea Wellhead Components Industry Revenue (Million) Forecast, by Application 2019 & 2032
- Table 25: Southeast Asia Wellhead Components Industry Revenue (Million) Forecast, by Application 2019 & 2032
- Table 26: Australia Wellhead Components Industry Revenue (Million) Forecast, by Application 2019 & 2032
- Table 27: Indonesia Wellhead Components Industry Revenue (Million) Forecast, by Application 2019 & 2032
- Table 28: Phillipes Wellhead Components Industry Revenue (Million) Forecast, by Application 2019 & 2032
- Table 29: Singapore Wellhead Components Industry Revenue (Million) Forecast, by Application 2019 & 2032
- Table 30: Thailandc Wellhead Components Industry Revenue (Million) Forecast, by Application 2019 & 2032
- Table 31: Rest of Asia Pacific Wellhead Components Industry Revenue (Million) Forecast, by Application 2019 & 2032
- Table 32: Global Wellhead Components Industry Revenue Million Forecast, by Country 2019 & 2032
- Table 33: Brazil Wellhead Components Industry Revenue (Million) Forecast, by Application 2019 & 2032
- Table 34: Argentina Wellhead Components Industry Revenue (Million) Forecast, by Application 2019 & 2032
- Table 35: Peru Wellhead Components Industry Revenue (Million) Forecast, by Application 2019 & 2032
- Table 36: Chile Wellhead Components Industry Revenue (Million) Forecast, by Application 2019 & 2032
- Table 37: Colombia Wellhead Components Industry Revenue (Million) Forecast, by Application 2019 & 2032
- Table 38: Ecuador Wellhead Components Industry Revenue (Million) Forecast, by Application 2019 & 2032
- Table 39: Venezuela Wellhead Components Industry Revenue (Million) Forecast, by Application 2019 & 2032
- Table 40: Rest of South America Wellhead Components Industry Revenue (Million) Forecast, by Application 2019 & 2032
- Table 41: Global Wellhead Components Industry Revenue Million Forecast, by Country 2019 & 2032
- Table 42: United States Wellhead Components Industry Revenue (Million) Forecast, by Application 2019 & 2032
- Table 43: Canada Wellhead Components Industry Revenue (Million) Forecast, by Application 2019 & 2032
- Table 44: Mexico Wellhead Components Industry Revenue (Million) Forecast, by Application 2019 & 2032
- Table 45: Global Wellhead Components Industry Revenue Million Forecast, by Country 2019 & 2032
- Table 46: United Arab Emirates Wellhead Components Industry Revenue (Million) Forecast, by Application 2019 & 2032
- Table 47: Saudi Arabia Wellhead Components Industry Revenue (Million) Forecast, by Application 2019 & 2032
- Table 48: South Africa Wellhead Components Industry Revenue (Million) Forecast, by Application 2019 & 2032
- Table 49: Rest of Middle East and Africa Wellhead Components Industry Revenue (Million) Forecast, by Application 2019 & 2032
- Table 50: Global Wellhead Components Industry Revenue Million Forecast, by Wellhead Component 2019 & 2032
- Table 51: Global Wellhead Components Industry Revenue Million Forecast, by Location 2019 & 2032
- Table 52: Global Wellhead Components Industry Revenue Million Forecast, by Country 2019 & 2032
- Table 53: Global Wellhead Components Industry Revenue Million Forecast, by Wellhead Component 2019 & 2032
- Table 54: Global Wellhead Components Industry Revenue Million Forecast, by Location 2019 & 2032
- Table 55: Global Wellhead Components Industry Revenue Million Forecast, by Country 2019 & 2032
- Table 56: Global Wellhead Components Industry Revenue Million Forecast, by Wellhead Component 2019 & 2032
- Table 57: Global Wellhead Components Industry Revenue Million Forecast, by Location 2019 & 2032
- Table 58: Global Wellhead Components Industry Revenue Million Forecast, by Country 2019 & 2032
- Table 59: Global Wellhead Components Industry Revenue Million Forecast, by Wellhead Component 2019 & 2032
- Table 60: Global Wellhead Components Industry Revenue Million Forecast, by Location 2019 & 2032
- Table 61: Global Wellhead Components Industry Revenue Million Forecast, by Country 2019 & 2032
- Table 62: Global Wellhead Components Industry Revenue Million Forecast, by Wellhead Component 2019 & 2032
- Table 63: Global Wellhead Components Industry Revenue Million Forecast, by Location 2019 & 2032
- Table 64: Global Wellhead Components Industry Revenue Million Forecast, by Country 2019 & 2032
Frequently Asked Questions
1. What is the projected Compound Annual Growth Rate (CAGR) of the Wellhead Components Industry?
The projected CAGR is approximately > 5.00%.
2. Which companies are prominent players in the Wellhead Components Industry?
Key companies in the market include Weir Group PLC, Oil States International Inc, Weatherford International PLC, Great Lakes Wellhead Inc, Forum Energy Technologies Inc, Baker Hughes Company, Cactus Wellhead LLC*List Not Exhaustive, Schlumberger Limited, NOV Inc, TechnipFMC PLC.
3. What are the main segments of the Wellhead Components Industry?
The market segments include Wellhead Component, Location.
4. Can you provide details about the market size?
The market size is estimated to be USD XX Million as of 2022.
5. What are some drivers contributing to market growth?
4.; The Rise in Oil and Gas Drilling Activities4.; Increased Shale Gas Exploration.
6. What are the notable trends driving market growth?
Onshore Segment to Dominate the Market.
7. Are there any restraints impacting market growth?
4.; Increasing Share of Renewable Energy.
8. Can you provide examples of recent developments in the market?
In February 2021, TechnipFMC's subsidiary, FMC Wellhead Equipment Sdn Bhd was awarded a substantial contract by PETRONAS Carigali Sdn Bhd for Limbayong deepwater development project in offshore Malaysia. This contract covers the development of 10 deepwater wells and their tieback to the Limbayong Floating Production Storage and Offloading (FPSO) unit in Malaysia.
9. What pricing options are available for accessing the report?
Pricing options include single-user, multi-user, and enterprise licenses priced at USD 4750, USD 5250, and USD 8750 respectively.
10. Is the market size provided in terms of value or volume?
The market size is provided in terms of value, measured in Million.
11. Are there any specific market keywords associated with the report?
Yes, the market keyword associated with the report is "Wellhead Components Industry," which aids in identifying and referencing the specific market segment covered.
12. How do I determine which pricing option suits my needs best?
The pricing options vary based on user requirements and access needs. Individual users may opt for single-user licenses, while businesses requiring broader access may choose multi-user or enterprise licenses for cost-effective access to the report.
13. Are there any additional resources or data provided in the Wellhead Components Industry report?
While the report offers comprehensive insights, it's advisable to review the specific contents or supplementary materials provided to ascertain if additional resources or data are available.
14. How can I stay updated on further developments or reports in the Wellhead Components Industry?
To stay informed about further developments, trends, and reports in the Wellhead Components Industry, consider subscribing to industry newsletters, following relevant companies and organizations, or regularly checking reputable industry news sources and publications.
Methodology
Step 1 - Identification of Relevant Samples Size from Population Database


Step 2 - Approaches for Defining Global Market Size (Value, Volume* & Price*)

Note*: In applicable scenarios
Step 3 - Data Sources
Primary Research
- Web Analytics
- Survey Reports
- Research Institute
- Latest Research Reports
- Opinion Leaders
Secondary Research
- Annual Reports
- White Paper
- Latest Press Release
- Industry Association
- Paid Database
- Investor Presentations

Step 4 - Data Triangulation
Involves using different sources of information in order to increase the validity of a study
These sources are likely to be stakeholders in a program - participants, other researchers, program staff, other community members, and so on.
Then we put all data in single framework & apply various statistical tools to find out the dynamic on the market.
During the analysis stage, feedback from the stakeholder groups would be compared to determine areas of agreement as well as areas of divergence


