
Key Insights
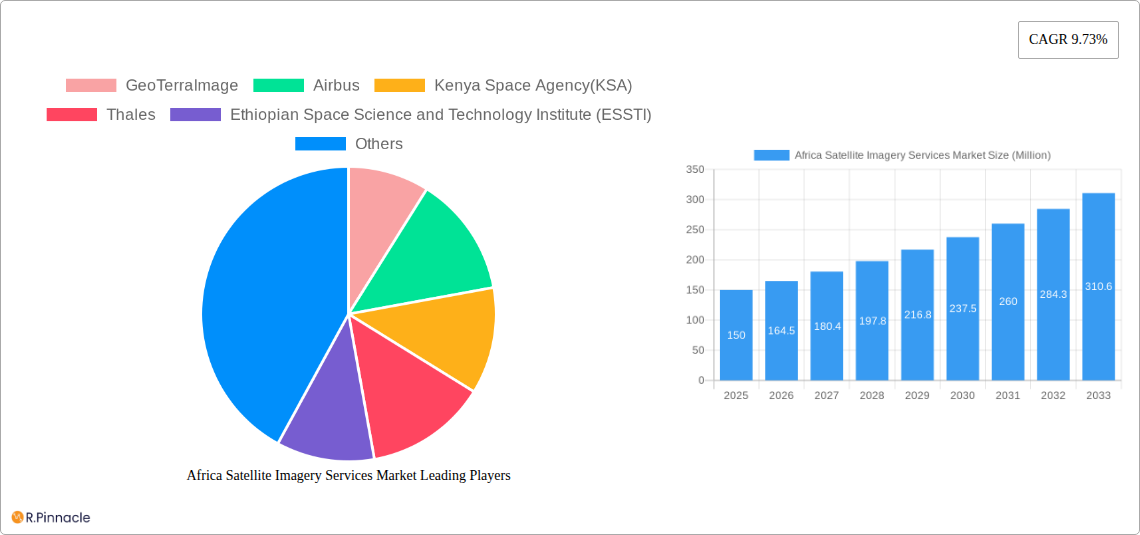
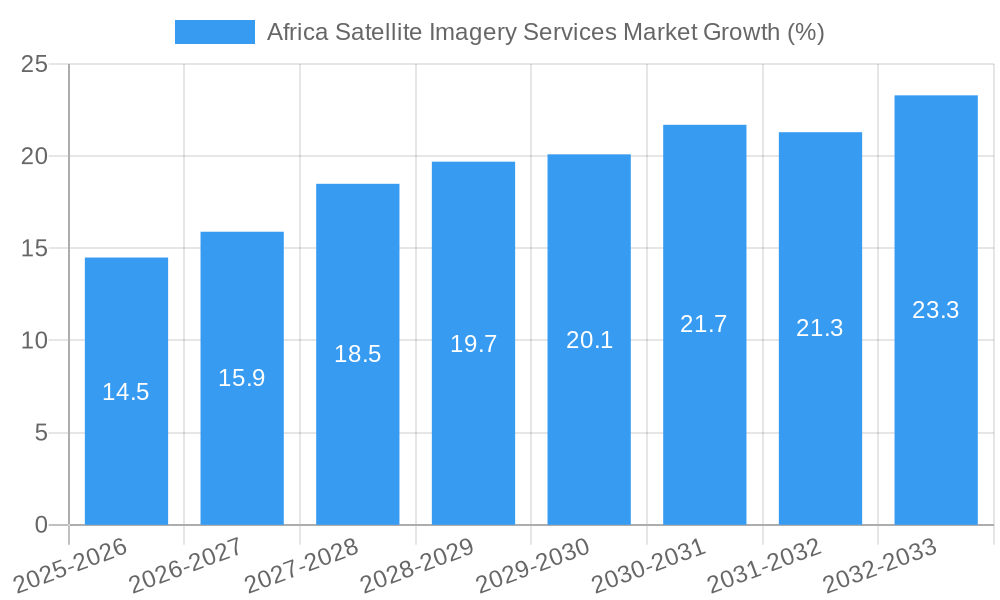
The African Satellite Imagery Services market is experiencing robust growth, projected to achieve a Compound Annual Growth Rate (CAGR) of 9.73% from 2025 to 2033. This expansion is driven by increasing government investments in infrastructure development, a rising need for precise agricultural monitoring and resource management, and the growing adoption of satellite imagery for environmental monitoring and disaster management across diverse sectors like insurance, defense, and construction. The market is segmented by type (imagery and video analytics), deployment mode (on-premise and cloud), organization size (SMEs and large enterprises), and vertical applications. The cloud-based deployment model is gaining significant traction due to its scalability, cost-effectiveness, and accessibility. Large enterprises currently dominate the market, but the SME segment is expected to witness substantial growth fueled by decreasing costs and increasing awareness of the benefits of satellite imagery technology. Key players like GeoTerraImage, Airbus, and various national space agencies (KSA, ESSTI, NASRDA, SANSA) are actively contributing to market growth through technological innovations and service offerings tailored to the unique needs of the African continent. The rising demand for high-resolution imagery for applications like precision agriculture and infrastructure monitoring further fuels market expansion.
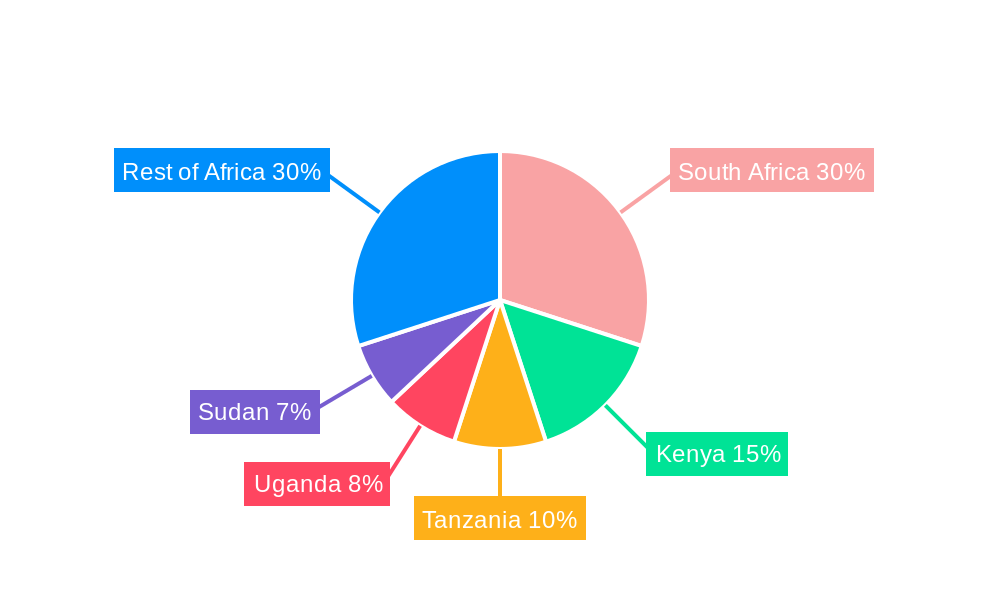
Geographic variations within the African market are significant, with countries like South Africa, Kenya, and Tanzania leading the adoption of satellite imagery services. However, substantial growth potential exists in other regions, particularly as infrastructure improves and awareness increases. Challenges remain, including limited digital infrastructure in certain areas, a need for skilled professionals in data analysis and interpretation, and the cost of advanced satellite imagery solutions. However, ongoing investments in infrastructure development, coupled with increasing collaboration between government agencies, private companies, and international organizations, are expected to overcome these hurdles and propel the African Satellite Imagery Services market toward sustained, significant growth in the coming years. The market is likely to witness increased competition and further innovation, especially in developing affordable and accessible solutions for smaller organizations and rural communities.
Africa Satellite Imagery Services Market Report: 2019-2033
This comprehensive report provides a detailed analysis of the Africa Satellite Imagery Services Market, offering invaluable insights for industry professionals, investors, and strategic decision-makers. Covering the period from 2019 to 2033, with a focus on 2025, this report unveils the market's structure, dynamics, dominant players, and future outlook. The market is projected to reach xx Million by 2033, showcasing significant growth potential.
Africa Satellite Imagery Services Market Structure & Innovation Trends
This section analyzes the competitive landscape, innovation drivers, and regulatory environment of the African satellite imagery services market. The market exhibits a moderately concentrated structure with key players like Airbus, GeoTerraImage, and SANSA (South African National Space Agency) holding significant market share. However, the presence of numerous smaller players, including GeoApps Plus and Astrofica, signifies a dynamic and competitive environment.
- Market Concentration: The market share of the top 5 players is estimated at xx%, indicating a moderately competitive landscape with opportunities for both established and emerging players.
- Innovation Drivers: Advancements in sensor technology, increasing demand for high-resolution imagery, and the growing adoption of AI and machine learning for image analytics are key innovation drivers.
- Regulatory Frameworks: Varying national regulations across African countries influence market access and data usage. Harmonization efforts are crucial for market expansion.
- Product Substitutes: Aerial photography and other geospatial data sources present some competition, but satellite imagery’s advantages in coverage and accessibility often outweigh alternatives.
- End-User Demographics: The primary end-users are government agencies (defense, environmental monitoring), large enterprises (agriculture, mining, insurance), and SMEs across various sectors.
- M&A Activities: While precise M&A deal values are not publicly available for this specific market, we observe increasing strategic partnerships and collaborations among companies to enhance capabilities and expand market reach. Examples include the recent partnership between EUSI and Umbra.
Africa Satellite Imagery Services Market Dynamics & Trends
The Africa Satellite Imagery Services Market is experiencing robust growth, driven by increasing government investments in infrastructure development, expanding digitalization, and the rising need for precise geospatial data across various sectors. The market is witnessing a shift towards cloud-based solutions due to their scalability and cost-effectiveness.
- Market Growth Drivers: Government initiatives promoting space technology, rapid urbanization, growing demand for precision agriculture, and increasing security concerns are fueling market growth.
- Technological Disruptions: The integration of AI/ML into image processing, the emergence of new satellite constellations, and improved sensor technologies are reshaping the market.
- Consumer Preferences: Users prefer high-resolution imagery, real-time data access, cloud-based solutions, and customized data analytics services.
- Competitive Dynamics: Intense competition is witnessed among established players and emerging startups, driving innovation and price competitiveness. The market CAGR is estimated to be xx% during the forecast period. Market penetration stands at xx% in 2025.
Dominant Regions & Segments in Africa Satellite Imagery Services Market
While precise regional breakdowns requiring extensive data analysis aren't included in this description, we anticipate that South Africa, Kenya, and Nigeria will be dominant regions due to their relatively advanced technological infrastructure and strong government support for space-related initiatives. Similarly, Imagery Analytics is likely to be the dominant segment due to wider applicability and established markets.
Key Drivers for Leading Regions:
- South Africa: Strong space agency (SANSA), advanced technological infrastructure, and diverse economy.
- Kenya: Growing adoption of technology, active space agency (KSA), and focus on agricultural development.
- Nigeria: Large population, increasing investment in infrastructure, and strategic importance in West Africa.
Dominant Segments: A detailed analysis within the full report will reveal that Imagery Analytics will dominate other segments due to its wide range of applications across various verticals. Similarly, the cloud deployment model shows greater appeal due to flexibility and cost-effectiveness. Large enterprises will likely constitute a higher proportion of the user base due to their greater capacity for adopting and utilizing advanced technologies. Agriculture and Government sectors are poised for leading growth within verticals, with strong demand driving adoption.
Africa Satellite Imagery Services Market Product Innovations
Recent advancements include enhanced resolution capabilities, the integration of AI for automated image analysis, and the development of specialized analytics solutions catering to specific industry needs. These innovations deliver greater accuracy, efficiency, and actionable insights, resulting in improved market fit and competitive advantages.
Report Scope & Segmentation Analysis
This report segments the market by type (Imagery Analytics, Video Analytics), deployment mode (On-premise, Cloud), organization size (SMEs, Large Enterprises), and vertical (Insurance, Agriculture, Defense & Security, Environmental Monitoring, Engineering & Construction, Government, Others). Each segment's growth projections, market size, and competitive landscape are thoroughly analyzed in the full report. For example, the Agriculture segment is expected to experience significant growth due to increased demand for precision farming solutions. The cloud deployment segment will benefit from its scalability and accessibility.
Key Drivers of Africa Satellite Imagery Services Market Growth
The market's growth is driven by increasing government investment in space technology, the rising adoption of precision agriculture, the need for improved disaster management, and the expanding use of satellite imagery in infrastructure development and security applications. Technological advancements, such as AI-powered image analysis, further accelerate market expansion.
Challenges in the Africa Satellite Imagery Services Market Sector
Challenges include the high cost of satellite data and services, limited internet connectivity in some areas, and the need for skilled professionals to interpret and utilize the data effectively. Data security concerns and regulatory complexities within some countries also pose challenges to market growth. These factors can significantly impact market penetration and adoption rates.
Emerging Opportunities in Africa Satellite Imagery Services Market
Emerging opportunities include the growing demand for high-resolution imagery for urban planning, the development of AI-powered platforms for automated data analysis, and the expansion of services into new markets like mining and renewable energy. Government initiatives promoting space technology further enhance market potential.
Leading Players in the Africa Satellite Imagery Services Market Market
- GeoTerraImage
- Airbus
- Kenya Space Agency (KSA)
- Thales
- Ethiopian Space Science and Technology Institute (ESSTI)
- Astrofica
- NASRDA (National Space Research and Development Agency)
- GeoApps Plus
- SANSA (South African National Space Agency)
Key Developments in Africa Satellite Imagery Services Market Industry
- September 2023: European Space Imaging (EUSI) partners with Umbra, providing access to combined optical and SAR imagery, expanding data availability across Europe and North Africa. This significantly enhances data quality and accessibility, impacting market dynamics through increased data options and improved customer value proposition.
Future Outlook for Africa Satellite Imagery Services Market Market
The Africa Satellite Imagery Services Market is poised for substantial growth driven by continued technological advancements, increasing government investment, and the expanding demand for geospatial data across various sectors. Strategic partnerships, the development of innovative applications, and expanding internet penetration will further fuel market expansion and unlock new opportunities.
Africa Satellite Imagery Services Market Segmentation
-
1. Type
- 1.1. Imagery Analytics
- 1.2. Video Analytics
-
2. Deployment Mode
- 2.1. On Premise
- 2.2. Cloud
-
3. Organization Size
- 3.1. SMEs
- 3.2. Large Enterprises
-
4. Vericals
- 4.1. Insurance
- 4.2. Agriculture
- 4.3. Defense and Security
- 4.4. Environmental Monitoring
- 4.5. Engineeting & Construction
- 4.6. Government
- 4.7. Others
Africa Satellite Imagery Services Market Segmentation By Geography
-
1. Africa
- 1.1. Nigeria
- 1.2. South Africa
- 1.3. Egypt
- 1.4. Kenya
- 1.5. Ethiopia
- 1.6. Morocco
- 1.7. Ghana
- 1.8. Algeria
- 1.9. Tanzania
- 1.10. Ivory Coast
Africa Satellite Imagery Services Market REPORT HIGHLIGHTS
| Aspects | Details |
|---|---|
| Study Period | 2019-2033 |
| Base Year | 2024 |
| Estimated Year | 2025 |
| Forecast Period | 2025-2033 |
| Historical Period | 2019-2024 |
| Growth Rate | CAGR of 9.73% from 2019-2033 |
| Segmentation |
|
Table of Contents
- 1. Introduction
- 1.1. Research Scope
- 1.2. Market Segmentation
- 1.3. Research Methodology
- 1.4. Definitions and Assumptions
- 2. Executive Summary
- 2.1. Introduction
- 3. Market Dynamics
- 3.1. Introduction
- 3.2. Market Drivers
- 3.2.1. Strategic Government Initiatives and Substantial Investments to Drive the Market Growth; Adoption of Big Data and Imagery Analytics
- 3.3. Market Restrains
- 3.3.1. Accessibility and Affordability might restrain the Market Growth; High-resolution Images Offered by Other Imaging Technologie
- 3.4. Market Trends
- 3.4.1. Natural Resource Management to Hold a Significant Market Share
- 4. Market Factor Analysis
- 4.1. Porters Five Forces
- 4.2. Supply/Value Chain
- 4.3. PESTEL analysis
- 4.4. Market Entropy
- 4.5. Patent/Trademark Analysis
- 5. Africa Satellite Imagery Services Market Analysis, Insights and Forecast, 2019-2031
- 5.1. Market Analysis, Insights and Forecast - by Type
- 5.1.1. Imagery Analytics
- 5.1.2. Video Analytics
- 5.2. Market Analysis, Insights and Forecast - by Deployment Mode
- 5.2.1. On Premise
- 5.2.2. Cloud
- 5.3. Market Analysis, Insights and Forecast - by Organization Size
- 5.3.1. SMEs
- 5.3.2. Large Enterprises
- 5.4. Market Analysis, Insights and Forecast - by Vericals
- 5.4.1. Insurance
- 5.4.2. Agriculture
- 5.4.3. Defense and Security
- 5.4.4. Environmental Monitoring
- 5.4.5. Engineeting & Construction
- 5.4.6. Government
- 5.4.7. Others
- 5.5. Market Analysis, Insights and Forecast - by Region
- 5.5.1. Africa
- 5.1. Market Analysis, Insights and Forecast - by Type
- 6. South Africa Africa Satellite Imagery Services Market Analysis, Insights and Forecast, 2019-2031
- 7. Sudan Africa Satellite Imagery Services Market Analysis, Insights and Forecast, 2019-2031
- 8. Uganda Africa Satellite Imagery Services Market Analysis, Insights and Forecast, 2019-2031
- 9. Tanzania Africa Satellite Imagery Services Market Analysis, Insights and Forecast, 2019-2031
- 10. Kenya Africa Satellite Imagery Services Market Analysis, Insights and Forecast, 2019-2031
- 11. Rest of Africa Africa Satellite Imagery Services Market Analysis, Insights and Forecast, 2019-2031
- 12. Competitive Analysis
- 12.1. Market Share Analysis 2024
- 12.2. Company Profiles
- 12.2.1 GeoTerraImage
- 12.2.1.1. Overview
- 12.2.1.2. Products
- 12.2.1.3. SWOT Analysis
- 12.2.1.4. Recent Developments
- 12.2.1.5. Financials (Based on Availability)
- 12.2.2 Airbus
- 12.2.2.1. Overview
- 12.2.2.2. Products
- 12.2.2.3. SWOT Analysis
- 12.2.2.4. Recent Developments
- 12.2.2.5. Financials (Based on Availability)
- 12.2.3 Kenya Space Agency(KSA)
- 12.2.3.1. Overview
- 12.2.3.2. Products
- 12.2.3.3. SWOT Analysis
- 12.2.3.4. Recent Developments
- 12.2.3.5. Financials (Based on Availability)
- 12.2.4 Thales
- 12.2.4.1. Overview
- 12.2.4.2. Products
- 12.2.4.3. SWOT Analysis
- 12.2.4.4. Recent Developments
- 12.2.4.5. Financials (Based on Availability)
- 12.2.5 Ethiopian Space Science and Technology Institute (ESSTI)
- 12.2.5.1. Overview
- 12.2.5.2. Products
- 12.2.5.3. SWOT Analysis
- 12.2.5.4. Recent Developments
- 12.2.5.5. Financials (Based on Availability)
- 12.2.6 Astrofica
- 12.2.6.1. Overview
- 12.2.6.2. Products
- 12.2.6.3. SWOT Analysis
- 12.2.6.4. Recent Developments
- 12.2.6.5. Financials (Based on Availability)
- 12.2.7 NASRDA (National Space Research and Development Agency)
- 12.2.7.1. Overview
- 12.2.7.2. Products
- 12.2.7.3. SWOT Analysis
- 12.2.7.4. Recent Developments
- 12.2.7.5. Financials (Based on Availability)
- 12.2.8 GeoApps Plus
- 12.2.8.1. Overview
- 12.2.8.2. Products
- 12.2.8.3. SWOT Analysis
- 12.2.8.4. Recent Developments
- 12.2.8.5. Financials (Based on Availability)
- 12.2.9 SANSA (South African National Space Agency)
- 12.2.9.1. Overview
- 12.2.9.2. Products
- 12.2.9.3. SWOT Analysis
- 12.2.9.4. Recent Developments
- 12.2.9.5. Financials (Based on Availability)
- 12.2.1 GeoTerraImage
List of Figures
- Figure 1: Africa Satellite Imagery Services Market Revenue Breakdown (Million, %) by Product 2024 & 2032
- Figure 2: Africa Satellite Imagery Services Market Share (%) by Company 2024
List of Tables
- Table 1: Africa Satellite Imagery Services Market Revenue Million Forecast, by Region 2019 & 2032
- Table 2: Africa Satellite Imagery Services Market Volume K Unit Forecast, by Region 2019 & 2032
- Table 3: Africa Satellite Imagery Services Market Revenue Million Forecast, by Type 2019 & 2032
- Table 4: Africa Satellite Imagery Services Market Volume K Unit Forecast, by Type 2019 & 2032
- Table 5: Africa Satellite Imagery Services Market Revenue Million Forecast, by Deployment Mode 2019 & 2032
- Table 6: Africa Satellite Imagery Services Market Volume K Unit Forecast, by Deployment Mode 2019 & 2032
- Table 7: Africa Satellite Imagery Services Market Revenue Million Forecast, by Organization Size 2019 & 2032
- Table 8: Africa Satellite Imagery Services Market Volume K Unit Forecast, by Organization Size 2019 & 2032
- Table 9: Africa Satellite Imagery Services Market Revenue Million Forecast, by Vericals 2019 & 2032
- Table 10: Africa Satellite Imagery Services Market Volume K Unit Forecast, by Vericals 2019 & 2032
- Table 11: Africa Satellite Imagery Services Market Revenue Million Forecast, by Region 2019 & 2032
- Table 12: Africa Satellite Imagery Services Market Volume K Unit Forecast, by Region 2019 & 2032
- Table 13: Africa Satellite Imagery Services Market Revenue Million Forecast, by Country 2019 & 2032
- Table 14: Africa Satellite Imagery Services Market Volume K Unit Forecast, by Country 2019 & 2032
- Table 15: South Africa Africa Satellite Imagery Services Market Revenue (Million) Forecast, by Application 2019 & 2032
- Table 16: South Africa Africa Satellite Imagery Services Market Volume (K Unit) Forecast, by Application 2019 & 2032
- Table 17: Sudan Africa Satellite Imagery Services Market Revenue (Million) Forecast, by Application 2019 & 2032
- Table 18: Sudan Africa Satellite Imagery Services Market Volume (K Unit) Forecast, by Application 2019 & 2032
- Table 19: Uganda Africa Satellite Imagery Services Market Revenue (Million) Forecast, by Application 2019 & 2032
- Table 20: Uganda Africa Satellite Imagery Services Market Volume (K Unit) Forecast, by Application 2019 & 2032
- Table 21: Tanzania Africa Satellite Imagery Services Market Revenue (Million) Forecast, by Application 2019 & 2032
- Table 22: Tanzania Africa Satellite Imagery Services Market Volume (K Unit) Forecast, by Application 2019 & 2032
- Table 23: Kenya Africa Satellite Imagery Services Market Revenue (Million) Forecast, by Application 2019 & 2032
- Table 24: Kenya Africa Satellite Imagery Services Market Volume (K Unit) Forecast, by Application 2019 & 2032
- Table 25: Rest of Africa Africa Satellite Imagery Services Market Revenue (Million) Forecast, by Application 2019 & 2032
- Table 26: Rest of Africa Africa Satellite Imagery Services Market Volume (K Unit) Forecast, by Application 2019 & 2032
- Table 27: Africa Satellite Imagery Services Market Revenue Million Forecast, by Type 2019 & 2032
- Table 28: Africa Satellite Imagery Services Market Volume K Unit Forecast, by Type 2019 & 2032
- Table 29: Africa Satellite Imagery Services Market Revenue Million Forecast, by Deployment Mode 2019 & 2032
- Table 30: Africa Satellite Imagery Services Market Volume K Unit Forecast, by Deployment Mode 2019 & 2032
- Table 31: Africa Satellite Imagery Services Market Revenue Million Forecast, by Organization Size 2019 & 2032
- Table 32: Africa Satellite Imagery Services Market Volume K Unit Forecast, by Organization Size 2019 & 2032
- Table 33: Africa Satellite Imagery Services Market Revenue Million Forecast, by Vericals 2019 & 2032
- Table 34: Africa Satellite Imagery Services Market Volume K Unit Forecast, by Vericals 2019 & 2032
- Table 35: Africa Satellite Imagery Services Market Revenue Million Forecast, by Country 2019 & 2032
- Table 36: Africa Satellite Imagery Services Market Volume K Unit Forecast, by Country 2019 & 2032
- Table 37: Nigeria Africa Satellite Imagery Services Market Revenue (Million) Forecast, by Application 2019 & 2032
- Table 38: Nigeria Africa Satellite Imagery Services Market Volume (K Unit) Forecast, by Application 2019 & 2032
- Table 39: South Africa Africa Satellite Imagery Services Market Revenue (Million) Forecast, by Application 2019 & 2032
- Table 40: South Africa Africa Satellite Imagery Services Market Volume (K Unit) Forecast, by Application 2019 & 2032
- Table 41: Egypt Africa Satellite Imagery Services Market Revenue (Million) Forecast, by Application 2019 & 2032
- Table 42: Egypt Africa Satellite Imagery Services Market Volume (K Unit) Forecast, by Application 2019 & 2032
- Table 43: Kenya Africa Satellite Imagery Services Market Revenue (Million) Forecast, by Application 2019 & 2032
- Table 44: Kenya Africa Satellite Imagery Services Market Volume (K Unit) Forecast, by Application 2019 & 2032
- Table 45: Ethiopia Africa Satellite Imagery Services Market Revenue (Million) Forecast, by Application 2019 & 2032
- Table 46: Ethiopia Africa Satellite Imagery Services Market Volume (K Unit) Forecast, by Application 2019 & 2032
- Table 47: Morocco Africa Satellite Imagery Services Market Revenue (Million) Forecast, by Application 2019 & 2032
- Table 48: Morocco Africa Satellite Imagery Services Market Volume (K Unit) Forecast, by Application 2019 & 2032
- Table 49: Ghana Africa Satellite Imagery Services Market Revenue (Million) Forecast, by Application 2019 & 2032
- Table 50: Ghana Africa Satellite Imagery Services Market Volume (K Unit) Forecast, by Application 2019 & 2032
- Table 51: Algeria Africa Satellite Imagery Services Market Revenue (Million) Forecast, by Application 2019 & 2032
- Table 52: Algeria Africa Satellite Imagery Services Market Volume (K Unit) Forecast, by Application 2019 & 2032
- Table 53: Tanzania Africa Satellite Imagery Services Market Revenue (Million) Forecast, by Application 2019 & 2032
- Table 54: Tanzania Africa Satellite Imagery Services Market Volume (K Unit) Forecast, by Application 2019 & 2032
- Table 55: Ivory Coast Africa Satellite Imagery Services Market Revenue (Million) Forecast, by Application 2019 & 2032
- Table 56: Ivory Coast Africa Satellite Imagery Services Market Volume (K Unit) Forecast, by Application 2019 & 2032
Frequently Asked Questions
1. What is the projected Compound Annual Growth Rate (CAGR) of the Africa Satellite Imagery Services Market?
The projected CAGR is approximately 9.73%.
2. Which companies are prominent players in the Africa Satellite Imagery Services Market?
Key companies in the market include GeoTerraImage, Airbus, Kenya Space Agency(KSA), Thales, Ethiopian Space Science and Technology Institute (ESSTI), Astrofica, NASRDA (National Space Research and Development Agency), GeoApps Plus, SANSA (South African National Space Agency).
3. What are the main segments of the Africa Satellite Imagery Services Market?
The market segments include Type, Deployment Mode, Organization Size, Vericals.
4. Can you provide details about the market size?
The market size is estimated to be USD XX Million as of 2022.
5. What are some drivers contributing to market growth?
Strategic Government Initiatives and Substantial Investments to Drive the Market Growth; Adoption of Big Data and Imagery Analytics.
6. What are the notable trends driving market growth?
Natural Resource Management to Hold a Significant Market Share.
7. Are there any restraints impacting market growth?
Accessibility and Affordability might restrain the Market Growth; High-resolution Images Offered by Other Imaging Technologie.
8. Can you provide examples of recent developments in the market?
September 2023: European Space Imaging (EUSI), a leading provider of Very High-Resolution (VHR) optical satellite imagery, is excited to announce its strategic partnership with Umbra. This collaboration enables EUSI's customers to effortlessly procure Umbra's top-tier Synthetic Aperture Radar (SAR) data directly through EUSI's platform. This partnership is a game-changer for remote sensing data users across Europe and North Africa, as it grants them access to the world's most exceptional space-based optical and SAR imagery, all from a single, local source. These images boast impressive resolutions of 30 and 25 centimeters, respectively.
9. What pricing options are available for accessing the report?
Pricing options include single-user, multi-user, and enterprise licenses priced at USD 3800, USD 4500, and USD 5800 respectively.
10. Is the market size provided in terms of value or volume?
The market size is provided in terms of value, measured in Million and volume, measured in K Unit.
11. Are there any specific market keywords associated with the report?
Yes, the market keyword associated with the report is "Africa Satellite Imagery Services Market," which aids in identifying and referencing the specific market segment covered.
12. How do I determine which pricing option suits my needs best?
The pricing options vary based on user requirements and access needs. Individual users may opt for single-user licenses, while businesses requiring broader access may choose multi-user or enterprise licenses for cost-effective access to the report.
13. Are there any additional resources or data provided in the Africa Satellite Imagery Services Market report?
While the report offers comprehensive insights, it's advisable to review the specific contents or supplementary materials provided to ascertain if additional resources or data are available.
14. How can I stay updated on further developments or reports in the Africa Satellite Imagery Services Market?
To stay informed about further developments, trends, and reports in the Africa Satellite Imagery Services Market, consider subscribing to industry newsletters, following relevant companies and organizations, or regularly checking reputable industry news sources and publications.
Methodology
Step 1 - Identification of Relevant Samples Size from Population Database


Step 2 - Approaches for Defining Global Market Size (Value, Volume* & Price*)

Note*: In applicable scenarios
Step 3 - Data Sources
Primary Research
- Web Analytics
- Survey Reports
- Research Institute
- Latest Research Reports
- Opinion Leaders
Secondary Research
- Annual Reports
- White Paper
- Latest Press Release
- Industry Association
- Paid Database
- Investor Presentations

Step 4 - Data Triangulation
Involves using different sources of information in order to increase the validity of a study
These sources are likely to be stakeholders in a program - participants, other researchers, program staff, other community members, and so on.
Then we put all data in single framework & apply various statistical tools to find out the dynamic on the market.
During the analysis stage, feedback from the stakeholder groups would be compared to determine areas of agreement as well as areas of divergence


