
Key Insights
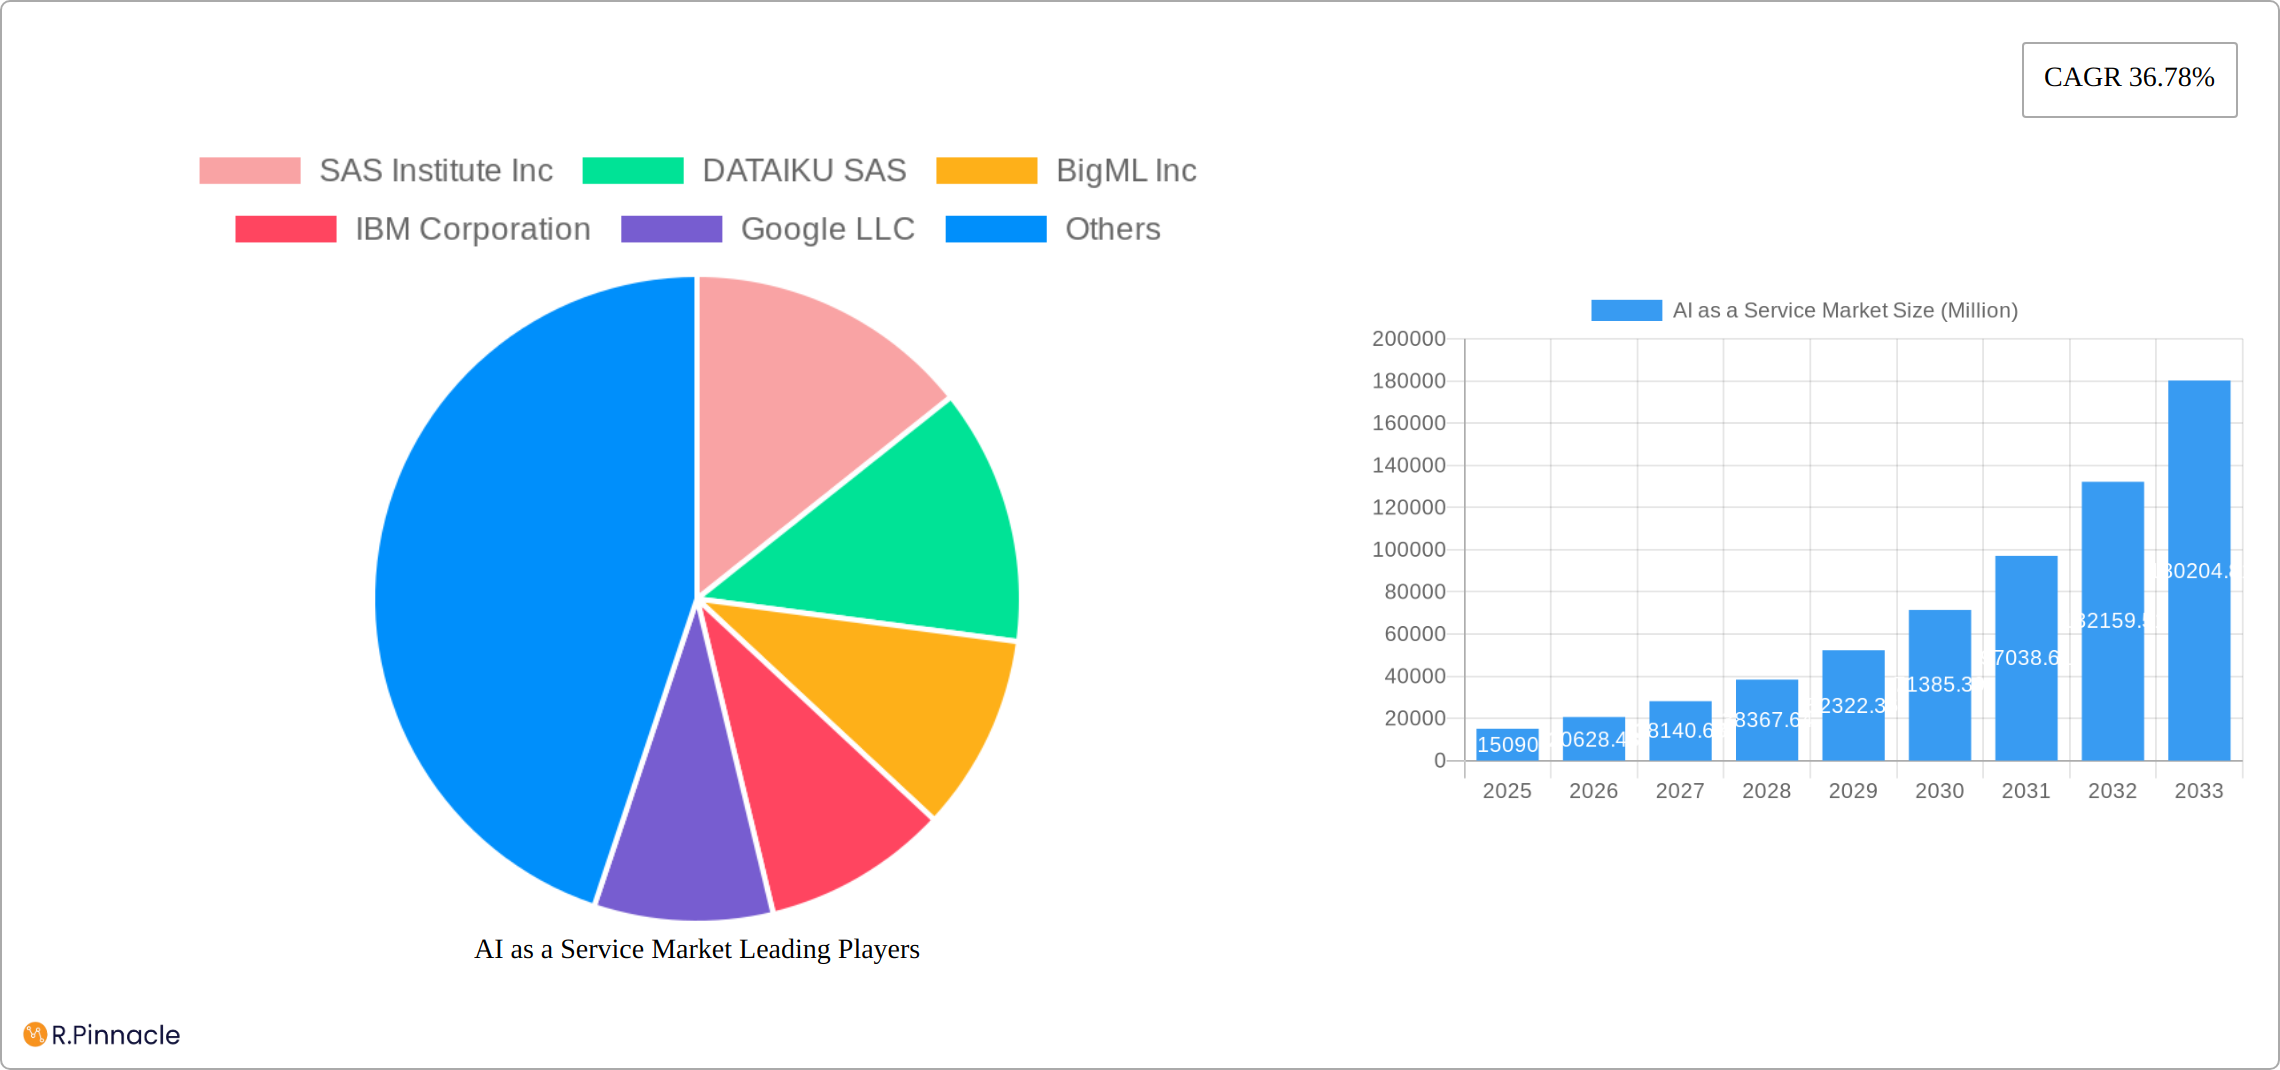
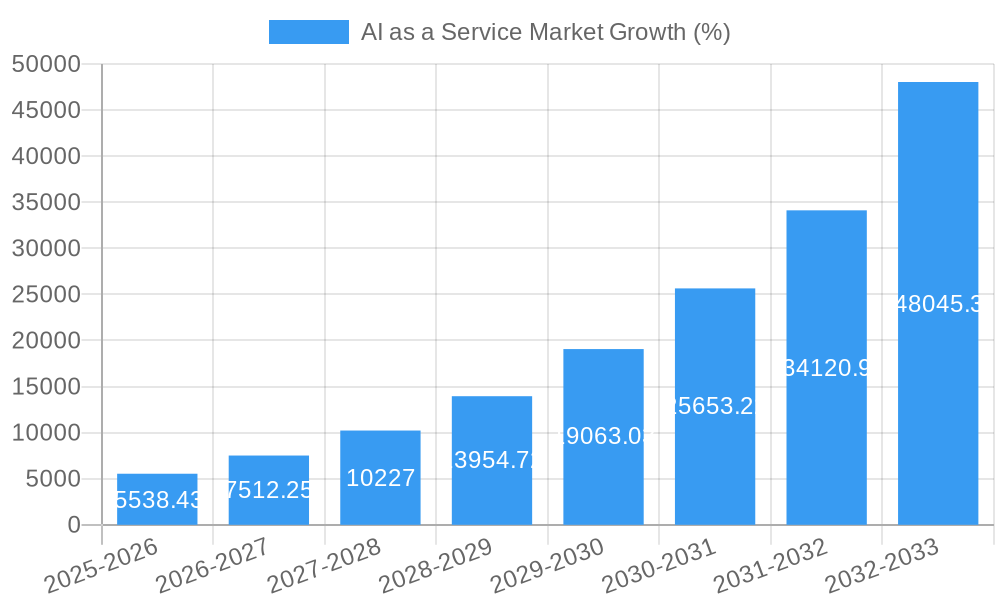
The AI-as-a-Service (AIaaS) market is experiencing explosive growth, projected to reach $15.09 billion in 2025 and exhibiting a remarkable Compound Annual Growth Rate (CAGR) of 36.78%. This rapid expansion is driven by several key factors. Firstly, the increasing accessibility and affordability of AI technologies through cloud-based platforms are democratizing AI adoption across various industries. Secondly, a growing need for data-driven insights and automation in business operations is fueling demand for AIaaS solutions. Businesses of all sizes, from small and medium enterprises (SMEs) to large enterprises, are leveraging AIaaS to improve efficiency, enhance customer experiences, and gain a competitive edge. Finally, the diverse range of AIaaS offerings, encompassing machine learning, natural language processing, and computer vision, caters to a wide spectrum of business needs. The BFSI (Banking, Financial Services, and Insurance), retail, healthcare, and IT and telecom sectors are leading adopters, followed by manufacturing and energy. Deployment models such as public, private, and hybrid clouds offer flexibility to cater to various security and scalability requirements. The competitive landscape is dynamic, with major players like SAS Institute, Dataiku, IBM, Google, Salesforce, Microsoft, Amazon Web Services, and Oracle vying for market share, driving innovation and price competitiveness.
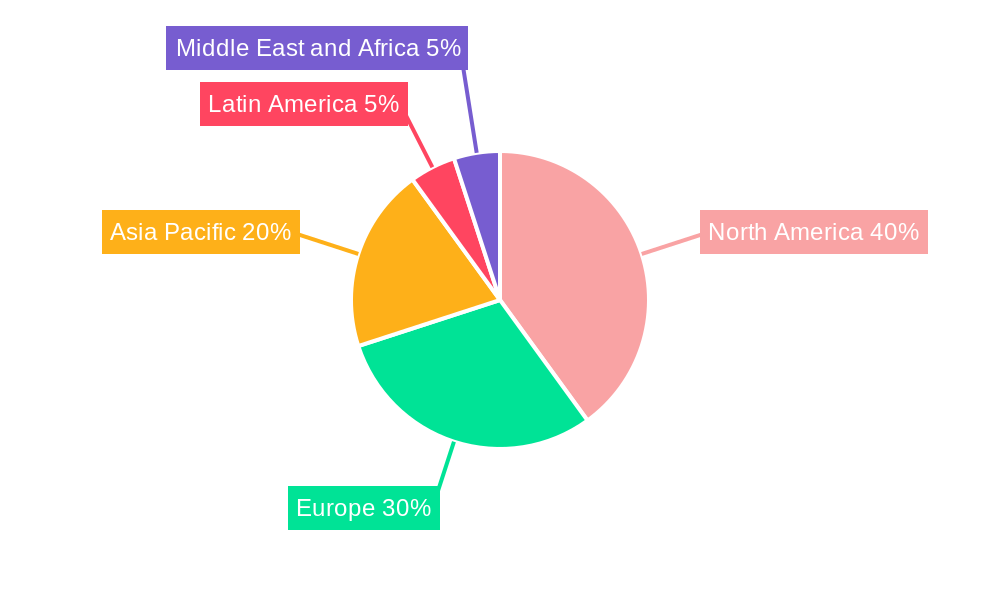
The market's growth trajectory is poised to continue throughout the forecast period (2025-2033). Sustained technological advancements, particularly in areas like generative AI and edge computing, will further expand AIaaS capabilities. Increasing investments in AI research and development by both private companies and government agencies will contribute to market expansion. While data security and privacy concerns remain a challenge, the development of robust security protocols and regulatory frameworks are mitigating these risks. The geographical distribution shows a significant concentration of adoption in North America and Europe, but the Asia-Pacific region is expected to experience the fastest growth, propelled by rising digitalization and increasing investment in AI infrastructure. Overall, the AIaaS market presents significant opportunities for both technology providers and businesses seeking to leverage the transformative power of artificial intelligence.
AI as a Service Market Report: 2019-2033 Forecast
This comprehensive report provides a detailed analysis of the AI as a Service (AIaaS) market, offering invaluable insights for industry professionals, investors, and strategists. Covering the period from 2019 to 2033, with a focus on 2025, this report illuminates market dynamics, competitive landscapes, and future growth prospects. The study period spans 2019-2033, with 2025 as the base and estimated year, and a forecast period of 2025-2033. The historical period analyzed is 2019-2024.
AI as a Service Market Market Structure & Innovation Trends
The AIaaS market exhibits a dynamic structure characterized by both established tech giants and emerging innovative players. Market concentration is moderate, with key players like SAS Institute Inc, DATAIKU SAS, BigML Inc, IBM Corporation, Google LLC, Salesforce com Inc, Microsoft Corporation, Craft AI, Amazon Web Services Inc, Oracle Corporation, and H2O Ai Inc holding significant market share. However, the landscape is constantly evolving due to rapid innovation and strategic acquisitions.
- Market Share: The top 5 players collectively account for approximately xx% of the market share in 2025. Precise figures are detailed within the full report.
- Innovation Drivers: Advancements in machine learning, deep learning, and natural language processing are key innovation drivers, enabling the development of more sophisticated and accessible AI solutions.
- Regulatory Frameworks: Data privacy regulations (GDPR, CCPA) and ethical considerations significantly impact market development and adoption.
- Product Substitutes: Traditional software solutions and in-house AI development remain as alternatives, but the cost-effectiveness and scalability of AIaaS are increasingly favored.
- End-User Demographics: The market spans various sectors, with large enterprises currently dominating due to higher budgets and complex needs. However, the SME sector is demonstrating rapid growth.
- M&A Activities: The AIaaS market has seen significant M&A activity in recent years, with deals exceeding xx Million in value in 2024. These acquisitions often involve smaller specialized AI companies being integrated into larger technology platforms.
AI as a Service Market Market Dynamics & Trends
The AIaaS market is experiencing robust growth, fueled by increasing demand for data-driven insights across diverse industries. The market’s Compound Annual Growth Rate (CAGR) is projected at xx% during the forecast period (2025-2033). Technological advancements, particularly in areas such as cloud computing and edge AI, are significant growth enablers. Consumer preference is shifting towards AI-powered solutions offering enhanced efficiency, automation, and predictive capabilities. However, the intensely competitive nature of the market leads to continuous innovation and pricing pressure. Market penetration is currently at xx% and expected to reach xx% by 2033. This growth is further propelled by the decreasing cost of AIaaS solutions, making them accessible to a wider range of businesses. The rising adoption of cloud-based solutions is also a key factor boosting market expansion, along with increasing investment in R&D by major players. The demand for personalized customer experiences and improved decision-making capabilities is also driving growth in this sector.
Dominant Regions & Segments in AI as a Service Market
The North American region currently holds the largest market share in the AIaaS market, driven by strong technological infrastructure, a large pool of AI talent, and high adoption rates across various industries. However, the Asia-Pacific region is expected to exhibit the fastest growth during the forecast period.
- By Organization Size: Large enterprises dominate due to higher budgets and complex AI needs. However, SMEs show significant growth potential.
- By End-user Industry: The BFSI (Banking, Financial Services, and Insurance) sector is a leading adopter of AIaaS, followed closely by the healthcare and retail industries. Growth in the manufacturing and energy sectors is also expected to be substantial.
- By Deployment: Cloud-based (Public) deployment is the most prevalent model, benefiting from scalability and cost-effectiveness. However, private and hybrid deployments are also gaining traction due to data security and compliance concerns.
Key Drivers:
- North America: Strong technological infrastructure, abundant skilled workforce, high adoption rates.
- Asia-Pacific: Rapid technological advancements, increasing digitalization, government initiatives promoting AI adoption.
- Europe: Growing focus on data privacy and regulatory compliance, increasing investments in AI research and development.
AI as a Service Market Product Innovations
Recent product innovations in AIaaS focus on enhancing model accuracy, simplifying deployment, and improving user experience. This includes advancements in automated machine learning (AutoML) tools, pre-trained models for specific industry applications, and intuitive interfaces. The market is increasingly emphasizing specialized AI solutions tailored to specific industry needs, offering competitive advantages through improved efficiency and accuracy.
Report Scope & Segmentation Analysis
This report provides a comprehensive segmentation of the AIaaS market across various parameters:
- Organization Size: Small and Medium Enterprises (SMEs) and Large Enterprises – detailing individual market size projections and competitive dynamics for each segment.
- End-user Industry: BFSI, Retail, Healthcare, IT and Telecom, Manufacturing, Energy, and Other End-user Industries – each with its own growth projection and market size analysis.
- Deployment: Public, Private, and Hybrid – the report details growth projections and market size for each deployment model, focusing on factors driving the adoption of each model.
Key Drivers of AI as a Service Market Growth
Several factors contribute to the AIaaS market's growth. Technological advancements, particularly in machine learning and cloud computing, reduce barriers to AI adoption. The increasing availability of big data fuels the demand for sophisticated analytics. Government initiatives and incentives in several regions further stimulate market expansion. Finally, the rising focus on automation and efficiency across industries drives the adoption of AIaaS solutions.
Challenges in the AI as a Service Market Sector
Despite the growth, the AIaaS market faces challenges. Data security and privacy concerns can hinder adoption. The need for skilled professionals to manage and interpret AI insights creates a talent gap. Furthermore, high initial investment costs and integration complexities can pose barriers for smaller companies. Competition is intense, leading to pricing pressure and the need for continuous innovation.
Emerging Opportunities in AI as a Service Market
The AIaaS market presents numerous opportunities. The expansion into new industries, such as agriculture and transportation, offers substantial growth potential. Advancements in edge AI and the development of more specialized AI solutions tailored to specific business needs also create lucrative avenues for growth. Increased demand for AI-driven automation and personalization further fuels market expansion.
Leading Players in the AI as a Service Market Market
- SAS Institute Inc
- DATAIKU SAS
- BigML Inc
- IBM Corporation
- Google LLC
- Salesforce com Inc
- Microsoft Corporation
- Craft AI
- Amazon Web Services Inc
- Oracle Corporation
- H2O Ai Inc
Key Developments in AI as a Service Market Industry
- September 2022: The AI4HealthyCities Health Equity Network's launch highlights the increasing application of AI in healthcare and addresses social equity issues, impacting the healthcare segment of the AIaaS market.
- June 2022: The Wipro and Eros Investments partnership demonstrates the expanding use of AI in media and entertainment for content localization, influencing the market's growth in this sector.
Future Outlook for AI as a Service Market Market
The AIaaS market shows significant potential for continued growth, driven by technological innovation, increasing data availability, and rising demand for AI-powered solutions across industries. Strategic partnerships, acquisitions, and investments in research and development will further shape the market landscape. The focus on ethical AI and addressing bias in algorithms will also be critical for future market development.
AI as a Service Market Segmentation
-
1. Deployment
- 1.1. Public
- 1.2. Private
- 1.3. Hybrid
-
2. Organization Size
- 2.1. Small and Medium Enterprise
- 2.2. Large Enterprise
-
3. End-user Industry
- 3.1. BFSI
- 3.2. Retail
- 3.3. Healthcare
- 3.4. IT and Telecom
- 3.5. Manufacturing
- 3.6. Energy
- 3.7. Other End-user Industries
AI as a Service Market Segmentation By Geography
- 1. North America
- 2. Europe
- 3. Asia
- 4. Australia and New Zealand
- 5. Latin America
- 6. Middle East and Africa
AI as a Service Market REPORT HIGHLIGHTS
| Aspects | Details |
|---|---|
| Study Period | 2019-2033 |
| Base Year | 2024 |
| Estimated Year | 2025 |
| Forecast Period | 2025-2033 |
| Historical Period | 2019-2024 |
| Growth Rate | CAGR of 36.78% from 2019-2033 |
| Segmentation |
|
Table of Contents
- 1. Introduction
- 1.1. Research Scope
- 1.2. Market Segmentation
- 1.3. Research Methodology
- 1.4. Definitions and Assumptions
- 2. Executive Summary
- 2.1. Introduction
- 3. Market Dynamics
- 3.1. Introduction
- 3.2. Market Drivers
- 3.2.1. Increasing Demand for Predictive and Analytics Solutions; Rising Demand for Enhancing Consumer Experience
- 3.3. Market Restrains
- 3.3.1. Increasing Security and Privacy Concerns Among Enterprises
- 3.4. Market Trends
- 3.4.1. Increasing Demand for Predictive and Analytics Solutions is Expected to Drive Market Growth
- 4. Market Factor Analysis
- 4.1. Porters Five Forces
- 4.2. Supply/Value Chain
- 4.3. PESTEL analysis
- 4.4. Market Entropy
- 4.5. Patent/Trademark Analysis
- 5. Global AI as a Service Market Analysis, Insights and Forecast, 2019-2031
- 5.1. Market Analysis, Insights and Forecast - by Deployment
- 5.1.1. Public
- 5.1.2. Private
- 5.1.3. Hybrid
- 5.2. Market Analysis, Insights and Forecast - by Organization Size
- 5.2.1. Small and Medium Enterprise
- 5.2.2. Large Enterprise
- 5.3. Market Analysis, Insights and Forecast - by End-user Industry
- 5.3.1. BFSI
- 5.3.2. Retail
- 5.3.3. Healthcare
- 5.3.4. IT and Telecom
- 5.3.5. Manufacturing
- 5.3.6. Energy
- 5.3.7. Other End-user Industries
- 5.4. Market Analysis, Insights and Forecast - by Region
- 5.4.1. North America
- 5.4.2. Europe
- 5.4.3. Asia
- 5.4.4. Australia and New Zealand
- 5.4.5. Latin America
- 5.4.6. Middle East and Africa
- 5.1. Market Analysis, Insights and Forecast - by Deployment
- 6. North America AI as a Service Market Analysis, Insights and Forecast, 2019-2031
- 6.1. Market Analysis, Insights and Forecast - by Deployment
- 6.1.1. Public
- 6.1.2. Private
- 6.1.3. Hybrid
- 6.2. Market Analysis, Insights and Forecast - by Organization Size
- 6.2.1. Small and Medium Enterprise
- 6.2.2. Large Enterprise
- 6.3. Market Analysis, Insights and Forecast - by End-user Industry
- 6.3.1. BFSI
- 6.3.2. Retail
- 6.3.3. Healthcare
- 6.3.4. IT and Telecom
- 6.3.5. Manufacturing
- 6.3.6. Energy
- 6.3.7. Other End-user Industries
- 6.1. Market Analysis, Insights and Forecast - by Deployment
- 7. Europe AI as a Service Market Analysis, Insights and Forecast, 2019-2031
- 7.1. Market Analysis, Insights and Forecast - by Deployment
- 7.1.1. Public
- 7.1.2. Private
- 7.1.3. Hybrid
- 7.2. Market Analysis, Insights and Forecast - by Organization Size
- 7.2.1. Small and Medium Enterprise
- 7.2.2. Large Enterprise
- 7.3. Market Analysis, Insights and Forecast - by End-user Industry
- 7.3.1. BFSI
- 7.3.2. Retail
- 7.3.3. Healthcare
- 7.3.4. IT and Telecom
- 7.3.5. Manufacturing
- 7.3.6. Energy
- 7.3.7. Other End-user Industries
- 7.1. Market Analysis, Insights and Forecast - by Deployment
- 8. Asia AI as a Service Market Analysis, Insights and Forecast, 2019-2031
- 8.1. Market Analysis, Insights and Forecast - by Deployment
- 8.1.1. Public
- 8.1.2. Private
- 8.1.3. Hybrid
- 8.2. Market Analysis, Insights and Forecast - by Organization Size
- 8.2.1. Small and Medium Enterprise
- 8.2.2. Large Enterprise
- 8.3. Market Analysis, Insights and Forecast - by End-user Industry
- 8.3.1. BFSI
- 8.3.2. Retail
- 8.3.3. Healthcare
- 8.3.4. IT and Telecom
- 8.3.5. Manufacturing
- 8.3.6. Energy
- 8.3.7. Other End-user Industries
- 8.1. Market Analysis, Insights and Forecast - by Deployment
- 9. Australia and New Zealand AI as a Service Market Analysis, Insights and Forecast, 2019-2031
- 9.1. Market Analysis, Insights and Forecast - by Deployment
- 9.1.1. Public
- 9.1.2. Private
- 9.1.3. Hybrid
- 9.2. Market Analysis, Insights and Forecast - by Organization Size
- 9.2.1. Small and Medium Enterprise
- 9.2.2. Large Enterprise
- 9.3. Market Analysis, Insights and Forecast - by End-user Industry
- 9.3.1. BFSI
- 9.3.2. Retail
- 9.3.3. Healthcare
- 9.3.4. IT and Telecom
- 9.3.5. Manufacturing
- 9.3.6. Energy
- 9.3.7. Other End-user Industries
- 9.1. Market Analysis, Insights and Forecast - by Deployment
- 10. Latin America AI as a Service Market Analysis, Insights and Forecast, 2019-2031
- 10.1. Market Analysis, Insights and Forecast - by Deployment
- 10.1.1. Public
- 10.1.2. Private
- 10.1.3. Hybrid
- 10.2. Market Analysis, Insights and Forecast - by Organization Size
- 10.2.1. Small and Medium Enterprise
- 10.2.2. Large Enterprise
- 10.3. Market Analysis, Insights and Forecast - by End-user Industry
- 10.3.1. BFSI
- 10.3.2. Retail
- 10.3.3. Healthcare
- 10.3.4. IT and Telecom
- 10.3.5. Manufacturing
- 10.3.6. Energy
- 10.3.7. Other End-user Industries
- 10.1. Market Analysis, Insights and Forecast - by Deployment
- 11. Middle East and Africa AI as a Service Market Analysis, Insights and Forecast, 2019-2031
- 11.1. Market Analysis, Insights and Forecast - by Deployment
- 11.1.1. Public
- 11.1.2. Private
- 11.1.3. Hybrid
- 11.2. Market Analysis, Insights and Forecast - by Organization Size
- 11.2.1. Small and Medium Enterprise
- 11.2.2. Large Enterprise
- 11.3. Market Analysis, Insights and Forecast - by End-user Industry
- 11.3.1. BFSI
- 11.3.2. Retail
- 11.3.3. Healthcare
- 11.3.4. IT and Telecom
- 11.3.5. Manufacturing
- 11.3.6. Energy
- 11.3.7. Other End-user Industries
- 11.1. Market Analysis, Insights and Forecast - by Deployment
- 12. North America AI as a Service Market Analysis, Insights and Forecast, 2019-2031
- 12.1. Market Analysis, Insights and Forecast - By Country/Sub-region
- 12.1.1.
- 13. Europe AI as a Service Market Analysis, Insights and Forecast, 2019-2031
- 13.1. Market Analysis, Insights and Forecast - By Country/Sub-region
- 13.1.1.
- 14. Asia Pacific AI as a Service Market Analysis, Insights and Forecast, 2019-2031
- 14.1. Market Analysis, Insights and Forecast - By Country/Sub-region
- 14.1.1.
- 15. Latin America AI as a Service Market Analysis, Insights and Forecast, 2019-2031
- 15.1. Market Analysis, Insights and Forecast - By Country/Sub-region
- 15.1.1.
- 16. Middle East and Africa AI as a Service Market Analysis, Insights and Forecast, 2019-2031
- 16.1. Market Analysis, Insights and Forecast - By Country/Sub-region
- 16.1.1.
- 17. Competitive Analysis
- 17.1. Global Market Share Analysis 2024
- 17.2. Company Profiles
- 17.2.1 SAS Institute Inc
- 17.2.1.1. Overview
- 17.2.1.2. Products
- 17.2.1.3. SWOT Analysis
- 17.2.1.4. Recent Developments
- 17.2.1.5. Financials (Based on Availability)
- 17.2.2 DATAIKU SAS
- 17.2.2.1. Overview
- 17.2.2.2. Products
- 17.2.2.3. SWOT Analysis
- 17.2.2.4. Recent Developments
- 17.2.2.5. Financials (Based on Availability)
- 17.2.3 BigML Inc
- 17.2.3.1. Overview
- 17.2.3.2. Products
- 17.2.3.3. SWOT Analysis
- 17.2.3.4. Recent Developments
- 17.2.3.5. Financials (Based on Availability)
- 17.2.4 IBM Corporation
- 17.2.4.1. Overview
- 17.2.4.2. Products
- 17.2.4.3. SWOT Analysis
- 17.2.4.4. Recent Developments
- 17.2.4.5. Financials (Based on Availability)
- 17.2.5 Google LLC
- 17.2.5.1. Overview
- 17.2.5.2. Products
- 17.2.5.3. SWOT Analysis
- 17.2.5.4. Recent Developments
- 17.2.5.5. Financials (Based on Availability)
- 17.2.6 Salesforce com Inc
- 17.2.6.1. Overview
- 17.2.6.2. Products
- 17.2.6.3. SWOT Analysis
- 17.2.6.4. Recent Developments
- 17.2.6.5. Financials (Based on Availability)
- 17.2.7 Microsoft Corporation
- 17.2.7.1. Overview
- 17.2.7.2. Products
- 17.2.7.3. SWOT Analysis
- 17.2.7.4. Recent Developments
- 17.2.7.5. Financials (Based on Availability)
- 17.2.8 Craft AI*List Not Exhaustive
- 17.2.8.1. Overview
- 17.2.8.2. Products
- 17.2.8.3. SWOT Analysis
- 17.2.8.4. Recent Developments
- 17.2.8.5. Financials (Based on Availability)
- 17.2.9 Amazon Web Services Inc
- 17.2.9.1. Overview
- 17.2.9.2. Products
- 17.2.9.3. SWOT Analysis
- 17.2.9.4. Recent Developments
- 17.2.9.5. Financials (Based on Availability)
- 17.2.10 Oracle Corporation
- 17.2.10.1. Overview
- 17.2.10.2. Products
- 17.2.10.3. SWOT Analysis
- 17.2.10.4. Recent Developments
- 17.2.10.5. Financials (Based on Availability)
- 17.2.11 H2O Ai Inc
- 17.2.11.1. Overview
- 17.2.11.2. Products
- 17.2.11.3. SWOT Analysis
- 17.2.11.4. Recent Developments
- 17.2.11.5. Financials (Based on Availability)
- 17.2.1 SAS Institute Inc
List of Figures
- Figure 1: Global AI as a Service Market Revenue Breakdown (Million, %) by Region 2024 & 2032
- Figure 2: North America AI as a Service Market Revenue (Million), by Country 2024 & 2032
- Figure 3: North America AI as a Service Market Revenue Share (%), by Country 2024 & 2032
- Figure 4: Europe AI as a Service Market Revenue (Million), by Country 2024 & 2032
- Figure 5: Europe AI as a Service Market Revenue Share (%), by Country 2024 & 2032
- Figure 6: Asia Pacific AI as a Service Market Revenue (Million), by Country 2024 & 2032
- Figure 7: Asia Pacific AI as a Service Market Revenue Share (%), by Country 2024 & 2032
- Figure 8: Latin America AI as a Service Market Revenue (Million), by Country 2024 & 2032
- Figure 9: Latin America AI as a Service Market Revenue Share (%), by Country 2024 & 2032
- Figure 10: Middle East and Africa AI as a Service Market Revenue (Million), by Country 2024 & 2032
- Figure 11: Middle East and Africa AI as a Service Market Revenue Share (%), by Country 2024 & 2032
- Figure 12: North America AI as a Service Market Revenue (Million), by Deployment 2024 & 2032
- Figure 13: North America AI as a Service Market Revenue Share (%), by Deployment 2024 & 2032
- Figure 14: North America AI as a Service Market Revenue (Million), by Organization Size 2024 & 2032
- Figure 15: North America AI as a Service Market Revenue Share (%), by Organization Size 2024 & 2032
- Figure 16: North America AI as a Service Market Revenue (Million), by End-user Industry 2024 & 2032
- Figure 17: North America AI as a Service Market Revenue Share (%), by End-user Industry 2024 & 2032
- Figure 18: North America AI as a Service Market Revenue (Million), by Country 2024 & 2032
- Figure 19: North America AI as a Service Market Revenue Share (%), by Country 2024 & 2032
- Figure 20: Europe AI as a Service Market Revenue (Million), by Deployment 2024 & 2032
- Figure 21: Europe AI as a Service Market Revenue Share (%), by Deployment 2024 & 2032
- Figure 22: Europe AI as a Service Market Revenue (Million), by Organization Size 2024 & 2032
- Figure 23: Europe AI as a Service Market Revenue Share (%), by Organization Size 2024 & 2032
- Figure 24: Europe AI as a Service Market Revenue (Million), by End-user Industry 2024 & 2032
- Figure 25: Europe AI as a Service Market Revenue Share (%), by End-user Industry 2024 & 2032
- Figure 26: Europe AI as a Service Market Revenue (Million), by Country 2024 & 2032
- Figure 27: Europe AI as a Service Market Revenue Share (%), by Country 2024 & 2032
- Figure 28: Asia AI as a Service Market Revenue (Million), by Deployment 2024 & 2032
- Figure 29: Asia AI as a Service Market Revenue Share (%), by Deployment 2024 & 2032
- Figure 30: Asia AI as a Service Market Revenue (Million), by Organization Size 2024 & 2032
- Figure 31: Asia AI as a Service Market Revenue Share (%), by Organization Size 2024 & 2032
- Figure 32: Asia AI as a Service Market Revenue (Million), by End-user Industry 2024 & 2032
- Figure 33: Asia AI as a Service Market Revenue Share (%), by End-user Industry 2024 & 2032
- Figure 34: Asia AI as a Service Market Revenue (Million), by Country 2024 & 2032
- Figure 35: Asia AI as a Service Market Revenue Share (%), by Country 2024 & 2032
- Figure 36: Australia and New Zealand AI as a Service Market Revenue (Million), by Deployment 2024 & 2032
- Figure 37: Australia and New Zealand AI as a Service Market Revenue Share (%), by Deployment 2024 & 2032
- Figure 38: Australia and New Zealand AI as a Service Market Revenue (Million), by Organization Size 2024 & 2032
- Figure 39: Australia and New Zealand AI as a Service Market Revenue Share (%), by Organization Size 2024 & 2032
- Figure 40: Australia and New Zealand AI as a Service Market Revenue (Million), by End-user Industry 2024 & 2032
- Figure 41: Australia and New Zealand AI as a Service Market Revenue Share (%), by End-user Industry 2024 & 2032
- Figure 42: Australia and New Zealand AI as a Service Market Revenue (Million), by Country 2024 & 2032
- Figure 43: Australia and New Zealand AI as a Service Market Revenue Share (%), by Country 2024 & 2032
- Figure 44: Latin America AI as a Service Market Revenue (Million), by Deployment 2024 & 2032
- Figure 45: Latin America AI as a Service Market Revenue Share (%), by Deployment 2024 & 2032
- Figure 46: Latin America AI as a Service Market Revenue (Million), by Organization Size 2024 & 2032
- Figure 47: Latin America AI as a Service Market Revenue Share (%), by Organization Size 2024 & 2032
- Figure 48: Latin America AI as a Service Market Revenue (Million), by End-user Industry 2024 & 2032
- Figure 49: Latin America AI as a Service Market Revenue Share (%), by End-user Industry 2024 & 2032
- Figure 50: Latin America AI as a Service Market Revenue (Million), by Country 2024 & 2032
- Figure 51: Latin America AI as a Service Market Revenue Share (%), by Country 2024 & 2032
- Figure 52: Middle East and Africa AI as a Service Market Revenue (Million), by Deployment 2024 & 2032
- Figure 53: Middle East and Africa AI as a Service Market Revenue Share (%), by Deployment 2024 & 2032
- Figure 54: Middle East and Africa AI as a Service Market Revenue (Million), by Organization Size 2024 & 2032
- Figure 55: Middle East and Africa AI as a Service Market Revenue Share (%), by Organization Size 2024 & 2032
- Figure 56: Middle East and Africa AI as a Service Market Revenue (Million), by End-user Industry 2024 & 2032
- Figure 57: Middle East and Africa AI as a Service Market Revenue Share (%), by End-user Industry 2024 & 2032
- Figure 58: Middle East and Africa AI as a Service Market Revenue (Million), by Country 2024 & 2032
- Figure 59: Middle East and Africa AI as a Service Market Revenue Share (%), by Country 2024 & 2032
List of Tables
- Table 1: Global AI as a Service Market Revenue Million Forecast, by Region 2019 & 2032
- Table 2: Global AI as a Service Market Revenue Million Forecast, by Deployment 2019 & 2032
- Table 3: Global AI as a Service Market Revenue Million Forecast, by Organization Size 2019 & 2032
- Table 4: Global AI as a Service Market Revenue Million Forecast, by End-user Industry 2019 & 2032
- Table 5: Global AI as a Service Market Revenue Million Forecast, by Region 2019 & 2032
- Table 6: Global AI as a Service Market Revenue Million Forecast, by Country 2019 & 2032
- Table 7: AI as a Service Market Revenue (Million) Forecast, by Application 2019 & 2032
- Table 8: Global AI as a Service Market Revenue Million Forecast, by Country 2019 & 2032
- Table 9: AI as a Service Market Revenue (Million) Forecast, by Application 2019 & 2032
- Table 10: Global AI as a Service Market Revenue Million Forecast, by Country 2019 & 2032
- Table 11: AI as a Service Market Revenue (Million) Forecast, by Application 2019 & 2032
- Table 12: Global AI as a Service Market Revenue Million Forecast, by Country 2019 & 2032
- Table 13: AI as a Service Market Revenue (Million) Forecast, by Application 2019 & 2032
- Table 14: Global AI as a Service Market Revenue Million Forecast, by Country 2019 & 2032
- Table 15: AI as a Service Market Revenue (Million) Forecast, by Application 2019 & 2032
- Table 16: Global AI as a Service Market Revenue Million Forecast, by Deployment 2019 & 2032
- Table 17: Global AI as a Service Market Revenue Million Forecast, by Organization Size 2019 & 2032
- Table 18: Global AI as a Service Market Revenue Million Forecast, by End-user Industry 2019 & 2032
- Table 19: Global AI as a Service Market Revenue Million Forecast, by Country 2019 & 2032
- Table 20: Global AI as a Service Market Revenue Million Forecast, by Deployment 2019 & 2032
- Table 21: Global AI as a Service Market Revenue Million Forecast, by Organization Size 2019 & 2032
- Table 22: Global AI as a Service Market Revenue Million Forecast, by End-user Industry 2019 & 2032
- Table 23: Global AI as a Service Market Revenue Million Forecast, by Country 2019 & 2032
- Table 24: Global AI as a Service Market Revenue Million Forecast, by Deployment 2019 & 2032
- Table 25: Global AI as a Service Market Revenue Million Forecast, by Organization Size 2019 & 2032
- Table 26: Global AI as a Service Market Revenue Million Forecast, by End-user Industry 2019 & 2032
- Table 27: Global AI as a Service Market Revenue Million Forecast, by Country 2019 & 2032
- Table 28: Global AI as a Service Market Revenue Million Forecast, by Deployment 2019 & 2032
- Table 29: Global AI as a Service Market Revenue Million Forecast, by Organization Size 2019 & 2032
- Table 30: Global AI as a Service Market Revenue Million Forecast, by End-user Industry 2019 & 2032
- Table 31: Global AI as a Service Market Revenue Million Forecast, by Country 2019 & 2032
- Table 32: Global AI as a Service Market Revenue Million Forecast, by Deployment 2019 & 2032
- Table 33: Global AI as a Service Market Revenue Million Forecast, by Organization Size 2019 & 2032
- Table 34: Global AI as a Service Market Revenue Million Forecast, by End-user Industry 2019 & 2032
- Table 35: Global AI as a Service Market Revenue Million Forecast, by Country 2019 & 2032
- Table 36: Global AI as a Service Market Revenue Million Forecast, by Deployment 2019 & 2032
- Table 37: Global AI as a Service Market Revenue Million Forecast, by Organization Size 2019 & 2032
- Table 38: Global AI as a Service Market Revenue Million Forecast, by End-user Industry 2019 & 2032
- Table 39: Global AI as a Service Market Revenue Million Forecast, by Country 2019 & 2032
Frequently Asked Questions
1. What is the projected Compound Annual Growth Rate (CAGR) of the AI as a Service Market?
The projected CAGR is approximately 36.78%.
2. Which companies are prominent players in the AI as a Service Market?
Key companies in the market include SAS Institute Inc, DATAIKU SAS, BigML Inc, IBM Corporation, Google LLC, Salesforce com Inc, Microsoft Corporation, Craft AI*List Not Exhaustive, Amazon Web Services Inc, Oracle Corporation, H2O Ai Inc.
3. What are the main segments of the AI as a Service Market?
The market segments include Deployment, Organization Size, End-user Industry.
4. Can you provide details about the market size?
The market size is estimated to be USD 15.09 Million as of 2022.
5. What are some drivers contributing to market growth?
Increasing Demand for Predictive and Analytics Solutions; Rising Demand for Enhancing Consumer Experience.
6. What are the notable trends driving market growth?
Increasing Demand for Predictive and Analytics Solutions is Expected to Drive Market Growth.
7. Are there any restraints impacting market growth?
Increasing Security and Privacy Concerns Among Enterprises.
8. Can you provide examples of recent developments in the market?
September 2022: The AI4HealthyCities Health Equity Network was established by the Novartis Foundation, Microsoft AI for Health, and the New York University (NYU) School of Global Public Health as a joint endeavor to employ data analytics and artificial intelligence (AI) to address heart health inequities.
9. What pricing options are available for accessing the report?
Pricing options include single-user, multi-user, and enterprise licenses priced at USD 4750, USD 5250, and USD 8750 respectively.
10. Is the market size provided in terms of value or volume?
The market size is provided in terms of value, measured in Million.
11. Are there any specific market keywords associated with the report?
Yes, the market keyword associated with the report is "AI as a Service Market," which aids in identifying and referencing the specific market segment covered.
12. How do I determine which pricing option suits my needs best?
The pricing options vary based on user requirements and access needs. Individual users may opt for single-user licenses, while businesses requiring broader access may choose multi-user or enterprise licenses for cost-effective access to the report.
13. Are there any additional resources or data provided in the AI as a Service Market report?
While the report offers comprehensive insights, it's advisable to review the specific contents or supplementary materials provided to ascertain if additional resources or data are available.
14. How can I stay updated on further developments or reports in the AI as a Service Market?
To stay informed about further developments, trends, and reports in the AI as a Service Market, consider subscribing to industry newsletters, following relevant companies and organizations, or regularly checking reputable industry news sources and publications.
Methodology
Step 1 - Identification of Relevant Samples Size from Population Database


Step 2 - Approaches for Defining Global Market Size (Value, Volume* & Price*)

Note*: In applicable scenarios
Step 3 - Data Sources
Primary Research
- Web Analytics
- Survey Reports
- Research Institute
- Latest Research Reports
- Opinion Leaders
Secondary Research
- Annual Reports
- White Paper
- Latest Press Release
- Industry Association
- Paid Database
- Investor Presentations

Step 4 - Data Triangulation
Involves using different sources of information in order to increase the validity of a study
These sources are likely to be stakeholders in a program - participants, other researchers, program staff, other community members, and so on.
Then we put all data in single framework & apply various statistical tools to find out the dynamic on the market.
During the analysis stage, feedback from the stakeholder groups would be compared to determine areas of agreement as well as areas of divergence


