
Key Insights
The Image Sensors for Security Applications market is experiencing robust growth, projected to reach a substantial size driven by increasing demand for advanced surveillance systems across various sectors. The market's Compound Annual Growth Rate (CAGR) of 8.83% from 2019-2033 indicates a consistently expanding market, fueled by technological advancements such as higher resolution sensors, improved low-light performance, and the integration of artificial intelligence (AI) and machine learning (ML) capabilities. Key application segments include consumer cameras (home security systems, smart doorbells), commercial cameras (retail, offices, banking), and infrastructure cameras (traffic monitoring, public safety). Leading players like Sony, Canon, and OmniVision are driving innovation, while emerging companies are contributing to market diversification. The Asia-Pacific region is expected to dominate the market due to significant infrastructure development and increasing adoption of smart city initiatives. However, factors such as stringent data privacy regulations and the high initial investment cost of advanced security systems could pose challenges to market expansion.
The market's segmentation by application reveals significant opportunities. The consumer camera segment benefits from the rising popularity of smart homes and connected devices. Commercial applications, particularly in retail and banking, are driven by the need for enhanced security and loss prevention. Infrastructure security projects, such as smart city developments and traffic management systems, are significantly contributing to the growth of the infrastructure camera segment. While North America and Europe represent established markets, the Asia-Pacific region’s rapid economic growth and urbanization are creating substantial growth potential. Continued technological advancements in sensor technology, particularly in areas such as improved image quality, wider dynamic range, and reduced power consumption, will further stimulate market expansion throughout the forecast period. Competitive landscape analysis reveals a blend of established players and innovative startups, fostering competition and driving innovation.
Image Sensors for Security Application Industry: A Comprehensive Market Report (2019-2033)
This in-depth report provides a comprehensive analysis of the Image Sensors for Security Application industry, offering invaluable insights for industry professionals, investors, and strategic decision-makers. The report covers market structure, innovation trends, dynamics, regional performance, leading players, and future outlook, with a focus on the period from 2019 to 2033, using 2025 as the base year. The market is segmented by application: Consumer Cameras, Commercial Cameras, and Infrastructure Cameras. The report projects a market size exceeding $XX Million by 2033.
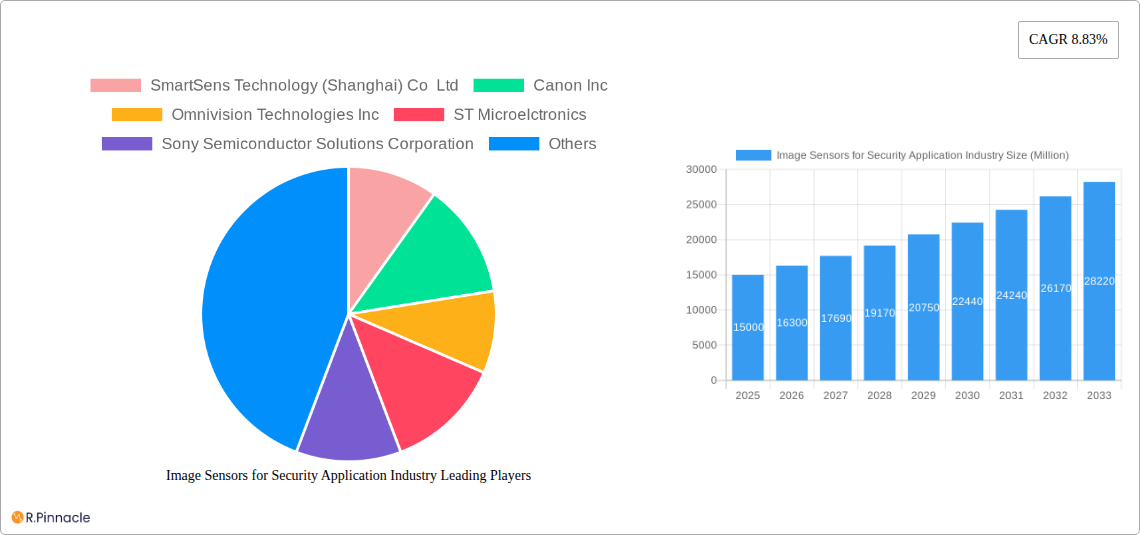
Image Sensors for Security Application Industry Market Structure & Innovation Trends
The Image Sensors for Security Application market exhibits a moderately concentrated structure, with key players such as Sony Semiconductor Solutions Corporation, Omnivision Technologies Inc, and STMicroelectronics holding significant market share. Precise market share figures vary by segment and year, with Sony consistently among the top players. The market is characterized by continuous innovation, driven by advancements in sensor technology (e.g., higher resolution, improved low-light performance, and increased frame rates), artificial intelligence (AI) integration, and the demand for enhanced security features. Regulatory frameworks, such as data privacy regulations (GDPR, CCPA), significantly influence market dynamics. Product substitutes, such as traditional security systems, are gradually being replaced due to the superior capabilities and cost-effectiveness of image sensor-based solutions. End-user demographics are expanding across residential, commercial, and governmental sectors. M&A activity has been relatively moderate in recent years, with deal values averaging $XX Million. Examples include [Insert specific M&A examples if available, otherwise, state "Specific M&A details are not publicly available"].
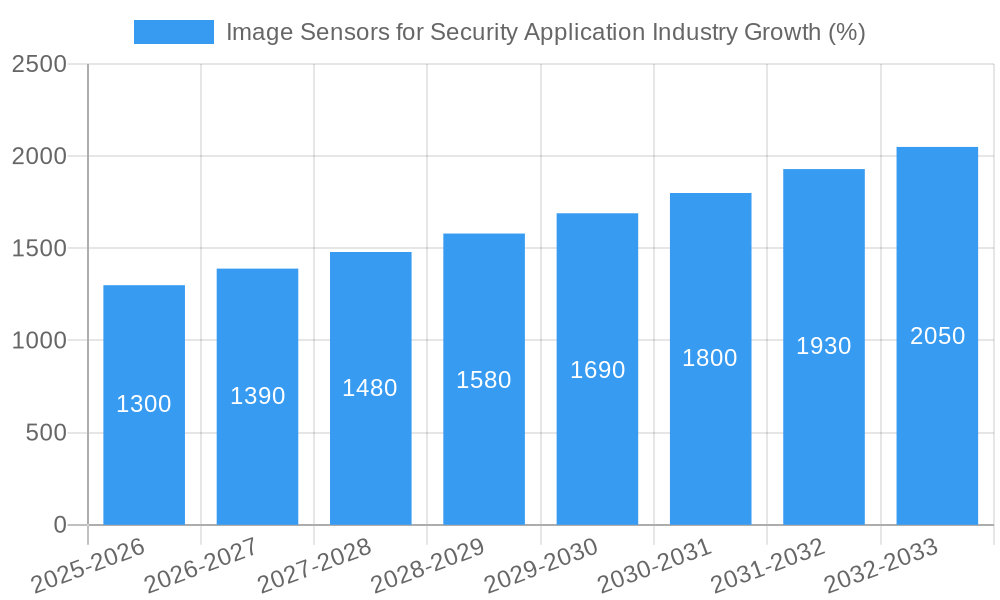
Image Sensors for Security Application Industry Market Dynamics & Trends
The Image Sensors for Security Application market is experiencing robust growth, fueled by several key factors. The increasing demand for enhanced security solutions across various sectors, particularly in smart cities and intelligent transportation systems, is a major driver. Technological advancements, such as the development of high-resolution sensors with improved image quality and low-light capabilities, are further propelling market expansion. Consumer preferences for sophisticated security features in both residential and commercial settings also play a crucial role. The rising adoption of cloud-based security solutions and the integration of AI and machine learning are transforming the market landscape. The compound annual growth rate (CAGR) is projected to be XX% during the forecast period (2025-2033). Market penetration is increasing across various regions, particularly in developed economies. Competitive dynamics are characterized by intense competition among established players and emerging companies, leading to ongoing innovation and price pressures.
Dominant Regions & Segments in Image Sensors for Security Application Industry
The Asia-Pacific region currently dominates the Image Sensors for Security Application market, primarily due to the rapid growth of urbanization, increasing government investments in security infrastructure, and a large consumer base. Within the application segments, Infrastructure Cameras holds the largest market share, followed by Commercial Cameras and Consumer Cameras.
Key Drivers in Asia-Pacific:
- Rapid urbanization and smart city initiatives
- Government investments in security infrastructure
- Strong economic growth
- Increasing adoption of advanced security technologies
Infrastructure Cameras Dominance:
- High demand from government agencies and private sector companies for surveillance and monitoring solutions
- Integration with sophisticated video analytics and cloud-based security platforms
- Growing adoption in critical infrastructure projects (e.g., transportation, energy).
The dominance of the Asia-Pacific region is expected to continue throughout the forecast period. The high growth rate of Infrastructure Cameras is projected to remain consistent.
Image Sensors for Security Application Industry Product Innovations
Recent product innovations focus on improving image quality in low-light conditions, enhancing sensor resolution, and incorporating advanced features such as AI-powered object detection and facial recognition. These improvements enable more accurate and effective security solutions, leading to higher market adoption. The integration of AI and machine learning capabilities is a significant trend, enabling sophisticated video analytics and real-time threat detection. This trend aligns with increasing consumer demand for smart security systems that offer enhanced accuracy and efficiency.
Report Scope & Segmentation Analysis
This report provides a detailed analysis of the Image Sensors for Security Application market, segmented by application:
- Consumer Cameras: This segment comprises image sensors used in residential security systems, including smart doorbells, security cameras, and home monitoring systems. The market is driven by increasing consumer adoption of smart home technologies and improved affordability.
- Commercial Cameras: This segment covers image sensors used in commercial security applications, such as retail stores, offices, and industrial facilities. The demand for enhanced security and loss prevention measures fuels growth in this segment.
- Infrastructure Cameras: This segment encompasses image sensors utilized in large-scale infrastructure projects, including smart cities, transportation systems, and public spaces. Government initiatives and the need for comprehensive surveillance drive growth in this segment.
Each segment's growth projections, market sizes, and competitive dynamics are thoroughly analyzed within the report.
Key Drivers of Image Sensors for Security Application Industry Growth
Several factors contribute to the growth of the Image Sensors for Security Application industry. Technological advancements, such as improved sensor resolution, enhanced low-light performance, and AI integration, are key drivers. The increasing demand for enhanced security measures across various sectors, driven by rising crime rates and security concerns, significantly fuels market expansion. Government initiatives promoting smart cities and intelligent transportation systems further stimulate industry growth. Favorable economic conditions in many regions contribute to increased investment in security infrastructure.
Challenges in the Image Sensors for Security Application Industry Sector
The Image Sensors for Security Application industry faces several challenges. High initial investment costs for advanced security systems can be a barrier to entry, particularly for small and medium-sized enterprises. Supply chain disruptions and the availability of raw materials can impact production and costs. Intense competition from both established and emerging players creates pressure on pricing and profitability. Regulatory hurdles, such as data privacy regulations and cybersecurity concerns, pose significant compliance challenges.
Emerging Opportunities in Image Sensors for Security Application Industry
Emerging opportunities include the growing adoption of AI-powered video analytics, the integration of image sensors with IoT devices, and the expansion into new markets, such as autonomous vehicles and robotics. The development of advanced sensor technologies, such as 3D image sensors and hyperspectral imaging, offer significant growth potential. The increasing demand for edge computing solutions and the adoption of 5G technology create further opportunities for market expansion.
Leading Players in the Image Sensors for Security Application Industry Market
- SmartSens Technology (Shanghai) Co Ltd
- Canon Inc
- Omnivision Technologies Inc
- STMicroelectronics
- Sony Semiconductor Solutions Corporation
- Galaxycore
- Toshiba Corporation
- SK Hynix Inc
- Semiconductor Components Industries LLC
- Panasonic Holdings Corporation
Key Developments in Image Sensors for Security Application Industry Industry
- [Date]: Company X launched a new high-resolution image sensor with improved low-light performance.
- [Date]: Company Y announced a strategic partnership to integrate AI capabilities into its image sensor solutions.
- [Date]: A major merger between two key players reshaped the market landscape.
- [Add more bullet points with specific dates and developments as available]
Future Outlook for Image Sensors for Security Application Industry Market
The Image Sensors for Security Application market is poised for continued strong growth, driven by technological innovation, increased demand for enhanced security, and the expansion into new applications. The adoption of AI-powered video analytics, the growth of smart cities, and the rising demand for robust cybersecurity solutions will significantly contribute to market expansion. Strategic partnerships and acquisitions will continue to shape the competitive landscape, driving innovation and market consolidation. The market's future potential is significant, offering substantial opportunities for growth and investment.
Image Sensors for Security Application Industry Segmentation
-
1. Application
- 1.1. Consumer Cameras
- 1.2. Commercial Cameras
- 1.3. Infrastructure Cameras
Image Sensors for Security Application Industry Segmentation By Geography
- 1. North America
- 2. Europe
- 3. Asia Pacific
- 4. Latin America
- 5. Middle East and Africa
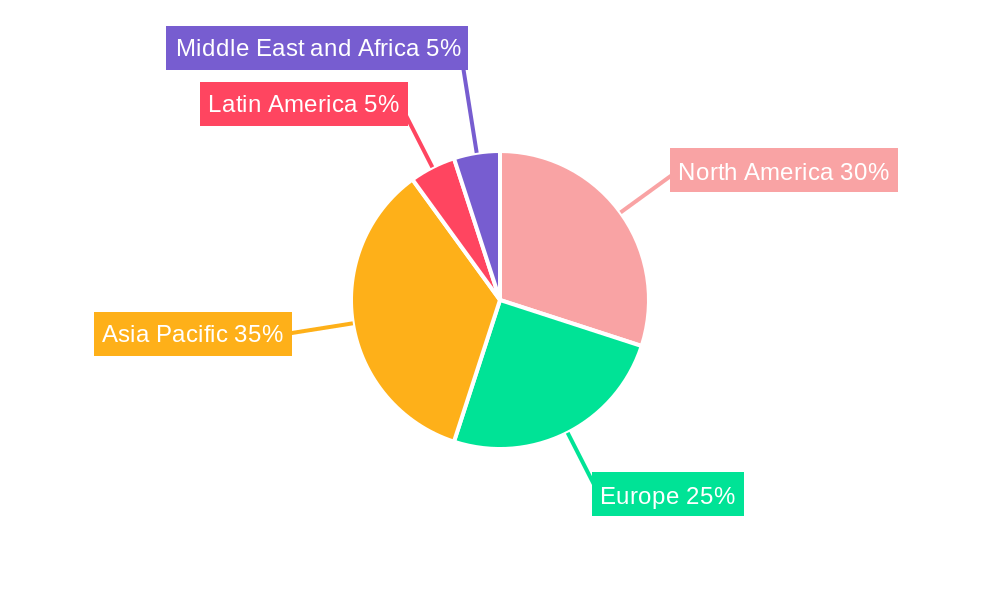
Image Sensors for Security Application Industry REPORT HIGHLIGHTS
| Aspects | Details |
|---|---|
| Study Period | 2019-2033 |
| Base Year | 2024 |
| Estimated Year | 2025 |
| Forecast Period | 2025-2033 |
| Historical Period | 2019-2024 |
| Growth Rate | CAGR of 8.83% from 2019-2033 |
| Segmentation |
|
Table of Contents
- 1. Introduction
- 1.1. Research Scope
- 1.2. Market Segmentation
- 1.3. Research Methodology
- 1.4. Definitions and Assumptions
- 2. Executive Summary
- 2.1. Introduction
- 3. Market Dynamics
- 3.1. Introduction
- 3.2. Market Drivers
- 3.2.1. The Emergence of Edge Computing is Key for the Security Industry; Growing Demand from Smart Cities
- 3.3. Market Restrains
- 3.3.1. High Manufacturing Costs of Large Chip Image Sensors
- 3.4. Market Trends
- 3.4.1. Growing Demand From Smart Cities
- 4. Market Factor Analysis
- 4.1. Porters Five Forces
- 4.2. Supply/Value Chain
- 4.3. PESTEL analysis
- 4.4. Market Entropy
- 4.5. Patent/Trademark Analysis
- 5. Global Image Sensors for Security Application Industry Analysis, Insights and Forecast, 2019-2031
- 5.1. Market Analysis, Insights and Forecast - by Application
- 5.1.1. Consumer Cameras
- 5.1.2. Commercial Cameras
- 5.1.3. Infrastructure Cameras
- 5.2. Market Analysis, Insights and Forecast - by Region
- 5.2.1. North America
- 5.2.2. Europe
- 5.2.3. Asia Pacific
- 5.2.4. Latin America
- 5.2.5. Middle East and Africa
- 5.1. Market Analysis, Insights and Forecast - by Application
- 6. North America Image Sensors for Security Application Industry Analysis, Insights and Forecast, 2019-2031
- 6.1. Market Analysis, Insights and Forecast - by Application
- 6.1.1. Consumer Cameras
- 6.1.2. Commercial Cameras
- 6.1.3. Infrastructure Cameras
- 6.1. Market Analysis, Insights and Forecast - by Application
- 7. Europe Image Sensors for Security Application Industry Analysis, Insights and Forecast, 2019-2031
- 7.1. Market Analysis, Insights and Forecast - by Application
- 7.1.1. Consumer Cameras
- 7.1.2. Commercial Cameras
- 7.1.3. Infrastructure Cameras
- 7.1. Market Analysis, Insights and Forecast - by Application
- 8. Asia Pacific Image Sensors for Security Application Industry Analysis, Insights and Forecast, 2019-2031
- 8.1. Market Analysis, Insights and Forecast - by Application
- 8.1.1. Consumer Cameras
- 8.1.2. Commercial Cameras
- 8.1.3. Infrastructure Cameras
- 8.1. Market Analysis, Insights and Forecast - by Application
- 9. Latin America Image Sensors for Security Application Industry Analysis, Insights and Forecast, 2019-2031
- 9.1. Market Analysis, Insights and Forecast - by Application
- 9.1.1. Consumer Cameras
- 9.1.2. Commercial Cameras
- 9.1.3. Infrastructure Cameras
- 9.1. Market Analysis, Insights and Forecast - by Application
- 10. Middle East and Africa Image Sensors for Security Application Industry Analysis, Insights and Forecast, 2019-2031
- 10.1. Market Analysis, Insights and Forecast - by Application
- 10.1.1. Consumer Cameras
- 10.1.2. Commercial Cameras
- 10.1.3. Infrastructure Cameras
- 10.1. Market Analysis, Insights and Forecast - by Application
- 11. North America Image Sensors for Security Application Industry Analysis, Insights and Forecast, 2019-2031
- 11.1. Market Analysis, Insights and Forecast - By Country/Sub-region
- 11.1.1.
- 12. Europe Image Sensors for Security Application Industry Analysis, Insights and Forecast, 2019-2031
- 12.1. Market Analysis, Insights and Forecast - By Country/Sub-region
- 12.1.1.
- 13. Asia Pacific Image Sensors for Security Application Industry Analysis, Insights and Forecast, 2019-2031
- 13.1. Market Analysis, Insights and Forecast - By Country/Sub-region
- 13.1.1.
- 14. Latin America Image Sensors for Security Application Industry Analysis, Insights and Forecast, 2019-2031
- 14.1. Market Analysis, Insights and Forecast - By Country/Sub-region
- 14.1.1.
- 15. Middle East and Africa Image Sensors for Security Application Industry Analysis, Insights and Forecast, 2019-2031
- 15.1. Market Analysis, Insights and Forecast - By Country/Sub-region
- 15.1.1.
- 16. Competitive Analysis
- 16.1. Global Market Share Analysis 2024
- 16.2. Company Profiles
- 16.2.1 SmartSens Technology (Shanghai) Co Ltd
- 16.2.1.1. Overview
- 16.2.1.2. Products
- 16.2.1.3. SWOT Analysis
- 16.2.1.4. Recent Developments
- 16.2.1.5. Financials (Based on Availability)
- 16.2.2 Canon Inc
- 16.2.2.1. Overview
- 16.2.2.2. Products
- 16.2.2.3. SWOT Analysis
- 16.2.2.4. Recent Developments
- 16.2.2.5. Financials (Based on Availability)
- 16.2.3 Omnivision Technologies Inc
- 16.2.3.1. Overview
- 16.2.3.2. Products
- 16.2.3.3. SWOT Analysis
- 16.2.3.4. Recent Developments
- 16.2.3.5. Financials (Based on Availability)
- 16.2.4 ST Microelctronics
- 16.2.4.1. Overview
- 16.2.4.2. Products
- 16.2.4.3. SWOT Analysis
- 16.2.4.4. Recent Developments
- 16.2.4.5. Financials (Based on Availability)
- 16.2.5 Sony Semiconductor Solutions Corporation
- 16.2.5.1. Overview
- 16.2.5.2. Products
- 16.2.5.3. SWOT Analysis
- 16.2.5.4. Recent Developments
- 16.2.5.5. Financials (Based on Availability)
- 16.2.6 Galaxycore
- 16.2.6.1. Overview
- 16.2.6.2. Products
- 16.2.6.3. SWOT Analysis
- 16.2.6.4. Recent Developments
- 16.2.6.5. Financials (Based on Availability)
- 16.2.7 Toshiba Corporation*List Not Exhaustive
- 16.2.7.1. Overview
- 16.2.7.2. Products
- 16.2.7.3. SWOT Analysis
- 16.2.7.4. Recent Developments
- 16.2.7.5. Financials (Based on Availability)
- 16.2.8 SK Hynix Inc
- 16.2.8.1. Overview
- 16.2.8.2. Products
- 16.2.8.3. SWOT Analysis
- 16.2.8.4. Recent Developments
- 16.2.8.5. Financials (Based on Availability)
- 16.2.9 Semiconductor Components Industries LLC
- 16.2.9.1. Overview
- 16.2.9.2. Products
- 16.2.9.3. SWOT Analysis
- 16.2.9.4. Recent Developments
- 16.2.9.5. Financials (Based on Availability)
- 16.2.10 Panasonic Holdings Corporation
- 16.2.10.1. Overview
- 16.2.10.2. Products
- 16.2.10.3. SWOT Analysis
- 16.2.10.4. Recent Developments
- 16.2.10.5. Financials (Based on Availability)
- 16.2.1 SmartSens Technology (Shanghai) Co Ltd
List of Figures
- Figure 1: Global Image Sensors for Security Application Industry Revenue Breakdown (Million, %) by Region 2024 & 2032
- Figure 2: North America Image Sensors for Security Application Industry Revenue (Million), by Country 2024 & 2032
- Figure 3: North America Image Sensors for Security Application Industry Revenue Share (%), by Country 2024 & 2032
- Figure 4: Europe Image Sensors for Security Application Industry Revenue (Million), by Country 2024 & 2032
- Figure 5: Europe Image Sensors for Security Application Industry Revenue Share (%), by Country 2024 & 2032
- Figure 6: Asia Pacific Image Sensors for Security Application Industry Revenue (Million), by Country 2024 & 2032
- Figure 7: Asia Pacific Image Sensors for Security Application Industry Revenue Share (%), by Country 2024 & 2032
- Figure 8: Latin America Image Sensors for Security Application Industry Revenue (Million), by Country 2024 & 2032
- Figure 9: Latin America Image Sensors for Security Application Industry Revenue Share (%), by Country 2024 & 2032
- Figure 10: Middle East and Africa Image Sensors for Security Application Industry Revenue (Million), by Country 2024 & 2032
- Figure 11: Middle East and Africa Image Sensors for Security Application Industry Revenue Share (%), by Country 2024 & 2032
- Figure 12: North America Image Sensors for Security Application Industry Revenue (Million), by Application 2024 & 2032
- Figure 13: North America Image Sensors for Security Application Industry Revenue Share (%), by Application 2024 & 2032
- Figure 14: North America Image Sensors for Security Application Industry Revenue (Million), by Country 2024 & 2032
- Figure 15: North America Image Sensors for Security Application Industry Revenue Share (%), by Country 2024 & 2032
- Figure 16: Europe Image Sensors for Security Application Industry Revenue (Million), by Application 2024 & 2032
- Figure 17: Europe Image Sensors for Security Application Industry Revenue Share (%), by Application 2024 & 2032
- Figure 18: Europe Image Sensors for Security Application Industry Revenue (Million), by Country 2024 & 2032
- Figure 19: Europe Image Sensors for Security Application Industry Revenue Share (%), by Country 2024 & 2032
- Figure 20: Asia Pacific Image Sensors for Security Application Industry Revenue (Million), by Application 2024 & 2032
- Figure 21: Asia Pacific Image Sensors for Security Application Industry Revenue Share (%), by Application 2024 & 2032
- Figure 22: Asia Pacific Image Sensors for Security Application Industry Revenue (Million), by Country 2024 & 2032
- Figure 23: Asia Pacific Image Sensors for Security Application Industry Revenue Share (%), by Country 2024 & 2032
- Figure 24: Latin America Image Sensors for Security Application Industry Revenue (Million), by Application 2024 & 2032
- Figure 25: Latin America Image Sensors for Security Application Industry Revenue Share (%), by Application 2024 & 2032
- Figure 26: Latin America Image Sensors for Security Application Industry Revenue (Million), by Country 2024 & 2032
- Figure 27: Latin America Image Sensors for Security Application Industry Revenue Share (%), by Country 2024 & 2032
- Figure 28: Middle East and Africa Image Sensors for Security Application Industry Revenue (Million), by Application 2024 & 2032
- Figure 29: Middle East and Africa Image Sensors for Security Application Industry Revenue Share (%), by Application 2024 & 2032
- Figure 30: Middle East and Africa Image Sensors for Security Application Industry Revenue (Million), by Country 2024 & 2032
- Figure 31: Middle East and Africa Image Sensors for Security Application Industry Revenue Share (%), by Country 2024 & 2032
List of Tables
- Table 1: Global Image Sensors for Security Application Industry Revenue Million Forecast, by Region 2019 & 2032
- Table 2: Global Image Sensors for Security Application Industry Revenue Million Forecast, by Application 2019 & 2032
- Table 3: Global Image Sensors for Security Application Industry Revenue Million Forecast, by Region 2019 & 2032
- Table 4: Global Image Sensors for Security Application Industry Revenue Million Forecast, by Country 2019 & 2032
- Table 5: Image Sensors for Security Application Industry Revenue (Million) Forecast, by Application 2019 & 2032
- Table 6: Global Image Sensors for Security Application Industry Revenue Million Forecast, by Country 2019 & 2032
- Table 7: Image Sensors for Security Application Industry Revenue (Million) Forecast, by Application 2019 & 2032
- Table 8: Global Image Sensors for Security Application Industry Revenue Million Forecast, by Country 2019 & 2032
- Table 9: Image Sensors for Security Application Industry Revenue (Million) Forecast, by Application 2019 & 2032
- Table 10: Global Image Sensors for Security Application Industry Revenue Million Forecast, by Country 2019 & 2032
- Table 11: Image Sensors for Security Application Industry Revenue (Million) Forecast, by Application 2019 & 2032
- Table 12: Global Image Sensors for Security Application Industry Revenue Million Forecast, by Country 2019 & 2032
- Table 13: Image Sensors for Security Application Industry Revenue (Million) Forecast, by Application 2019 & 2032
- Table 14: Global Image Sensors for Security Application Industry Revenue Million Forecast, by Application 2019 & 2032
- Table 15: Global Image Sensors for Security Application Industry Revenue Million Forecast, by Country 2019 & 2032
- Table 16: Global Image Sensors for Security Application Industry Revenue Million Forecast, by Application 2019 & 2032
- Table 17: Global Image Sensors for Security Application Industry Revenue Million Forecast, by Country 2019 & 2032
- Table 18: Global Image Sensors for Security Application Industry Revenue Million Forecast, by Application 2019 & 2032
- Table 19: Global Image Sensors for Security Application Industry Revenue Million Forecast, by Country 2019 & 2032
- Table 20: Global Image Sensors for Security Application Industry Revenue Million Forecast, by Application 2019 & 2032
- Table 21: Global Image Sensors for Security Application Industry Revenue Million Forecast, by Country 2019 & 2032
- Table 22: Global Image Sensors for Security Application Industry Revenue Million Forecast, by Application 2019 & 2032
- Table 23: Global Image Sensors for Security Application Industry Revenue Million Forecast, by Country 2019 & 2032
Frequently Asked Questions
1. What is the projected Compound Annual Growth Rate (CAGR) of the Image Sensors for Security Application Industry?
The projected CAGR is approximately 8.83%.
2. Which companies are prominent players in the Image Sensors for Security Application Industry?
Key companies in the market include SmartSens Technology (Shanghai) Co Ltd, Canon Inc, Omnivision Technologies Inc, ST Microelctronics, Sony Semiconductor Solutions Corporation, Galaxycore, Toshiba Corporation*List Not Exhaustive, SK Hynix Inc, Semiconductor Components Industries LLC, Panasonic Holdings Corporation.
3. What are the main segments of the Image Sensors for Security Application Industry?
The market segments include Application.
4. Can you provide details about the market size?
The market size is estimated to be USD XX Million as of 2022.
5. What are some drivers contributing to market growth?
The Emergence of Edge Computing is Key for the Security Industry; Growing Demand from Smart Cities.
6. What are the notable trends driving market growth?
Growing Demand From Smart Cities.
7. Are there any restraints impacting market growth?
High Manufacturing Costs of Large Chip Image Sensors.
8. Can you provide examples of recent developments in the market?
N/A
9. What pricing options are available for accessing the report?
Pricing options include single-user, multi-user, and enterprise licenses priced at USD 4750, USD 5250, and USD 8750 respectively.
10. Is the market size provided in terms of value or volume?
The market size is provided in terms of value, measured in Million.
11. Are there any specific market keywords associated with the report?
Yes, the market keyword associated with the report is "Image Sensors for Security Application Industry," which aids in identifying and referencing the specific market segment covered.
12. How do I determine which pricing option suits my needs best?
The pricing options vary based on user requirements and access needs. Individual users may opt for single-user licenses, while businesses requiring broader access may choose multi-user or enterprise licenses for cost-effective access to the report.
13. Are there any additional resources or data provided in the Image Sensors for Security Application Industry report?
While the report offers comprehensive insights, it's advisable to review the specific contents or supplementary materials provided to ascertain if additional resources or data are available.
14. How can I stay updated on further developments or reports in the Image Sensors for Security Application Industry?
To stay informed about further developments, trends, and reports in the Image Sensors for Security Application Industry, consider subscribing to industry newsletters, following relevant companies and organizations, or regularly checking reputable industry news sources and publications.
Methodology
Step 1 - Identification of Relevant Samples Size from Population Database


Step 2 - Approaches for Defining Global Market Size (Value, Volume* & Price*)

Note*: In applicable scenarios
Step 3 - Data Sources
Primary Research
- Web Analytics
- Survey Reports
- Research Institute
- Latest Research Reports
- Opinion Leaders
Secondary Research
- Annual Reports
- White Paper
- Latest Press Release
- Industry Association
- Paid Database
- Investor Presentations

Step 4 - Data Triangulation
Involves using different sources of information in order to increase the validity of a study
These sources are likely to be stakeholders in a program - participants, other researchers, program staff, other community members, and so on.
Then we put all data in single framework & apply various statistical tools to find out the dynamic on the market.
During the analysis stage, feedback from the stakeholder groups would be compared to determine areas of agreement as well as areas of divergence


