
Key Insights
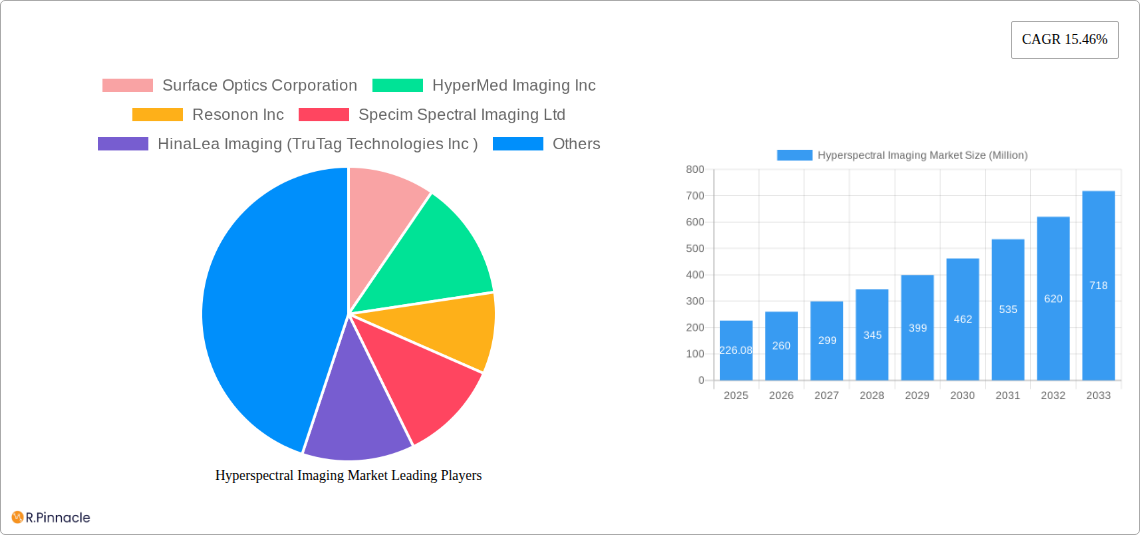
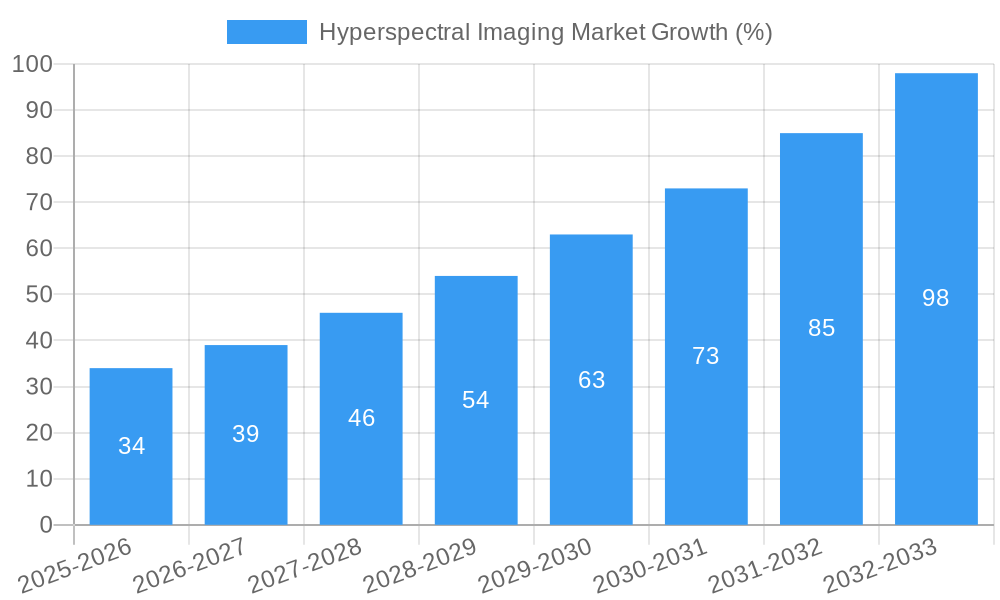
The hyperspectral imaging market is experiencing robust growth, projected to reach \$226.08 million in 2025 and exhibiting a Compound Annual Growth Rate (CAGR) of 15.46% from 2025 to 2033. This expansion is fueled by several key drivers. The increasing adoption of hyperspectral imaging across diverse sectors, particularly food and agriculture for quality control and precision farming, is a significant contributor. Furthermore, advancements in sensor technology, leading to improved image resolution and reduced costs, are making hyperspectral imaging more accessible to a wider range of applications. The healthcare sector is another key growth driver, with applications in disease diagnostics and personalized medicine gaining traction. The demand for enhanced security and surveillance in the defense sector is also contributing to market growth. While data limitations prevent precise quantification of each driver's individual impact, it's evident that technological advancements and the expanding application scope are the primary catalysts for this burgeoning market.
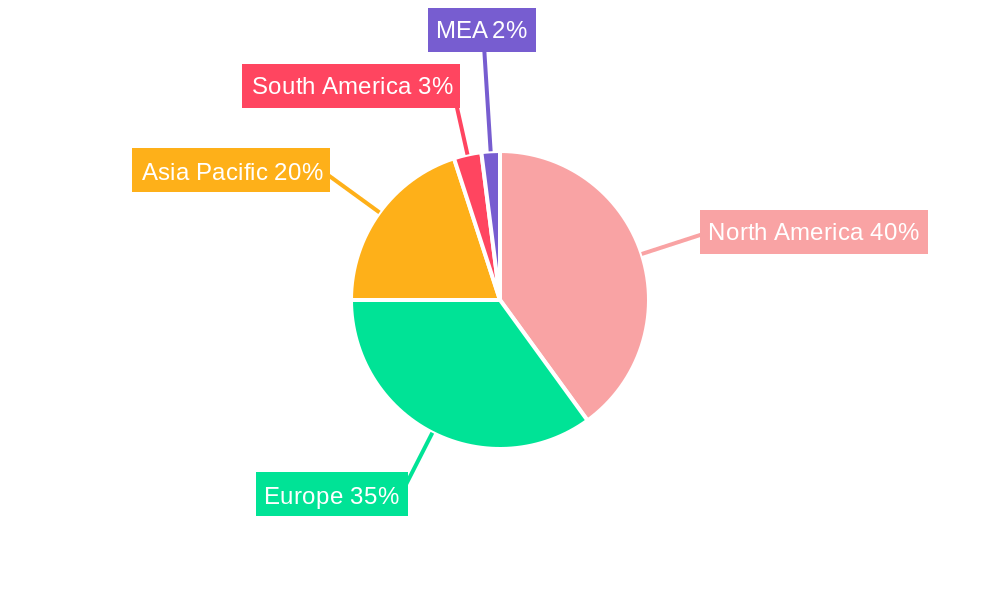
Market restraints include the relatively high initial investment costs associated with hyperspectral imaging systems, which can be prohibitive for some smaller businesses or research groups. Data analysis and processing require specialized software and expertise, adding to the overall cost and complexity. However, ongoing technological developments are addressing these limitations, with the emergence of more affordable and user-friendly systems and software gradually mitigating these barriers. The competitive landscape is characterized by both established players like Surface Optics Corporation and Corning Incorporated, and emerging companies specializing in niche applications. This healthy competition fosters innovation and drives down costs, further propelling market growth. Geographical distribution shows strong performance across North America and Europe, with Asia-Pacific also poised for significant expansion driven by increasing industrialization and technological adoption in key economies like China and India.
Hyperspectral Imaging Market Report: 2019-2033
This comprehensive report provides an in-depth analysis of the Hyperspectral Imaging Market, offering invaluable insights for industry professionals, investors, and researchers. Covering the period 2019-2033, with a focus on 2025, this report analyzes market dynamics, competitive landscapes, and future growth projections. The global market is expected to reach xx Million by 2033, exhibiting a CAGR of xx% during the forecast period (2025-2033).
Hyperspectral Imaging Market Structure & Innovation Trends
The hyperspectral imaging market exhibits a moderately concentrated structure, with key players such as Surface Optics Corporation, HyperMed Imaging Inc, and Resonon Inc holding significant market share. However, the market also features several smaller, specialized companies contributing to innovation.
Market Concentration: The top 5 players account for approximately xx% of the global market share in 2025. Market share data for individual companies is not publicly available for all companies, therefore an estimate for this metric is provided.
Innovation Drivers: Technological advancements in sensor technology, improved data processing capabilities, and the development of user-friendly software are driving market innovation. The increasing demand for high-resolution imaging across various applications further fuels this growth.
Regulatory Frameworks: Government regulations regarding data privacy and security, particularly in sectors like healthcare and defense, influence market growth. Compliance requirements and data security standards are vital considerations for market players.
Product Substitutes: While hyperspectral imaging offers unique capabilities, alternative technologies like multispectral imaging and other sensing methods exist. The competitive landscape is influenced by the cost-effectiveness and specific application requirements of these substitutes.
End-User Demographics: The market is driven by diverse end-user sectors including food and agriculture, healthcare, defense, and mining. The specific needs and applications within each sector shape the demand for different types of hyperspectral imaging systems and associated services.
M&A Activities: The hyperspectral imaging market has witnessed a moderate level of mergers and acquisitions (M&A) activity. Deal values have varied, with some significant acquisitions exceeding xx Million, driving consolidation and expanding the technological capabilities of leading players. However, precise M&A deal values are often not publicly disclosed.
Hyperspectral Imaging Market Dynamics & Trends
The hyperspectral imaging market is experiencing significant growth, propelled by several key factors. Technological advancements, particularly in sensor miniaturization and improved data processing algorithms, are lowering the cost and increasing the accessibility of hyperspectral imaging systems. The rising demand for precise and detailed information across various sectors, coupled with increasing government funding for research and development, further stimulates market expansion.
The increasing adoption of hyperspectral imaging in applications like precision agriculture, where it helps optimize crop management and yield, is a major driver. Similarly, the growing demand for advanced diagnostic tools in healthcare and the need for efficient resource management in mining contribute significantly to market growth.
Competitive dynamics are intensifying as established players expand their product portfolios and new entrants emerge. The market is witnessing the adoption of innovative business models, including software-as-a-service (SaaS) offerings, further influencing market dynamics.
The market penetration of hyperspectral imaging is steadily increasing, particularly in developed regions. However, the adoption rate varies across different end-user sectors and geographical regions due to factors such as cost constraints and lack of awareness.
Dominant Regions & Segments in Hyperspectral Imaging Market
The North American region currently holds a dominant position in the hyperspectral imaging market, primarily driven by significant investments in research and development, a well-established technology ecosystem, and the presence of major industry players. However, other regions like Europe and Asia-Pacific are witnessing strong growth.
- Key Drivers in North America: Strong government support for research and development, presence of major industry players, and high technological adoption rates within end-user sectors.
- Key Drivers in Europe: Growing demand across sectors like defense and agriculture, government initiatives promoting technology adoption, increasing investments in research and development, and a strong presence of established players.
- Key Drivers in Asia-Pacific: Rapid industrialization, rising disposable incomes, increasing government investments in infrastructure development, particularly in countries like China and India, and increasing demand for advanced technologies in various industries.
The Healthcare segment exhibits the highest growth potential within the end-user verticals, driven by the increasing demand for precise diagnostic tools, improved therapeutic interventions, and a greater focus on personalized medicine. The Food and Agriculture sector also shows strong growth, driven by applications in precision farming, quality control, and food safety.
Hyperspectral Imaging Market Product Innovations
Recent advancements have focused on developing smaller, lighter, and more cost-effective hyperspectral imaging systems. The integration of artificial intelligence (AI) and machine learning (ML) algorithms into these systems enhances data analysis and interpretation capabilities, expanding the range of applications. Advances in sensor technology are also enabling broader spectral coverage and improved sensitivity. These advancements improve market fit by enhancing usability and accessibility for a wider range of users and applications.
Report Scope & Segmentation Analysis
This report segments the hyperspectral imaging market by end-user:
Food and Agriculture: This segment is projected to witness significant growth due to applications in crop monitoring, yield prediction, and food quality assessment. The market is competitive, with several players offering tailored solutions. The market size is estimated to be xx Million in 2025.
Healthcare: Driven by applications in disease diagnosis, surgical guidance, and drug discovery, this segment exhibits high growth potential. Competitive landscape is characterized by the presence of both large established companies and specialized startups. The market size is predicted at xx Million in 2025.
Defense: High demand for real-time surveillance and target identification drives growth in this segment. Technological advancements focus on improved image resolution and sensitivity for enhanced performance. The market size is estimated at xx Million in 2025.
Mining and Metrology: This segment is driven by the need for precise material analysis and process optimization. The market size is relatively smaller but shows steady growth. The 2025 market value is projected to be xx Million.
Other End-user Verticals: This encompasses various sectors like environmental monitoring, industrial inspection, and forensic science. The market is characterized by diverse applications and a moderate growth rate. The 2025 market size is projected at xx Million.
Key Drivers of Hyperspectral Imaging Market Growth
Several key factors are driving market growth:
Technological advancements: Miniaturization of sensors, improved data processing capabilities, and the integration of AI and ML algorithms are significantly reducing the cost and increasing the ease of use of hyperspectral imaging systems.
Increased demand across diverse sectors: The growing need for detailed information in applications like precision agriculture, healthcare diagnostics, and resource management in mining fuels market expansion.
Government funding and policy support: Government initiatives promoting research and development in hyperspectral imaging technologies incentivize innovation and market growth.
Challenges in the Hyperspectral Imaging Market Sector
Several factors hinder market growth:
High initial investment costs: The high cost of hyperspectral imaging systems can be a barrier for adoption, particularly for small businesses or organizations with limited budgets.
Data processing and analysis complexity: The large datasets generated by hyperspectral imaging systems require specialized software and expertise for analysis, which can be a challenge for some users.
Competition from alternative technologies: Multispectral imaging and other sensing techniques offer alternative solutions with lower cost in some applications, representing a competitive challenge.
Emerging Opportunities in Hyperspectral Imaging Market
Emerging opportunities exist in:
New applications: Expanding into new sectors like environmental monitoring, forensic science, and art conservation offers significant growth potential.
Advanced data analytics: Integrating AI and ML for more efficient and automated data analysis will enhance the value proposition of hyperspectral imaging systems.
Integration with other technologies: Combining hyperspectral imaging with other technologies like drones and robotics will create new opportunities and applications.
Leading Players in the Hyperspectral Imaging Market Market
- Surface Optics Corporation
- HyperMed Imaging Inc
- Resonon Inc
- Specim Spectral Imaging Ltd
- HinaLea Imaging (TruTag Technologies Inc)
- Headwall Photonics Inc
- Telops Inc
- Cubert GmbH
- BaySpec Inc
- Galileo Group Inc
- XIMEA GmbH
- Norsk Elektro Optikk AS
- Brimrose Corporation of America
- Corning Incorporated
- ITRES Research Limited
Key Developments in Hyperspectral Imaging Market Industry
December 2023: SPECIM launched an upgraded FX50 middle wave infrared hyperspectral camera model with improved specifications (2.7 - 5.3 μm spectral range, 640-pixel spatial resolution, 35 nm spectral resolution, 30 μm pixel size, 377 fps frame rate). This enhances capabilities for various applications.
November 2023: European Space Imaging (EUSI) and Pixxel partnered to bring hyperspectral imaging to the European market, expanding market reach and creating new opportunities in remote sensing.
June 2023: HinaLea Imaging unveiled a new hyperspectral camera (Model 4455) covering the 1200-2100 nm spectral range, enabling detection and classification of previously invisible materials. This expands the range of applications in chemical analysis and material science.
Future Outlook for Hyperspectral Imaging Market Market
The hyperspectral imaging market is poised for continued growth, driven by technological advancements, increased demand across diverse sectors, and government support. New applications, particularly in areas such as environmental monitoring and personalized medicine, will drive market expansion. The integration of AI and ML will further enhance data processing and analysis capabilities, while the development of more cost-effective and user-friendly systems will broaden market accessibility. These factors suggest significant potential for growth and investment in the coming years.
Hyperspectral Imaging Market Segmentation
-
1. End-user Industry
- 1.1. Food and Agriculture
- 1.2. Healthcare
- 1.3. Defense
- 1.4. Mining and Metrology
- 1.5. Recycling
- 1.6. Other End-user Verticals
Hyperspectral Imaging Market Segmentation By Geography
- 1. North America
- 2. Europe
- 3. Asia
- 4. Australia and New Zealand
- 5. Latin America
- 6. Middle East and Africa
Hyperspectral Imaging Market REPORT HIGHLIGHTS
| Aspects | Details |
|---|---|
| Study Period | 2019-2033 |
| Base Year | 2024 |
| Estimated Year | 2025 |
| Forecast Period | 2025-2033 |
| Historical Period | 2019-2024 |
| Growth Rate | CAGR of 15.46% from 2019-2033 |
| Segmentation |
|
Table of Contents
- 1. Introduction
- 1.1. Research Scope
- 1.2. Market Segmentation
- 1.3. Research Methodology
- 1.4. Definitions and Assumptions
- 2. Executive Summary
- 2.1. Introduction
- 3. Market Dynamics
- 3.1. Introduction
- 3.2. Market Drivers
- 3.2.1. Technological Advancements; Increasing Demand for Data Accuracy and Consistency
- 3.3. Market Restrains
- 3.3.1. High Costs Associated with the Use of Hyperspectral Imaging
- 3.4. Market Trends
- 3.4.1. Healthcare to be the Fastest Growing End User Segment
- 4. Market Factor Analysis
- 4.1. Porters Five Forces
- 4.2. Supply/Value Chain
- 4.3. PESTEL analysis
- 4.4. Market Entropy
- 4.5. Patent/Trademark Analysis
- 5. Global Hyperspectral Imaging Market Analysis, Insights and Forecast, 2019-2031
- 5.1. Market Analysis, Insights and Forecast - by End-user Industry
- 5.1.1. Food and Agriculture
- 5.1.2. Healthcare
- 5.1.3. Defense
- 5.1.4. Mining and Metrology
- 5.1.5. Recycling
- 5.1.6. Other End-user Verticals
- 5.2. Market Analysis, Insights and Forecast - by Region
- 5.2.1. North America
- 5.2.2. Europe
- 5.2.3. Asia
- 5.2.4. Australia and New Zealand
- 5.2.5. Latin America
- 5.2.6. Middle East and Africa
- 5.1. Market Analysis, Insights and Forecast - by End-user Industry
- 6. North America Hyperspectral Imaging Market Analysis, Insights and Forecast, 2019-2031
- 6.1. Market Analysis, Insights and Forecast - by End-user Industry
- 6.1.1. Food and Agriculture
- 6.1.2. Healthcare
- 6.1.3. Defense
- 6.1.4. Mining and Metrology
- 6.1.5. Recycling
- 6.1.6. Other End-user Verticals
- 6.1. Market Analysis, Insights and Forecast - by End-user Industry
- 7. Europe Hyperspectral Imaging Market Analysis, Insights and Forecast, 2019-2031
- 7.1. Market Analysis, Insights and Forecast - by End-user Industry
- 7.1.1. Food and Agriculture
- 7.1.2. Healthcare
- 7.1.3. Defense
- 7.1.4. Mining and Metrology
- 7.1.5. Recycling
- 7.1.6. Other End-user Verticals
- 7.1. Market Analysis, Insights and Forecast - by End-user Industry
- 8. Asia Hyperspectral Imaging Market Analysis, Insights and Forecast, 2019-2031
- 8.1. Market Analysis, Insights and Forecast - by End-user Industry
- 8.1.1. Food and Agriculture
- 8.1.2. Healthcare
- 8.1.3. Defense
- 8.1.4. Mining and Metrology
- 8.1.5. Recycling
- 8.1.6. Other End-user Verticals
- 8.1. Market Analysis, Insights and Forecast - by End-user Industry
- 9. Australia and New Zealand Hyperspectral Imaging Market Analysis, Insights and Forecast, 2019-2031
- 9.1. Market Analysis, Insights and Forecast - by End-user Industry
- 9.1.1. Food and Agriculture
- 9.1.2. Healthcare
- 9.1.3. Defense
- 9.1.4. Mining and Metrology
- 9.1.5. Recycling
- 9.1.6. Other End-user Verticals
- 9.1. Market Analysis, Insights and Forecast - by End-user Industry
- 10. Latin America Hyperspectral Imaging Market Analysis, Insights and Forecast, 2019-2031
- 10.1. Market Analysis, Insights and Forecast - by End-user Industry
- 10.1.1. Food and Agriculture
- 10.1.2. Healthcare
- 10.1.3. Defense
- 10.1.4. Mining and Metrology
- 10.1.5. Recycling
- 10.1.6. Other End-user Verticals
- 10.1. Market Analysis, Insights and Forecast - by End-user Industry
- 11. Middle East and Africa Hyperspectral Imaging Market Analysis, Insights and Forecast, 2019-2031
- 11.1. Market Analysis, Insights and Forecast - by End-user Industry
- 11.1.1. Food and Agriculture
- 11.1.2. Healthcare
- 11.1.3. Defense
- 11.1.4. Mining and Metrology
- 11.1.5. Recycling
- 11.1.6. Other End-user Verticals
- 11.1. Market Analysis, Insights and Forecast - by End-user Industry
- 12. North America Hyperspectral Imaging Market Analysis, Insights and Forecast, 2019-2031
- 12.1. Market Analysis, Insights and Forecast - By Country/Sub-region
- 12.1.1 United States
- 12.1.2 Canada
- 12.1.3 Mexico
- 13. Europe Hyperspectral Imaging Market Analysis, Insights and Forecast, 2019-2031
- 13.1. Market Analysis, Insights and Forecast - By Country/Sub-region
- 13.1.1 Germany
- 13.1.2 United Kingdom
- 13.1.3 France
- 13.1.4 Spain
- 13.1.5 Italy
- 13.1.6 Spain
- 13.1.7 Belgium
- 13.1.8 Netherland
- 13.1.9 Nordics
- 13.1.10 Rest of Europe
- 14. Asia Pacific Hyperspectral Imaging Market Analysis, Insights and Forecast, 2019-2031
- 14.1. Market Analysis, Insights and Forecast - By Country/Sub-region
- 14.1.1 China
- 14.1.2 Japan
- 14.1.3 India
- 14.1.4 South Korea
- 14.1.5 Southeast Asia
- 14.1.6 Australia
- 14.1.7 Indonesia
- 14.1.8 Phillipes
- 14.1.9 Singapore
- 14.1.10 Thailandc
- 14.1.11 Rest of Asia Pacific
- 15. South America Hyperspectral Imaging Market Analysis, Insights and Forecast, 2019-2031
- 15.1. Market Analysis, Insights and Forecast - By Country/Sub-region
- 15.1.1 Brazil
- 15.1.2 Argentina
- 15.1.3 Peru
- 15.1.4 Chile
- 15.1.5 Colombia
- 15.1.6 Ecuador
- 15.1.7 Venezuela
- 15.1.8 Rest of South America
- 16. North America Hyperspectral Imaging Market Analysis, Insights and Forecast, 2019-2031
- 16.1. Market Analysis, Insights and Forecast - By Country/Sub-region
- 16.1.1 United States
- 16.1.2 Canada
- 16.1.3 Mexico
- 17. MEA Hyperspectral Imaging Market Analysis, Insights and Forecast, 2019-2031
- 17.1. Market Analysis, Insights and Forecast - By Country/Sub-region
- 17.1.1 United Arab Emirates
- 17.1.2 Saudi Arabia
- 17.1.3 South Africa
- 17.1.4 Rest of Middle East and Africa
- 18. Competitive Analysis
- 18.1. Global Market Share Analysis 2024
- 18.2. Company Profiles
- 18.2.1 Surface Optics Corporation
- 18.2.1.1. Overview
- 18.2.1.2. Products
- 18.2.1.3. SWOT Analysis
- 18.2.1.4. Recent Developments
- 18.2.1.5. Financials (Based on Availability)
- 18.2.2 HyperMed Imaging Inc
- 18.2.2.1. Overview
- 18.2.2.2. Products
- 18.2.2.3. SWOT Analysis
- 18.2.2.4. Recent Developments
- 18.2.2.5. Financials (Based on Availability)
- 18.2.3 Resonon Inc
- 18.2.3.1. Overview
- 18.2.3.2. Products
- 18.2.3.3. SWOT Analysis
- 18.2.3.4. Recent Developments
- 18.2.3.5. Financials (Based on Availability)
- 18.2.4 Specim Spectral Imaging Ltd
- 18.2.4.1. Overview
- 18.2.4.2. Products
- 18.2.4.3. SWOT Analysis
- 18.2.4.4. Recent Developments
- 18.2.4.5. Financials (Based on Availability)
- 18.2.5 HinaLea Imaging (TruTag Technologies Inc )
- 18.2.5.1. Overview
- 18.2.5.2. Products
- 18.2.5.3. SWOT Analysis
- 18.2.5.4. Recent Developments
- 18.2.5.5. Financials (Based on Availability)
- 18.2.6 Headwall Photonics Inc
- 18.2.6.1. Overview
- 18.2.6.2. Products
- 18.2.6.3. SWOT Analysis
- 18.2.6.4. Recent Developments
- 18.2.6.5. Financials (Based on Availability)
- 18.2.7 Telops Inc
- 18.2.7.1. Overview
- 18.2.7.2. Products
- 18.2.7.3. SWOT Analysis
- 18.2.7.4. Recent Developments
- 18.2.7.5. Financials (Based on Availability)
- 18.2.8 Cubert GmbH
- 18.2.8.1. Overview
- 18.2.8.2. Products
- 18.2.8.3. SWOT Analysis
- 18.2.8.4. Recent Developments
- 18.2.8.5. Financials (Based on Availability)
- 18.2.9 BaySpec Inc
- 18.2.9.1. Overview
- 18.2.9.2. Products
- 18.2.9.3. SWOT Analysis
- 18.2.9.4. Recent Developments
- 18.2.9.5. Financials (Based on Availability)
- 18.2.10 Galileo Group Inc
- 18.2.10.1. Overview
- 18.2.10.2. Products
- 18.2.10.3. SWOT Analysis
- 18.2.10.4. Recent Developments
- 18.2.10.5. Financials (Based on Availability)
- 18.2.11 XIMEA GmbH
- 18.2.11.1. Overview
- 18.2.11.2. Products
- 18.2.11.3. SWOT Analysis
- 18.2.11.4. Recent Developments
- 18.2.11.5. Financials (Based on Availability)
- 18.2.12 Norsk Elektro Optikk AS
- 18.2.12.1. Overview
- 18.2.12.2. Products
- 18.2.12.3. SWOT Analysis
- 18.2.12.4. Recent Developments
- 18.2.12.5. Financials (Based on Availability)
- 18.2.13 Brimrose Corporation of America
- 18.2.13.1. Overview
- 18.2.13.2. Products
- 18.2.13.3. SWOT Analysis
- 18.2.13.4. Recent Developments
- 18.2.13.5. Financials (Based on Availability)
- 18.2.14 Corning Incorporated
- 18.2.14.1. Overview
- 18.2.14.2. Products
- 18.2.14.3. SWOT Analysis
- 18.2.14.4. Recent Developments
- 18.2.14.5. Financials (Based on Availability)
- 18.2.15 ITRES Research Limited
- 18.2.15.1. Overview
- 18.2.15.2. Products
- 18.2.15.3. SWOT Analysis
- 18.2.15.4. Recent Developments
- 18.2.15.5. Financials (Based on Availability)
- 18.2.1 Surface Optics Corporation
List of Figures
- Figure 1: Global Hyperspectral Imaging Market Revenue Breakdown (Million, %) by Region 2024 & 2032
- Figure 2: North America Hyperspectral Imaging Market Revenue (Million), by Country 2024 & 2032
- Figure 3: North America Hyperspectral Imaging Market Revenue Share (%), by Country 2024 & 2032
- Figure 4: Europe Hyperspectral Imaging Market Revenue (Million), by Country 2024 & 2032
- Figure 5: Europe Hyperspectral Imaging Market Revenue Share (%), by Country 2024 & 2032
- Figure 6: Asia Pacific Hyperspectral Imaging Market Revenue (Million), by Country 2024 & 2032
- Figure 7: Asia Pacific Hyperspectral Imaging Market Revenue Share (%), by Country 2024 & 2032
- Figure 8: South America Hyperspectral Imaging Market Revenue (Million), by Country 2024 & 2032
- Figure 9: South America Hyperspectral Imaging Market Revenue Share (%), by Country 2024 & 2032
- Figure 10: North America Hyperspectral Imaging Market Revenue (Million), by Country 2024 & 2032
- Figure 11: North America Hyperspectral Imaging Market Revenue Share (%), by Country 2024 & 2032
- Figure 12: MEA Hyperspectral Imaging Market Revenue (Million), by Country 2024 & 2032
- Figure 13: MEA Hyperspectral Imaging Market Revenue Share (%), by Country 2024 & 2032
- Figure 14: North America Hyperspectral Imaging Market Revenue (Million), by End-user Industry 2024 & 2032
- Figure 15: North America Hyperspectral Imaging Market Revenue Share (%), by End-user Industry 2024 & 2032
- Figure 16: North America Hyperspectral Imaging Market Revenue (Million), by Country 2024 & 2032
- Figure 17: North America Hyperspectral Imaging Market Revenue Share (%), by Country 2024 & 2032
- Figure 18: Europe Hyperspectral Imaging Market Revenue (Million), by End-user Industry 2024 & 2032
- Figure 19: Europe Hyperspectral Imaging Market Revenue Share (%), by End-user Industry 2024 & 2032
- Figure 20: Europe Hyperspectral Imaging Market Revenue (Million), by Country 2024 & 2032
- Figure 21: Europe Hyperspectral Imaging Market Revenue Share (%), by Country 2024 & 2032
- Figure 22: Asia Hyperspectral Imaging Market Revenue (Million), by End-user Industry 2024 & 2032
- Figure 23: Asia Hyperspectral Imaging Market Revenue Share (%), by End-user Industry 2024 & 2032
- Figure 24: Asia Hyperspectral Imaging Market Revenue (Million), by Country 2024 & 2032
- Figure 25: Asia Hyperspectral Imaging Market Revenue Share (%), by Country 2024 & 2032
- Figure 26: Australia and New Zealand Hyperspectral Imaging Market Revenue (Million), by End-user Industry 2024 & 2032
- Figure 27: Australia and New Zealand Hyperspectral Imaging Market Revenue Share (%), by End-user Industry 2024 & 2032
- Figure 28: Australia and New Zealand Hyperspectral Imaging Market Revenue (Million), by Country 2024 & 2032
- Figure 29: Australia and New Zealand Hyperspectral Imaging Market Revenue Share (%), by Country 2024 & 2032
- Figure 30: Latin America Hyperspectral Imaging Market Revenue (Million), by End-user Industry 2024 & 2032
- Figure 31: Latin America Hyperspectral Imaging Market Revenue Share (%), by End-user Industry 2024 & 2032
- Figure 32: Latin America Hyperspectral Imaging Market Revenue (Million), by Country 2024 & 2032
- Figure 33: Latin America Hyperspectral Imaging Market Revenue Share (%), by Country 2024 & 2032
- Figure 34: Middle East and Africa Hyperspectral Imaging Market Revenue (Million), by End-user Industry 2024 & 2032
- Figure 35: Middle East and Africa Hyperspectral Imaging Market Revenue Share (%), by End-user Industry 2024 & 2032
- Figure 36: Middle East and Africa Hyperspectral Imaging Market Revenue (Million), by Country 2024 & 2032
- Figure 37: Middle East and Africa Hyperspectral Imaging Market Revenue Share (%), by Country 2024 & 2032
List of Tables
- Table 1: Global Hyperspectral Imaging Market Revenue Million Forecast, by Region 2019 & 2032
- Table 2: Global Hyperspectral Imaging Market Revenue Million Forecast, by End-user Industry 2019 & 2032
- Table 3: Global Hyperspectral Imaging Market Revenue Million Forecast, by Region 2019 & 2032
- Table 4: Global Hyperspectral Imaging Market Revenue Million Forecast, by Country 2019 & 2032
- Table 5: United States Hyperspectral Imaging Market Revenue (Million) Forecast, by Application 2019 & 2032
- Table 6: Canada Hyperspectral Imaging Market Revenue (Million) Forecast, by Application 2019 & 2032
- Table 7: Mexico Hyperspectral Imaging Market Revenue (Million) Forecast, by Application 2019 & 2032
- Table 8: Global Hyperspectral Imaging Market Revenue Million Forecast, by Country 2019 & 2032
- Table 9: Germany Hyperspectral Imaging Market Revenue (Million) Forecast, by Application 2019 & 2032
- Table 10: United Kingdom Hyperspectral Imaging Market Revenue (Million) Forecast, by Application 2019 & 2032
- Table 11: France Hyperspectral Imaging Market Revenue (Million) Forecast, by Application 2019 & 2032
- Table 12: Spain Hyperspectral Imaging Market Revenue (Million) Forecast, by Application 2019 & 2032
- Table 13: Italy Hyperspectral Imaging Market Revenue (Million) Forecast, by Application 2019 & 2032
- Table 14: Spain Hyperspectral Imaging Market Revenue (Million) Forecast, by Application 2019 & 2032
- Table 15: Belgium Hyperspectral Imaging Market Revenue (Million) Forecast, by Application 2019 & 2032
- Table 16: Netherland Hyperspectral Imaging Market Revenue (Million) Forecast, by Application 2019 & 2032
- Table 17: Nordics Hyperspectral Imaging Market Revenue (Million) Forecast, by Application 2019 & 2032
- Table 18: Rest of Europe Hyperspectral Imaging Market Revenue (Million) Forecast, by Application 2019 & 2032
- Table 19: Global Hyperspectral Imaging Market Revenue Million Forecast, by Country 2019 & 2032
- Table 20: China Hyperspectral Imaging Market Revenue (Million) Forecast, by Application 2019 & 2032
- Table 21: Japan Hyperspectral Imaging Market Revenue (Million) Forecast, by Application 2019 & 2032
- Table 22: India Hyperspectral Imaging Market Revenue (Million) Forecast, by Application 2019 & 2032
- Table 23: South Korea Hyperspectral Imaging Market Revenue (Million) Forecast, by Application 2019 & 2032
- Table 24: Southeast Asia Hyperspectral Imaging Market Revenue (Million) Forecast, by Application 2019 & 2032
- Table 25: Australia Hyperspectral Imaging Market Revenue (Million) Forecast, by Application 2019 & 2032
- Table 26: Indonesia Hyperspectral Imaging Market Revenue (Million) Forecast, by Application 2019 & 2032
- Table 27: Phillipes Hyperspectral Imaging Market Revenue (Million) Forecast, by Application 2019 & 2032
- Table 28: Singapore Hyperspectral Imaging Market Revenue (Million) Forecast, by Application 2019 & 2032
- Table 29: Thailandc Hyperspectral Imaging Market Revenue (Million) Forecast, by Application 2019 & 2032
- Table 30: Rest of Asia Pacific Hyperspectral Imaging Market Revenue (Million) Forecast, by Application 2019 & 2032
- Table 31: Global Hyperspectral Imaging Market Revenue Million Forecast, by Country 2019 & 2032
- Table 32: Brazil Hyperspectral Imaging Market Revenue (Million) Forecast, by Application 2019 & 2032
- Table 33: Argentina Hyperspectral Imaging Market Revenue (Million) Forecast, by Application 2019 & 2032
- Table 34: Peru Hyperspectral Imaging Market Revenue (Million) Forecast, by Application 2019 & 2032
- Table 35: Chile Hyperspectral Imaging Market Revenue (Million) Forecast, by Application 2019 & 2032
- Table 36: Colombia Hyperspectral Imaging Market Revenue (Million) Forecast, by Application 2019 & 2032
- Table 37: Ecuador Hyperspectral Imaging Market Revenue (Million) Forecast, by Application 2019 & 2032
- Table 38: Venezuela Hyperspectral Imaging Market Revenue (Million) Forecast, by Application 2019 & 2032
- Table 39: Rest of South America Hyperspectral Imaging Market Revenue (Million) Forecast, by Application 2019 & 2032
- Table 40: Global Hyperspectral Imaging Market Revenue Million Forecast, by Country 2019 & 2032
- Table 41: United States Hyperspectral Imaging Market Revenue (Million) Forecast, by Application 2019 & 2032
- Table 42: Canada Hyperspectral Imaging Market Revenue (Million) Forecast, by Application 2019 & 2032
- Table 43: Mexico Hyperspectral Imaging Market Revenue (Million) Forecast, by Application 2019 & 2032
- Table 44: Global Hyperspectral Imaging Market Revenue Million Forecast, by Country 2019 & 2032
- Table 45: United Arab Emirates Hyperspectral Imaging Market Revenue (Million) Forecast, by Application 2019 & 2032
- Table 46: Saudi Arabia Hyperspectral Imaging Market Revenue (Million) Forecast, by Application 2019 & 2032
- Table 47: South Africa Hyperspectral Imaging Market Revenue (Million) Forecast, by Application 2019 & 2032
- Table 48: Rest of Middle East and Africa Hyperspectral Imaging Market Revenue (Million) Forecast, by Application 2019 & 2032
- Table 49: Global Hyperspectral Imaging Market Revenue Million Forecast, by End-user Industry 2019 & 2032
- Table 50: Global Hyperspectral Imaging Market Revenue Million Forecast, by Country 2019 & 2032
- Table 51: Global Hyperspectral Imaging Market Revenue Million Forecast, by End-user Industry 2019 & 2032
- Table 52: Global Hyperspectral Imaging Market Revenue Million Forecast, by Country 2019 & 2032
- Table 53: Global Hyperspectral Imaging Market Revenue Million Forecast, by End-user Industry 2019 & 2032
- Table 54: Global Hyperspectral Imaging Market Revenue Million Forecast, by Country 2019 & 2032
- Table 55: Global Hyperspectral Imaging Market Revenue Million Forecast, by End-user Industry 2019 & 2032
- Table 56: Global Hyperspectral Imaging Market Revenue Million Forecast, by Country 2019 & 2032
- Table 57: Global Hyperspectral Imaging Market Revenue Million Forecast, by End-user Industry 2019 & 2032
- Table 58: Global Hyperspectral Imaging Market Revenue Million Forecast, by Country 2019 & 2032
- Table 59: Global Hyperspectral Imaging Market Revenue Million Forecast, by End-user Industry 2019 & 2032
- Table 60: Global Hyperspectral Imaging Market Revenue Million Forecast, by Country 2019 & 2032
Frequently Asked Questions
1. What is the projected Compound Annual Growth Rate (CAGR) of the Hyperspectral Imaging Market?
The projected CAGR is approximately 15.46%.
2. Which companies are prominent players in the Hyperspectral Imaging Market?
Key companies in the market include Surface Optics Corporation, HyperMed Imaging Inc, Resonon Inc, Specim Spectral Imaging Ltd, HinaLea Imaging (TruTag Technologies Inc ), Headwall Photonics Inc, Telops Inc, Cubert GmbH, BaySpec Inc, Galileo Group Inc, XIMEA GmbH, Norsk Elektro Optikk AS, Brimrose Corporation of America, Corning Incorporated, ITRES Research Limited.
3. What are the main segments of the Hyperspectral Imaging Market?
The market segments include End-user Industry.
4. Can you provide details about the market size?
The market size is estimated to be USD 226.08 Million as of 2022.
5. What are some drivers contributing to market growth?
Technological Advancements; Increasing Demand for Data Accuracy and Consistency.
6. What are the notable trends driving market growth?
Healthcare to be the Fastest Growing End User Segment.
7. Are there any restraints impacting market growth?
High Costs Associated with the Use of Hyperspectral Imaging.
8. Can you provide examples of recent developments in the market?
December 2023 - SPECIM recently launched an upgraded FX50 middle wave infrared hyperspectral camera model. The camera covers the full mid-wave infrared spectral range of 2.7 - 5.3 μm and has a 640-pixel spatial resolution, 35 nm spectral resolution, 30 μm adequate pixel size, and a maximum frame rate of 377 fps.
9. What pricing options are available for accessing the report?
Pricing options include single-user, multi-user, and enterprise licenses priced at USD 4750, USD 5250, and USD 8750 respectively.
10. Is the market size provided in terms of value or volume?
The market size is provided in terms of value, measured in Million.
11. Are there any specific market keywords associated with the report?
Yes, the market keyword associated with the report is "Hyperspectral Imaging Market," which aids in identifying and referencing the specific market segment covered.
12. How do I determine which pricing option suits my needs best?
The pricing options vary based on user requirements and access needs. Individual users may opt for single-user licenses, while businesses requiring broader access may choose multi-user or enterprise licenses for cost-effective access to the report.
13. Are there any additional resources or data provided in the Hyperspectral Imaging Market report?
While the report offers comprehensive insights, it's advisable to review the specific contents or supplementary materials provided to ascertain if additional resources or data are available.
14. How can I stay updated on further developments or reports in the Hyperspectral Imaging Market?
To stay informed about further developments, trends, and reports in the Hyperspectral Imaging Market, consider subscribing to industry newsletters, following relevant companies and organizations, or regularly checking reputable industry news sources and publications.
Methodology
Step 1 - Identification of Relevant Samples Size from Population Database


Step 2 - Approaches for Defining Global Market Size (Value, Volume* & Price*)

Note*: In applicable scenarios
Step 3 - Data Sources
Primary Research
- Web Analytics
- Survey Reports
- Research Institute
- Latest Research Reports
- Opinion Leaders
Secondary Research
- Annual Reports
- White Paper
- Latest Press Release
- Industry Association
- Paid Database
- Investor Presentations

Step 4 - Data Triangulation
Involves using different sources of information in order to increase the validity of a study
These sources are likely to be stakeholders in a program - participants, other researchers, program staff, other community members, and so on.
Then we put all data in single framework & apply various statistical tools to find out the dynamic on the market.
During the analysis stage, feedback from the stakeholder groups would be compared to determine areas of agreement as well as areas of divergence


